Cited by 24Cancer Immunotherapy and Biomarkersinterferon and immune responsesImmunotherapy and Immune Responses

The DOI matches its Crossref record; the references it cites are not checked yet.

Disulfiram/copper triggers cGAS-STING innate immunity pathway via ROS-induced DNA damage that potentiates antitumor response to PD-1 checkpoint blockade

Open access
Yuan, Mengmeng, Shi, Liang, Liu, Yan, Xiang, Ke, Zhang, Yan, Zhou, Ye, Wang, Jianling, Ji, Meiju, Hou, Peng·2025·International Journal of Biological Sciences

Abstract

cytotoxic lymphocytes and natural killer (NK) cells, and potentiated the therapeutic efficacy of PD-1 checkpoint blockade in murine tumor models. Overall, our findings provide a rationale underlying the anti-cancer and immunomodulatory function of DSF/Cu and highlight the potential of repurposing DSF to improve responses to ICBs in cancer patients.

Overview

The claims and statistics of this paper haven’t been checked yet.

Run the check — free, no account needed. It reads the open-access text and checks the sources it cites.

A few free checks a day · papers already verified open instantly · results are public

Integrity signals

Registry

Crossref · 10.7150/ijbs.105575

Cites

Statistics

Figures

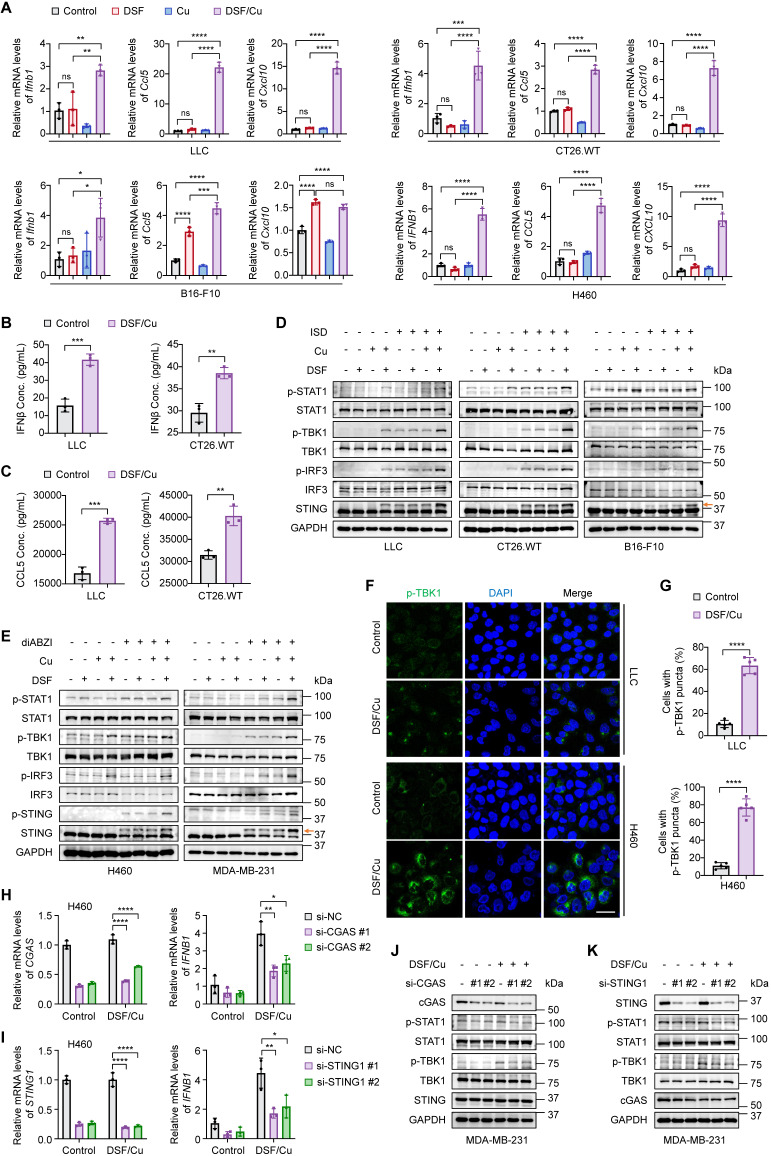
Figure 1 Activation of cGAS-STING-dependent cancer cell-intrinsic innate immunity by combined treatment of DSF and Cu. Several mouse or human cancer cell lines were treated with DSF (1 μM for H460 and 0.5 μM for others) and CuCl2 (1 μM for H460 and 0.5 μM for others), individually or in combination (at 1:1 molar ratio), for 24 h. Control groups were synchronously treated with the same volume of DMSO or water. (A) qRT-PCR was performed to detect mRNA levels of IFNB1, CCL5, and CXCL10 in indicated cells. (B-C) ELISA was used to measure the production of mouse IFNβ (B) and CCL5 (C) in the culture supernatants of the indicated cells upon DSF/Cu treatment. (D-E) Immunoblotting analysis of the indicated proteins in mouse (D) and human (E) cancer cells treated with DSF and/or CuCl2, followed by 1 μg/mL ISD stimulation for 4 h or 5 μM diABZI stimulation for 2 h. The orange arrow points to the band of phosphorylated STING. (F) Representative fluorescence images of DAPI (blue) and p-TBK1 (green) staining in LLC and H460 cells. Scale bar, 30 μm. (G) Quantification of the percentage of cells with one or more p-TBK1 puncta. H460 and MDA-MB-231 cells were transfected with siRNAs targeting CGAS or STING for 48 h and then treated with 1 μM DSF/Cu for another 24 h. (H-I) qRT-PCR was performed to detect mRNA levels of CGAS, STING1, and IFNB1 in H460 cells treated as indicated. (J-K) Immunoblotting analysis of the indicated proteins in MDA-MB-231 cells. All data are shown as mean ± SD of independent biological replicates, and p values were determined by unpaired Student's t test (for two groups data) or one-way ANOVA followed by Tukey's multiple comparisons test (for four groups data). ****p < 0.0001, ***p < 0.001, **p < 0.01, *p < 0.05; ns, not significant.
Figure 1 Activation of cGAS-STING-dependent cancer cell-intrinsic innate immunity by combined treatment of DSF and Cu. Several mouse or human cancer cell lines were treated with DSF (1 μM for H460 and 0.5 μM for others) and CuCl2 (1 μM for H460 and 0.5 μM for others), individually or in combination (at 1:1 molar ratio), for 24 h. Control groups were synchronously treated with the same volume of DMSO or water. (A) qRT-PCR was performed to detect mRNA levels of IFNB1, CCL5, and CXCL10 in indicated cells. (B-C) ELISA was used to measure the production of mouse IFNβ (B) and CCL5 (C) in the culture supernatants of the indicated cells upon DSF/Cu treatment. (D-E) Immunoblotting analysis of the indicated proteins in mouse (D) and human (E) cancer cells treated with DSF and/or CuCl2, followed by 1 μg/mL ISD stimulation for 4 h or 5 μM diABZI stimulation for 2 h. The orange arrow points to the band of phosphorylated STING. (F) Representative fluorescence images of DAPI (blue) and p-TBK1 (green) staining in LLC and H460 cells. Scale bar, 30 μm. (G) Quantification of the percentage of cells with one or more p-TBK1 puncta. H460 and MDA-MB-231 cells were transfected with siRNAs targeting CGAS or STING for 48 h and then treated with 1 μM DSF/Cu for another 24 h. (H-I) qRT-PCR was performed to detect mRNA levels of CGAS, STING1, and IFNB1 in H460 cells treated as indicated. (J-K) Immunoblotting analysis of the indicated proteins in MDA-MB-231 cells. All data are shown as mean ± SD of independent biological replicates, and p values were determined by unpaired Student's t test (for two groups data) or one-way ANOVA followed by Tukey's multiple comparisons test (for four groups data). ****p < 0.0001, ***p < 0.001, **p < 0.01, *p < 0.05; ns, not significant.CC BY · PubMed Central
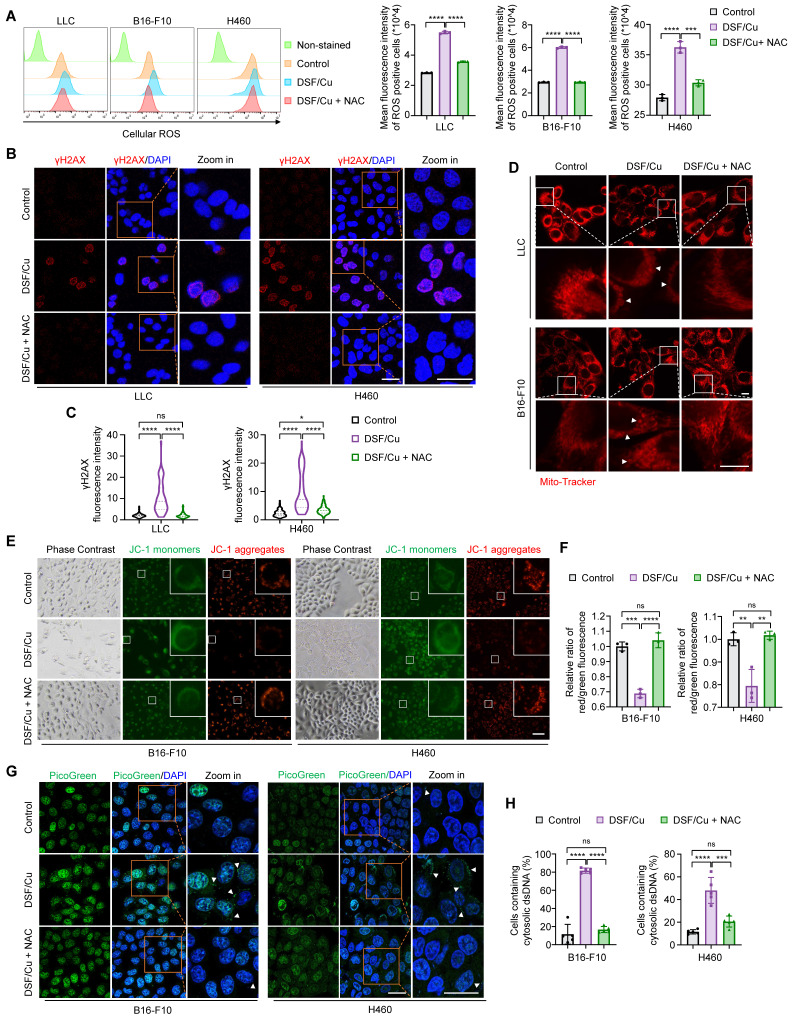
Figure 2 DSF/Cu induces ROS generation to trigger nuclear and mitochondrial DNA damage and cytoplasmic release of dsDNA. The indicated cells were treated with DSF/Cu (1 μM for H460 and 0.5 μM for others, at 1:1 molar ratio) alone or in combination with 2 mM NAC for 24 h. (A) Representative flow cytometry results showed cellular ROS levels of cells treated as indicated. Right panel indicated the quantitative analysis of ROS levels based on the mean intensity of the CellROX® Deep Red fluorescence on flow cytometer. (B) Representative images of γH2AX foci (red) and DAPI nuclear staining (blue) in LLC and H460 cells treated as indicated. Scale bars, 30 μm. (C) The fluorescence intensity of more than 50 cells per group was quantified. (D) Representative images of mitochondrial morphology of cells treated as indicated. Cells was labeled with a mitochondrial-specific fluorescence probe, Mito-Tracker Deep Red FM. White triangles indicate fragmented or swollen mitochondria. Scale bars, 10 μm. (E) Representative images of mitochondrial membrane potential changes tested by JC-1 fluorescence probe in cells treated as indicated. Green fluorescence showed JC-1 as monomers when mitochondrial membrane potential was in a low level, while red fluorescence showed JC-1 aggregating in mitochondrial matrix when mitochondrial membrane potential was in a high level. (F) Quantitative analysis of the relative ratios of JC-1 red/green fluorescence in the indicated groups. Scale bar, 100 μm. (G) Representative images of PicoGreen staining (green) and DAPI nuclear staining (blue) in B16-F10 and H460 cells treated as indicated. Scale bars, 30 μm. (H) Quantification of the percentage of cells containing cytosolic dsDNA foci. All data are presented as mean ± SD of independent biological replicates, and p values were determined by one-way ANOVA followed by Tukey's multiple comparisons test. ****p < 0.0001, ***p < 0.001, **p < 0.01; ns, not significant.
Figure 2 DSF/Cu induces ROS generation to trigger nuclear and mitochondrial DNA damage and cytoplasmic release of dsDNA. The indicated cells were treated with DSF/Cu (1 μM for H460 and 0.5 μM for others, at 1:1 molar ratio) alone or in combination with 2 mM NAC for 24 h. (A) Representative flow cytometry results showed cellular ROS levels of cells treated as indicated. Right panel indicated the quantitative analysis of ROS levels based on the mean intensity of the CellROX® Deep Red fluorescence on flow cytometer. (B) Representative images of γH2AX foci (red) and DAPI nuclear staining (blue) in LLC and H460 cells treated as indicated. Scale bars, 30 μm. (C) The fluorescence intensity of more than 50 cells per group was quantified. (D) Representative images of mitochondrial morphology of cells treated as indicated. Cells was labeled with a mitochondrial-specific fluorescence probe, Mito-Tracker Deep Red FM. White triangles indicate fragmented or swollen mitochondria. Scale bars, 10 μm. (E) Representative images of mitochondrial membrane potential changes tested by JC-1 fluorescence probe in cells treated as indicated. Green fluorescence showed JC-1 as monomers when mitochondrial membrane potential was in a low level, while red fluorescence showed JC-1 aggregating in mitochondrial matrix when mitochondrial membrane potential was in a high level. (F) Quantitative analysis of the relative ratios of JC-1 red/green fluorescence in the indicated groups. Scale bar, 100 μm. (G) Representative images of PicoGreen staining (green) and DAPI nuclear staining (blue) in B16-F10 and H460 cells treated as indicated. Scale bars, 30 μm. (H) Quantification of the percentage of cells containing cytosolic dsDNA foci. All data are presented as mean ± SD of independent biological replicates, and p values were determined by one-way ANOVA followed by Tukey's multiple comparisons test. ****p < 0.0001, ***p < 0.001, **p < 0.01; ns, not significant.CC BY · PubMed Central
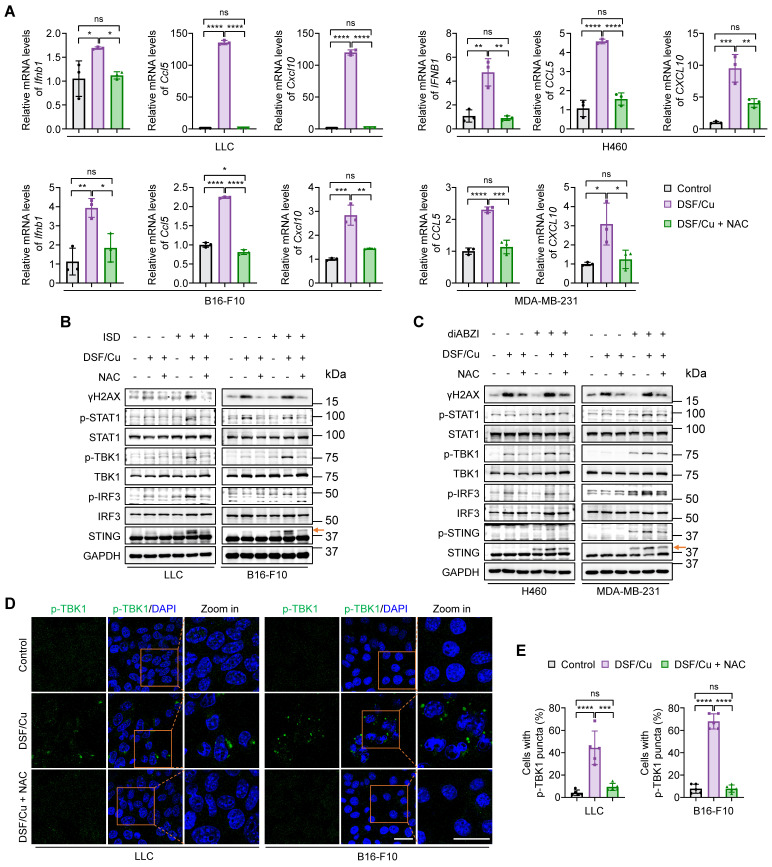
Figure 3 Blockage of DSF/Cu-induced innate immunity activation by ROS clearance. Cells were treated with DSF/Cu (1 μM for H460 and 0.5 μM for others, at 1:1 molar ratio) alone or in combination with 2 mM NAC for 24 h. (A) qRT-PCR was performed to detect mRNA levels of IFNB1, CCL5, and CXCL10 in indicated cells. (B-C) Immunoblotting analysis of the indicated proteins in mouse (B) and human (C) cancer cells treated with DSF/Cu, followed by 1 μg/mL ISD stimulation for 4 h or 5 μM diABZI stimulation for 2 h. The orange arrow points to the band of phosphorylated STING. (D) Representative fluorescence images of DAPI and p-TBK1 staining in LLC and B16-F10 cells treated as indicated. Scale bars, 30 μm. (E) Quantification of the percentage of cells with one or more p-TBK1 puncta. All data are shown as mean ± SD of independent biological replicates, and p values were determined by one-way ANOVA followed by Tukey's multiple comparisons test. ****p < 0.0001, ***p < 0.001, **p < 0.01, *p < 0.05; ns, not significant.
Figure 3 Blockage of DSF/Cu-induced innate immunity activation by ROS clearance. Cells were treated with DSF/Cu (1 μM for H460 and 0.5 μM for others, at 1:1 molar ratio) alone or in combination with 2 mM NAC for 24 h. (A) qRT-PCR was performed to detect mRNA levels of IFNB1, CCL5, and CXCL10 in indicated cells. (B-C) Immunoblotting analysis of the indicated proteins in mouse (B) and human (C) cancer cells treated with DSF/Cu, followed by 1 μg/mL ISD stimulation for 4 h or 5 μM diABZI stimulation for 2 h. The orange arrow points to the band of phosphorylated STING. (D) Representative fluorescence images of DAPI and p-TBK1 staining in LLC and B16-F10 cells treated as indicated. Scale bars, 30 μm. (E) Quantification of the percentage of cells with one or more p-TBK1 puncta. All data are shown as mean ± SD of independent biological replicates, and p values were determined by one-way ANOVA followed by Tukey's multiple comparisons test. ****p < 0.0001, ***p < 0.001, **p < 0.01, *p < 0.05; ns, not significant.CC BY · PubMed Central
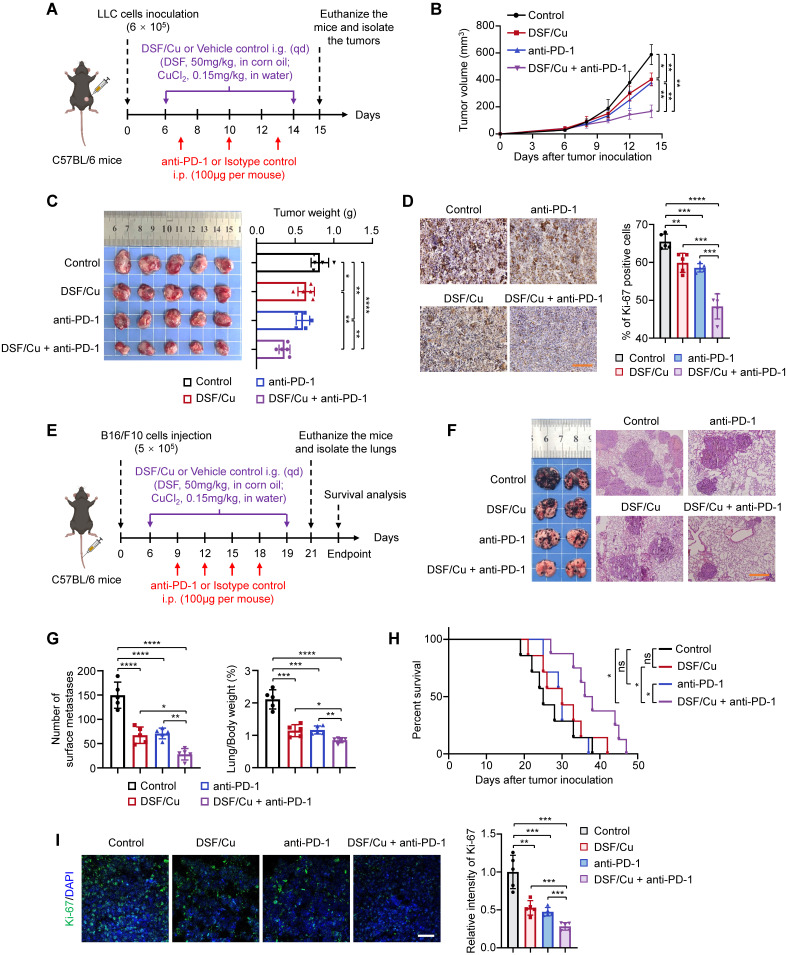
Figure 4 DSF/Cu suppresses tumor growth and potentiates the efficacy of anti-PD-1 therapy in mice. (A) Schematic diagram of LLC subcutaneous tumor model and treatment process of DSF/Cu and anti-PD-1 antibody. LLC cells (6 × 10⁵) were subcutaneously injected into the right flank of C57BL/6 mice, and mice were then randomly grouped (n =5 per group) and treated with DSF/Cu (DSF 50 mg/kg; CuCl2 0.15 mg/kg) or anti-PD-1 antibody (100μg per mouse) for the indicated times. The same dose of corn oil or isotype antibody were given synchronously as the control. All mice were sacrificed on day 15 and xenograft tumors were isolated for the following studies. i.g., oral gavage; i.p., intraperitoneal injection; qd, quaque die/every day. (B) Growth curves of LLC tumors of each group are shown (n = 5). Tumor growth was measured every 2 days and further analyzed by two-way ANOVA followed by Tukey's multiple comparisons test. (C) Representative images showing the volumes of LLC tumors (left panel), and quantitative analysis of tumor weights from the indicated groups (right panel). (D) Representative IHC images for Ki-67 staining of LLC tumor sections in the indicated groups (left panel), and quantification of the percentage of Ki-67 positive cells (right panel). Scale bar, 100 μm. (E) Schematic diagram of B16-F10 lung metastasis model and treatment process of DSF/Cu and anti-PD-1 antibody. B16-F10 cells (5 × 10⁵) were injected into the tail vein of C57BL/6 mice, and mice were then randomly grouped (n =12~13 per group) and treated with DSF/Cu (DSF 50 mg/kg; CuCl2 0.15 mg/kg) or anti-PD-1 antibody (100 μg per mouse) for the indicated times. The same dose of corn oil or isotype antibody were given synchronously as the control. Some of the mice were sacrificed on day 19 and tumor-bearing lungs were isolated for the following studies. i.g., oral gavage; i.p., intraperitoneal injection. qd, quaque die/every day. (F) Representative images of melanoma-bearing lungs (left panel) and H&E stained-lung sections (right panel) from the indicated groups (n = 5). Scale bar, 400 μm. (G) Quantitative analysis for number of surface metastatic nodules (left panel) and the ratios of lung weight to body weight of mice from the indicated groups (right panel). (H) Survival curves of B16-F10 tumor-bearing mice after treatments are shown and were analyzed using the Kaplan-Meier method. p value was calculated by log rank test. (n = 8 for the group of DSF/Cu + anti-PD-1, n = 7 for the other groups). (I) Representative IF images for Ki-67 staining (green) of B16-F10 tumor sections in the indicated groups (left panel) and quantification of relative fluorescence intensity of Ki-67 staining (right panel) (n = 5). Scale bar, 50 μm. All data are shown as means ± SD, and p values were calculated by one-way ANOVA followed by Tukey's multiple comparisons test unless otherwise specified. ****p < 0.0001, ***p < 0.001, **p < 0.01, *p < 0.05.
Figure 4 DSF/Cu suppresses tumor growth and potentiates the efficacy of anti-PD-1 therapy in mice. (A) Schematic diagram of LLC subcutaneous tumor model and treatment process of DSF/Cu and anti-PD-1 antibody. LLC cells (6 × 10⁵) were subcutaneously injected into the right flank of C57BL/6 mice, and mice were then randomly grouped (n =5 per group) and treated with DSF/Cu (DSF 50 mg/kg; CuCl2 0.15 mg/kg) or anti-PD-1 antibody (100μg per mouse) for the indicated times. The same dose of corn oil or isotype antibody were given synchronously as the control. All mice were sacrificed on day 15 and xenograft tumors were isolated for the following studies. i.g., oral gavage; i.p., intraperitoneal injection; qd, quaque die/every day. (B) Growth curves of LLC tumors of each group are shown (n = 5). Tumor growth was measured every 2 days and further analyzed by two-way ANOVA followed by Tukey's multiple comparisons test. (C) Representative images showing the volumes of LLC tumors (left panel), and quantitative analysis of tumor weights from the indicated groups (right panel). (D) Representative IHC images for Ki-67 staining of LLC tumor sections in the indicated groups (left panel), and quantification of the percentage of Ki-67 positive cells (right panel). Scale bar, 100 μm. (E) Schematic diagram of B16-F10 lung metastasis model and treatment process of DSF/Cu and anti-PD-1 antibody. B16-F10 cells (5 × 10⁵) were injected into the tail vein of C57BL/6 mice, and mice were then randomly grouped (n =12~13 per group) and treated with DSF/Cu (DSF 50 mg/kg; CuCl2 0.15 mg/kg) or anti-PD-1 antibody (100 μg per mouse) for the indicated times. The same dose of corn oil or isotype antibody were given synchronously as the control. Some of the mice were sacrificed on day 19 and tumor-bearing lungs were isolated for the following studies. i.g., oral gavage; i.p., intraperitoneal injection. qd, quaque die/every day. (F) Representative images of melanoma-bearing lungs (left panel) and H&E stained-lung sections (right panel) from the indicated groups (n = 5). Scale bar, 400 μm. (G) Quantitative analysis for number of surface metastatic nodules (left panel) and the ratios of lung weight to body weight of mice from the indicated groups (right panel). (H) Survival curves of B16-F10 tumor-bearing mice after treatments are shown and were analyzed using the Kaplan-Meier method. p value was calculated by log rank test. (n = 8 for the group of DSF/Cu + anti-PD-1, n = 7 for the other groups). (I) Representative IF images for Ki-67 staining (green) of B16-F10 tumor sections in the indicated groups (left panel) and quantification of relative fluorescence intensity of Ki-67 staining (right panel) (n = 5). Scale bar, 50 μm. All data are shown as means ± SD, and p values were calculated by one-way ANOVA followed by Tukey's multiple comparisons test unless otherwise specified. ****p < 0.0001, ***p < 0.001, **p < 0.01, *p < 0.05.CC BY · PubMed Central
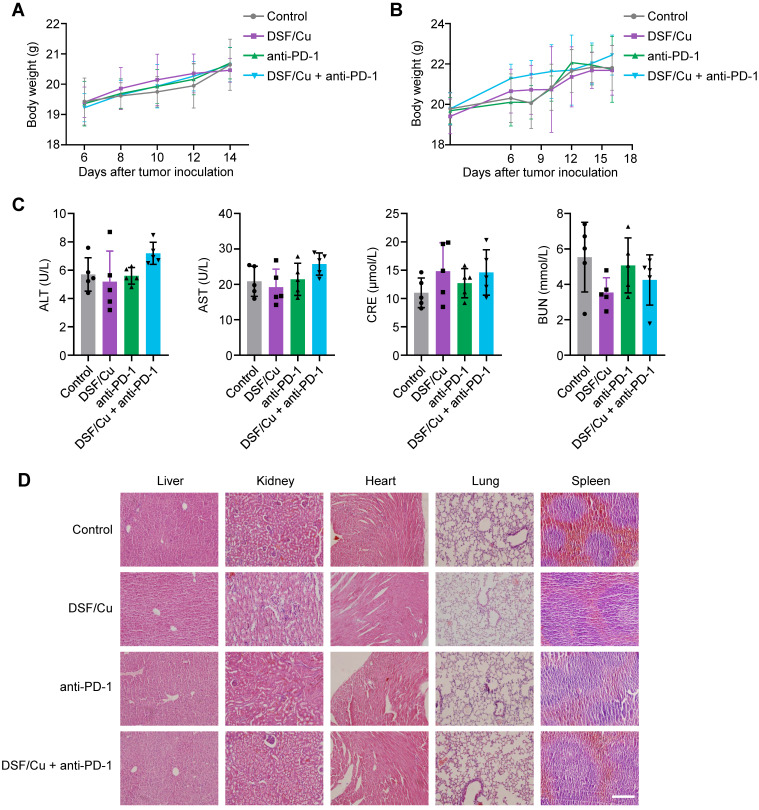
Figure 5 In vivo biosafety assessment of DSF/Cu. (A-B) Body weight curves of LLC tumor-bearing mice (A) and B16-F10 tumor-bearing mice (B) from the indicated groups are shown (n = 5). Body weights of mice were measured every 2 days and further analyzed by two-way ANOVA. (C) ELISA was used to measure the levels of alanine transaminase (ALT), aspartate aminotransferase (AST), serum creatinine (CRE), and blood urea nitrogen (BUN) in serum of mice with the indicated treatments. Data were analyzed by one-way ANOVA. (D) Representative images of H&E-stained organ sections of LLC tumor-bearing mice with the indicated treatments. Scale bar, 200 μm.
Figure 5 In vivo biosafety assessment of DSF/Cu. (A-B) Body weight curves of LLC tumor-bearing mice (A) and B16-F10 tumor-bearing mice (B) from the indicated groups are shown (n = 5). Body weights of mice were measured every 2 days and further analyzed by two-way ANOVA. (C) ELISA was used to measure the levels of alanine transaminase (ALT), aspartate aminotransferase (AST), serum creatinine (CRE), and blood urea nitrogen (BUN) in serum of mice with the indicated treatments. Data were analyzed by one-way ANOVA. (D) Representative images of H&E-stained organ sections of LLC tumor-bearing mice with the indicated treatments. Scale bar, 200 μm.CC BY · PubMed Central
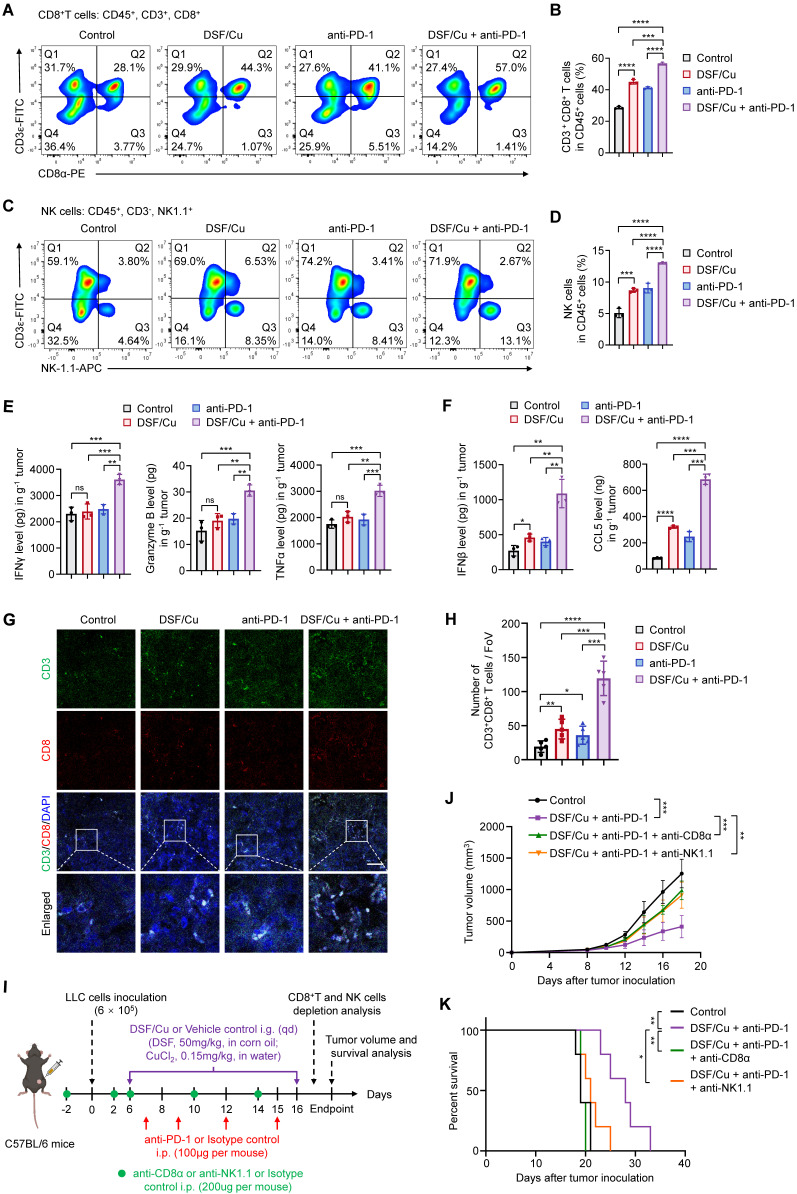
Figure 6 Combined treatment of DSF/Cu and anti-PD-1 antibody enhances anti-tumor immune response in mice. (A-B) Representative images of flow cytometry analysis (A) quantification (B) of the tumor-infiltrating CD8+ T cells in LLC tumors of the indicated groups. (C-D) Representative images of flow cytometry analysis (C) quantification (D) of the tumor-infiltrating NK cells in LLC tumors of the indicated groups. (E) The production of IFNγ, Granzyme B, and TNFα in LLC tumors of the indicated groups were measured by ELISA. (F) ELISA was used to measure the levels of chemokines IFNβ and CCL5 in LLC tumors with the indicated treatments. (G) Representative images for IF staining of CD3 (green), CD8 (red), and DAPI (blue) in B16-F10 tumor sections of the indicated groups. Scale bar, 50 μm. (H) Quantitative analysis for the numbers of CD3+CD8+ T cells in the above tumor sections (n = 5 fields of view [FoV]). (I) Schematic diagram of immune cell depletion model and treatment process of DSF/Cu, anti-PD-1 antibody, and depletion antibodies. LLC cells (6 × 10⁵) were subcutaneously injected into the right flank of C57BL/6 mice (n =6 per group) and treated with DSF/Cu (DSF 50 mg/kg; CuCl2 0.15 mg/kg), anti-PD-1 antibody (100μg per mouse), anti-CD8α antibody (200μg per mouse), or anti-NK1.1 antibody (200μg per mouse) for the indicated times. The same dose of corn oil or isotype antibody were given synchronously as the control. i.g., oral gavage; i.p., intraperitoneal injection; qd, quaque die/every day. (J) Growth curves of LLC tumors of each group are shown (n = 5). Tumor growth was measured every 2 days and further analyzed by two-way ANOVA followed by Tukey's multiple comparisons test. (K) Survival curves of LLC tumor-bearing mice after treatments are shown and were analyzed using the Kaplan-Meier method. p value was calculated by log rank test (n = 5). All data are shown as means ± SD, and p values were calculated by one-way ANOVA followed by Tukey's multiple comparisons test unless otherwise specified. ****p < 0.0001, ***p < 0.001, **p < 0.01, *p < 0.05; ns, not significant.
Figure 6 Combined treatment of DSF/Cu and anti-PD-1 antibody enhances anti-tumor immune response in mice. (A-B) Representative images of flow cytometry analysis (A) quantification (B) of the tumor-infiltrating CD8+ T cells in LLC tumors of the indicated groups. (C-D) Representative images of flow cytometry analysis (C) quantification (D) of the tumor-infiltrating NK cells in LLC tumors of the indicated groups. (E) The production of IFNγ, Granzyme B, and TNFα in LLC tumors of the indicated groups were measured by ELISA. (F) ELISA was used to measure the levels of chemokines IFNβ and CCL5 in LLC tumors with the indicated treatments. (G) Representative images for IF staining of CD3 (green), CD8 (red), and DAPI (blue) in B16-F10 tumor sections of the indicated groups. Scale bar, 50 μm. (H) Quantitative analysis for the numbers of CD3+CD8+ T cells in the above tumor sections (n = 5 fields of view [FoV]). (I) Schematic diagram of immune cell depletion model and treatment process of DSF/Cu, anti-PD-1 antibody, and depletion antibodies. LLC cells (6 × 10⁵) were subcutaneously injected into the right flank of C57BL/6 mice (n =6 per group) and treated with DSF/Cu (DSF 50 mg/kg; CuCl2 0.15 mg/kg), anti-PD-1 antibody (100μg per mouse), anti-CD8α antibody (200μg per mouse), or anti-NK1.1 antibody (200μg per mouse) for the indicated times. The same dose of corn oil or isotype antibody were given synchronously as the control. i.g., oral gavage; i.p., intraperitoneal injection; qd, quaque die/every day. (J) Growth curves of LLC tumors of each group are shown (n = 5). Tumor growth was measured every 2 days and further analyzed by two-way ANOVA followed by Tukey's multiple comparisons test. (K) Survival curves of LLC tumor-bearing mice after treatments are shown and were analyzed using the Kaplan-Meier method. p value was calculated by log rank test (n = 5). All data are shown as means ± SD, and p values were calculated by one-way ANOVA followed by Tukey's multiple comparisons test unless otherwise specified. ****p < 0.0001, ***p < 0.001, **p < 0.01, *p < 0.05; ns, not significant.CC BY · PubMed Central
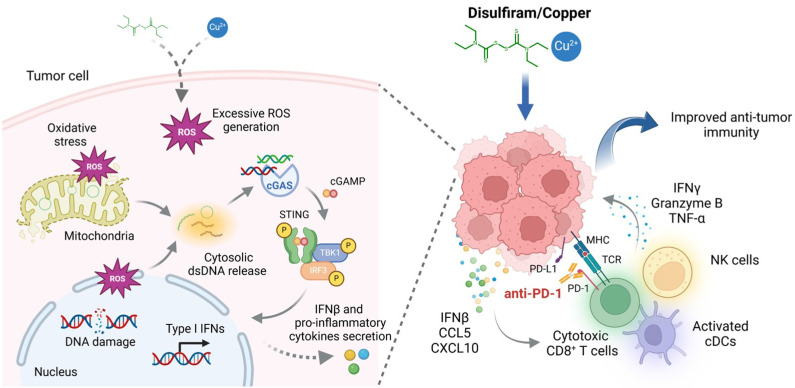
Figure 7 A schematic model illustrating the mechanisms by which DSF/Cu activates innate immune signaling pathway to enhance anti-tumor immunity and potentiate therapeutic responses to PD-1 checkpoint blockade (created with BioRender.com). DSF/Cu induces oxidative stress and DNA damage in tumor cells by generating excessive ROS. This process leads to the release of cytosolic dsDNA, which robustly activates the cancer cell-intrinsic cGAS-STING-dependent innate immune signaling pathway. Consequently, tumor cells produce IFNβ and pro-inflammatory chemokines, such as CCL5 and CXCL10, which recruit conventional dendritic cells (cDCs), CD8+ cytotoxic lymphocytes, and natural killer (NK) cells into the tumor microenvironment (TME). This infiltration converts the TME into an inflamed or "hot" immunophenotype, enhancing sensitivity to immune checkpoint blockade therapies. Therefore, the combination of DSF/Cu with anti-PD-1 antibodies significantly enhances immune responses, demonstrating superior therapeutic efficacy in suppressing tumor growth.
Figure 7 A schematic model illustrating the mechanisms by which DSF/Cu activates innate immune signaling pathway to enhance anti-tumor immunity and potentiate therapeutic responses to PD-1 checkpoint blockade (created with BioRender.com). DSF/Cu induces oxidative stress and DNA damage in tumor cells by generating excessive ROS. This process leads to the release of cytosolic dsDNA, which robustly activates the cancer cell-intrinsic cGAS-STING-dependent innate immune signaling pathway. Consequently, tumor cells produce IFNβ and pro-inflammatory chemokines, such as CCL5 and CXCL10, which recruit conventional dendritic cells (cDCs), CD8+ cytotoxic lymphocytes, and natural killer (NK) cells into the tumor microenvironment (TME). This infiltration converts the TME into an inflamed or "hot" immunophenotype, enhancing sensitivity to immune checkpoint blockade therapies. Therefore, the combination of DSF/Cu with anti-PD-1 antibodies significantly enhances immune responses, demonstrating superior therapeutic efficacy in suppressing tumor growth.CC BY · PubMed Central

Verification

Claims the paper makes

The claims and statistics of this paper haven’t been checked yet.

Run the check — free, no account needed. It reads the open-access text and checks the sources it cites.

A few free checks a day · papers already verified open instantly · results are public

Claims other papers make about this one

Each is checked against this paper’s own text: does it say what the citing paper says it does?

Self-check

Percentages, sums and reported differences re-computed from the paper’s own numbers.

The self-check needs the paper’s full text.

Citations

The citation lists are queued

They are fetched later and appear here then.

References 2 · Cited by 24

Research works printed but not linked: 66

  1. [1]Ribas A Wolchok JD Cancer immunotherapy using checkpoint blockade Science (New York, NY) 2018 359 1350 5 PMC7391259 29567705
  2. [2]Zou W Wolchok JD Chen L PD-L1 (B7-H1) and PD-1 pathway blockade for cancer therapy: Mechanisms, response biomarkers, and combinations Sci Transl Med 2016 8 328rv4 PMC4859220 26936508
  3. [3]Hamid O Robert C Daud A Hodi FS Hwu WJ Kefford R Five-year survival outcomes for patients with advanced melanoma treated with pembrolizumab in KEYNOTE-001 Ann Oncol 2019 30 582 8 30715153 PMC6503622
  4. [4]Reck M Remon J Hellmann MD First-Line Immunotherapy for Non-Small-Cell Lung Cancer J Clin Oncol 2022 40 586 97 34985920
  5. [5]Vesely MD Zhang T Chen L Resistance Mechanisms to Anti-PD Cancer Immunotherapy Annual Review of Immunology 2022 40 45 74 35471840
  6. [6]Kim TK Herbst RS Chen L Defining and Understanding Adaptive Resistance in Cancer Immunotherapy Trends In Immunology 2018 39 624 31 29802087 PMC6066429
  7. [7]Hegde PS Chen DS Top 10 Challenges in Cancer Immunotherapy Immunity 2020 52 17 35 31940268
  8. [8]Motwani M Pesiridis S Fitzgerald KA DNA sensing by the cGAS-STING pathway in health and disease Nature Reviews Genetics 2019 20 657 74 31358977
  9. [9]Chen Q Sun L Chen ZJ Regulation and function of the cGAS-STING pathway of cytosolic DNA sensing Nature Immunology 2016 17 1142 9 27648547
  10. [10]Demaria O Cornen S Daëron M Morel Y Medzhitov R Vivier E Harnessing innate immunity in cancer therapy Nature 2019 574 45 56 31578484
  11. [11]Kwon J Bakhoum SF The Cytosolic DNA-Sensing cGAS-STING Pathway in Cancer Cancer Discovery 2020 10 26 39 31852718 PMC7151642
  12. [12]Garland KM Sheehy TL Wilson JT Chemical and Biomolecular Strategies for STING Pathway Activation in Cancer Immunotherapy Chem Rev 2022 122 5977 6039 35107989 PMC8994686
  13. [13]Shen J Zhao W Ju Z Wang L Peng Y Labrie M PARPi Triggers the STING-Dependent Immune Response and Enhances the Therapeutic Efficacy of Immune Checkpoint Blockade Independent of BRCAness Cancer Res 2019 79 311 9 30482774 PMC6588002
  14. [14]Lohard S Bourgeois N Maillet L Gautier F Fétiveau A Lasla H STING-dependent paracriny shapes apoptotic priming of breast tumors in response to anti-mitotic treatment Nature Communications 2020 11 259 PMC6959316 31937780
  15. [15]Cvek B Nonprofit drugs as the salvation of the world's healthcare systems: the case of Antabuse (disulfiram) Drug Discov Today 2012 17 409 12 22192884
  16. [16]Shen ML Johnson KL Mays DC Lipsky JJ Naylor S Determination of in vivo adducts of disulfiram with mitochondrial aldehyde dehydrogenase Biochem Pharmacol 2001 61 537 45 11239496
  17. [17]Lewison EF Spontaneous regression of breast cancer Natl Cancer Inst Monogr 1976 44 23 6 799758
  18. [18]Iljin K Ketola K Vainio P Halonen P Kohonen P Fey V High-throughput cell-based screening of 4910 known drugs and drug-like small molecules identifies disulfiram as an inhibitor of prostate cancer cell growth Clinical Cancer Research: an Official Journal of the American Association For Cancer Research 2009 15 6070 8 19789329
  19. [19]Chen D Cui QC Yang H Dou QP Disulfiram, a clinically used anti-alcoholism drug and copper-binding agent, induces apoptotic cell death in breast cancer cultures and xenografts via inhibition of the proteasome activity Cancer Res 2006 66 10425 33 17079463
  20. [20]Wang W McLeod HL Cassidy J Disulfiram-mediated inhibition of NF-kappaB activity enhances cytotoxicity of 5-fluorouracil in human colorectal cancer cell lines Int J Cancer 2003 104 504 11 12584750
  21. [21]Zha J Chen F Dong H Shi P Yao Y Zhang Y Disulfiram targeting lymphoid malignant cell lines via ROS-JNK activation as well as Nrf2 and NF-kB pathway inhibition J Transl Med 2014 12 163 24915933 PMC4075939
  22. [22]Skrott Z Mistrik M Andersen KK Friis S Majera D Gursky J Alcohol-abuse drug disulfiram targets cancer via p97 segregase adaptor NPL4 Nature 2017 552 194 9 29211715 PMC5730499
  23. [23]Terashima Y Toda E Itakura M Otsuji M Yoshinaga S Okumura K Targeting FROUNT with disulfiram suppresses macrophage accumulation and its tumor-promoting properties Nature Communications 2020 11 609 PMC6992764 32001710
  24. [24]Cen D Brayton D Shahandeh B Meyskens FL Farmer PJ Disulfiram facilitates intracellular Cu uptake and induces apoptosis in human melanoma cells J Med Chem 2004 47 6914 20 15615540
  25. [25]Allensworth JL Evans MK Bertucci F Aldrich AJ Festa RA Finetti P Disulfiram (DSF) acts as a copper ionophore to induce copper-dependent oxidative stress and mediate anti-tumor efficacy in inflammatory breast cancer Mol Oncol 2015 9 1155 68 25769405 PMC4493866
  26. [26]Hu JJ Liu X Xia S Zhang Z Zhang Y Zhao J FDA-approved disulfiram inhibits pyroptosis by blocking gasdermin D pore formation Nature Immunology 2020 21 736 45 32367036 PMC7316630
  27. [27]Sui M Wang S Zhou Y Dang H Zeng Z Gu K A tumor-responsive nanostrategy for reducing the risk of immunotherapy-related myocarditis Chemical Engineering Journal 2024 494 153131
  28. [28]Borden EC Interferons α and β in cancer: therapeutic opportunities from new insights Nature Reviews Drug Discovery 2019 18 219 34 30679806
  29. [29]Reschke R Gajewski TF CXCL9 and CXCL10 bring the heat to tumors Sci Immunol 2022 7 eabq6509 35867802
  30. [30]Dangaj D Bruand M Grimm AJ Ronet C Barras D Duttagupta PA Cooperation between Constitutive and Inducible Chemokines Enables T Cell Engraftment and Immune Attack in Solid Tumors Cancer Cell 2019 35 885 900.e10 31185212 PMC6961655
  31. [31]Liu S Cai X Wu J Cong Q Chen X Li T Phosphorylation of innate immune adaptor proteins MAVS, STING, and TRIF induces IRF3 activation Science (New York, NY) 2015 347 aaa2630 25636800
  32. [32]Ramanjulu JM Pesiridis GS Yang J Concha N Singhaus R Zhang S-Y Design of amidobenzimidazole STING receptor agonists with systemic activity Nature 2018 564 439 43 30405246
  33. [33]Zevini A Olagnier D Hiscott J Crosstalk between Cytoplasmic RIG-I and STING Sensing Pathways Trends In Immunology 2017 38 194 205 28073693 PMC5329138
  34. [34]Lu Y Pan Q Gao W Pu Y Luo K He B Leveraging disulfiram to treat cancer: Mechanisms of action, delivery strategies, and treatment regimens Biomaterials 2022 281 121335 34979419
  35. [35]Glorieux C Liu S Trachootham D Huang P Targeting ROS in cancer: rationale and strategies Nature Reviews Drug Discovery 2024 23 583 606 38982305
  36. [36]Dou Z Ghosh K Vizioli MG Zhu J Sen P Wangensteen KJ Cytoplasmic chromatin triggers inflammation in senescence and cancer Nature 2017 550 402 6 28976970 PMC5850938
  37. [37]West AP Khoury-Hanold W Staron M Tal MC Pineda CM Lang SM Mitochondrial DNA stress primes the antiviral innate immune response Nature 2015 520 553 7 25642965 PMC4409480
  38. [38]Lun X Wells JC Grinshtein N King JC Hao X Dang N-H Disulfiram when Combined with Copper Enhances the Therapeutic Effects of Temozolomide for the Treatment of Glioblastoma Clinical Cancer Research: an Official Journal of the American Association For Cancer Research 2016 22 3860 75 27006494
  39. [39]Yip NC Fombon IS Liu P Brown S Kannappan V Armesilla AL Disulfiram modulated ROS-MAPK and NFκB pathways and targeted breast cancer cells with cancer stem cell-like properties Br J Cancer 2011 104 1564 74 21487404 PMC3101904
  40. [40]Xu B Wang S Li R Chen K He L Deng M Disulfiram/copper selectively eradicates AML leukemia stem cells in vitro and in vivo by simultaneous induction of ROS-JNK and inhibition of NF-κB and Nrf2 Cell Death Dis 2017 8 e2797 28518151 PMC5520701
  41. [41]Chan DC Mitochondrial Dynamics and Its Involvement in Disease Annu Rev Pathol 2020 15 235 59 31585519
  42. [42]Oka S Kamata H Kamata K Yagisawa H Hirata H N-acetylcysteine suppresses TNF-induced NF-kappaB activation through inhibition of IkappaB kinases FEBS Lett 2000 472 196 202 10788610
  43. [43]Zhang L Wei X Wang Z Liu P Hou Y Xu Y NF-κB activation enhances STING signaling by altering microtubule-mediated STING trafficking Cell Reports 2023 42 112185 36857187
  44. [44]Guo W Jia L Xie L Kiang JG Wang Y Sun F Turning anecdotal irradiation-induced anticancer immune responses into reproducible in situ cancer vaccines via disulfiram/copper-mediated enhanced immunogenic cell death of breast cancer cells Cell Death Dis 2024 15 298 38678042 PMC11055882
  45. [45]Ganesh K Massagué J Targeting metastatic cancer Nature Medicine 2021 27 34 44 PMC7895475 33442008
  46. [46]Chen DS Mellman I Oncology meets immunology: the cancer-immunity cycle Immunity 2013 39 1 10 23890059
  47. [47]Cao LL Kagan JC Targeting innate immune pathways for cancer immunotherapy Immunity 2023 56 2206 17 37703879 PMC10591974
  48. [48]Shih AY Damm-Ganamet KL Mirzadegan T Dynamic Structural Differences between Human and Mouse STING Lead to Differing Sensitivity to DMXAA Biophys J 2018 114 32 9 29320694 PMC5773749
  49. [49]Motedayen Aval L Pease JE Sharma R Pinato DJ Challenges and Opportunities in the Clinical Development of STING Agonists for Cancer Immunotherapy J Clin Med 2020 9 3323 33081170 PMC7602874
  50. [50]Foote JB Kok M Leatherman JM Armstrong TD Marcinkowski BC Ojalvo LS A STING Agonist Given with OX40 Receptor and PD-L1 Modulators Primes Immunity and Reduces Tumor Growth in Tolerized Mice Cancer Immunol Res 2017 5 468 79 28483787 PMC5550830
  51. [51]Gogoi H Mansouri S Jin L The Age of Cyclic Dinucleotide Vaccine Adjuvants Vaccines (Basel) 2020 8 453 32823563 PMC7563944
  52. [52]Zhao K Huang J Zhao Y Wang S Xu J Yin K Targeting STING in cancer: Challenges and emerging opportunities Biochim Biophys Acta Rev Cancer 2023 1878 188983 37717857
  53. [53]Xie J Liu J Zhao M Li X Wang Y Zhao Y Disulfiram/Cu Kills and Sensitizes BRAF-Mutant Thyroid Cancer Cells to BRAF Kinase Inhibitor by ROS-Dependently Relieving Feedback Activation of MAPK/ERK and PI3K/AKT Pathways Int J Mol Sci 2023 24 3418 36834830 PMC9968072
  54. [54]Pantziarka P Verbaanderd C Huys I Bouche G Meheus L Repurposing drugs in oncology: From candidate selection to clinical adoption Semin Cancer Biol 2021 68 186 91 31982510
  55. [55]Huang J Chaudhary R Cohen AL Fink K Goldlust S Boockvar J A multicenter phase II study of temozolomide plus disulfiram and copper for recurrent temozolomide-resistant glioblastoma J Neurooncol 2019 142 537 44 30771200
  56. [56]Kannappan V Ali M Small B Rajendran G Elzhenni S Taj H Recent Advances in Repurposing Disulfiram and Disulfiram Derivatives as Copper-Dependent Anticancer Agents Front Mol Biosci 2021 8 741316 34604310 PMC8484884
  57. [57]Ge EJ Bush AI Casini A Cobine PA Cross JR DeNicola GM Connecting copper and cancer: from transition metal signalling to metalloplasia Nature Reviews Cancer 2022 22 102 13 34764459 PMC8810673
  58. [58]Huang S Xie P Huang X Chen Z Yang J Wang J Disulfiram combined with chemoimmunotherapy potentiates pancreatic cancer treatment efficacy through the activation of cGAS-STING signaling pathway via suppressing PARP1 expression Am J Cancer Res 2023 13 2055 65 37293156 PMC10244122
  59. [59]Cervantes-Cervantes MP Calderón-Salinas JV Albores A Muñoz-Sánchez JL Copper increases the damage to DNA and proteins caused by reactive oxygen species Biol Trace Elem Res 2005 103 229 48 15784956
  60. [61]Zheng X Liu Z Mi M Wen Q Wu G Zhang L Disulfiram Improves the Anti-PD-1 Therapy Efficacy by Regulating PD-L1 Expression via Epigenetically Reactivation of IRF7 in Triple Negative Breast Cancer Front Oncol 2021 11 734853 34858816 PMC8631359
  61. [62]Gupte A Mumper RJ Elevated copper and oxidative stress in cancer cells as a target for cancer treatment Cancer Treat Rev 2009 35 32 46 18774652
  62. [63]Zhao C Liang F Ye M Wu S Qin Y Zhao L GSDMD promotes neutrophil extracellular traps via mtDNA-cGAS-STING pathway during lung ischemia/reperfusion Cell Death Discov 2023 9 368 37794018 PMC10551007
  63. [64]Zhang Z-D Shi C-R Li F-X Gan H Wei Y Zhang Q Disulfiram ameliorates STING/MITA-dependent inflammation and autoimmunity by targeting RNF115 Cell Mol Immunol 2024 21 275 91 38267694 PMC10901794
  64. [65]Kanellis DC Zisi A Skrott Z Lemmens B Espinoza JA Kosar M Actionable cancer vulnerability due to translational arrest, p53 aggregation and ribosome biogenesis stress evoked by the disulfiram metabolite CuET Cell Death Differ 2023 30 1666 78 37142656 PMC10307793
  65. [66]Hao Q Jiao S Shi Z Li C Meng X Zhang Z A non-canonical role of the p97 complex in RIG-I antiviral signaling EMBO J 2015 34 2903 20 26471729 PMC4687688
  66. [67]Nie P Cao Z Yu R Dong C Zhang W Meng Y Targeting p97-Npl4 interaction inhibits tumor Treg cell development to enhance tumor immunity Nature Immunology 2024 25 1623 1636 39107403

Metadata

Authors
Yuan, M., Shi, L., Liu, Y., Xiang, K., Zhang, Y., Zhou, Y., Wang, J., Ji, M., & Hou, P.
Affiliations
  • First Affiliated Hospital of Xi'an Jiaotong University (CN)
  • China Medical University (CN)
Corresponding author
Hou, Peng
Venue
International Journal of Biological Sciences
Published
2025-02-03
Volume
21
Issue
4
Pages
1730-1748
ISSN
1449-2288 (ISSN-L)
OpenAlex
W4407776421
Cited by
24
References
2
Citations by year
2026: 15 · 2025: 9
FWCI
9.94
Type
journal article
Language
en
Open access
Licence
cc-by
Locations
  • International Journal of Biological Sciences (publishedVersion, cc-by)
  • PubMed Central (publishedVersion, cc-by)
  • PubMed (publishedVersion)
Topics
  • Health Sciences › Medicine › Oncology › Cancer Immunotherapy and Biomarkers
  • Life Sciences › Immunology and Microbiology › Immunology › interferon and immune responses
  • Life Sciences › Immunology and Microbiology › Immunology › Immunotherapy and Immune Responses
Keywords
disulfiram, copper, cGAS-STING pathway, innate immunity, reactive oxygen species, DNA damage, anti-PD-1 therapy, immune checkpoint inhibitors, cancer immunotherapy, drug repurposing, cytotoxic lymphocytes, natural killer cells
MeSH terms
Immune Checkpoint Inhibitors, STING Protein, Cyclic Guanosine Monophosphate-Adenosine Monophosphate Synthase, Animals, Copper, Disulfiram, DNA Damage, Humans, Immunity, Innate, Membrane Proteins, Mice, Inbred C57BL, Nucleotidyltransferases, Signal Transduction, Reactive Oxygen Species, Cell Line, Tumor, Mice, Programmed Cell Death 1 Receptor

About these checks

Registry, retraction, Cites and statistics results are computed, not judged, with one exception: a printed reference that no index lists is read once by a model before it counts as a citation error. Claims are extracted by a model and kept only when their quote appears verbatim in the text; each cited source is then checked, with a model’s help, for whether it says what the claim relies on. Those verdicts can be wrong — read the claim’s quote and the cited source before relying on one.

Statistics and arithmetic are recomputed, not judged.

Confidence bands are shown only for fields calibrated on our annotated test set. None is calibrated yet, so no band is shown.

What counts as a claim ›How we measure confidence ›How we check this ›

Are you an author, or do you see a problem with this page? Request a review

How to cite

Cite CoChat for the checks on this page, and the paper for its own findings.

This page
CoChat. (2026). Citation check: Disulfiram/copper triggers cGAS-STING innate immunity pathway via ROS-induced DNA damage that potentiates antitumor response to PD-1 checkpoint blockade. https://app.cochat.ai/papers/10.7150/ijbs.105575
The paper
Yuan, M., Shi, L., Liu, Y., Xiang, K., Zhang, Y., Zhou, Y., Wang, J., Ji, M., & Hou, P. (2025). Disulfiram/copper triggers cGAS-STING innate immunity pathway via ROS-induced DNA damage that potentiates antitumor response to PD-1 checkpoint blockade. International Journal of Biological Sciences. https://doi.org/10.7150/ijbs.105575