Cited by 77

The DOI matches its Crossref record; 6 of the 6 references it cites were found in a registry or an index.

Preconditioned extracellular vesicles from hypoxic microglia reduce poststroke AQP4 depolarization, disturbed cerebrospinal fluid flow, astrogliosis, and neuroinflammation

Xin, Wenqiang, Pan, Yongli, Wei, Wei, Tatenhorst, Lars, Graf, Irina, Popa-Wagner, Aurel, Gerner, Stefan T, Huber, Sabine, Kilic, Ertugrul, Hermann, Dirk M, Bähr, Mathias, Huttner, Hagen B, Doeppner, Thorsten R·2023·Theranostics

Overview

The claims and statistics of this paper haven’t been checked yet.

Run the check — free, no account needed. It reads the open-access text and checks the sources it cites.

A few free checks a day · papers already verified open instantly · results are public

Integrity signals

Registry

Crossref · 10.7150/thno.84059

Cites

6 of 6 references verified0 citation errors · 0 not checkable

Statistics

Figures

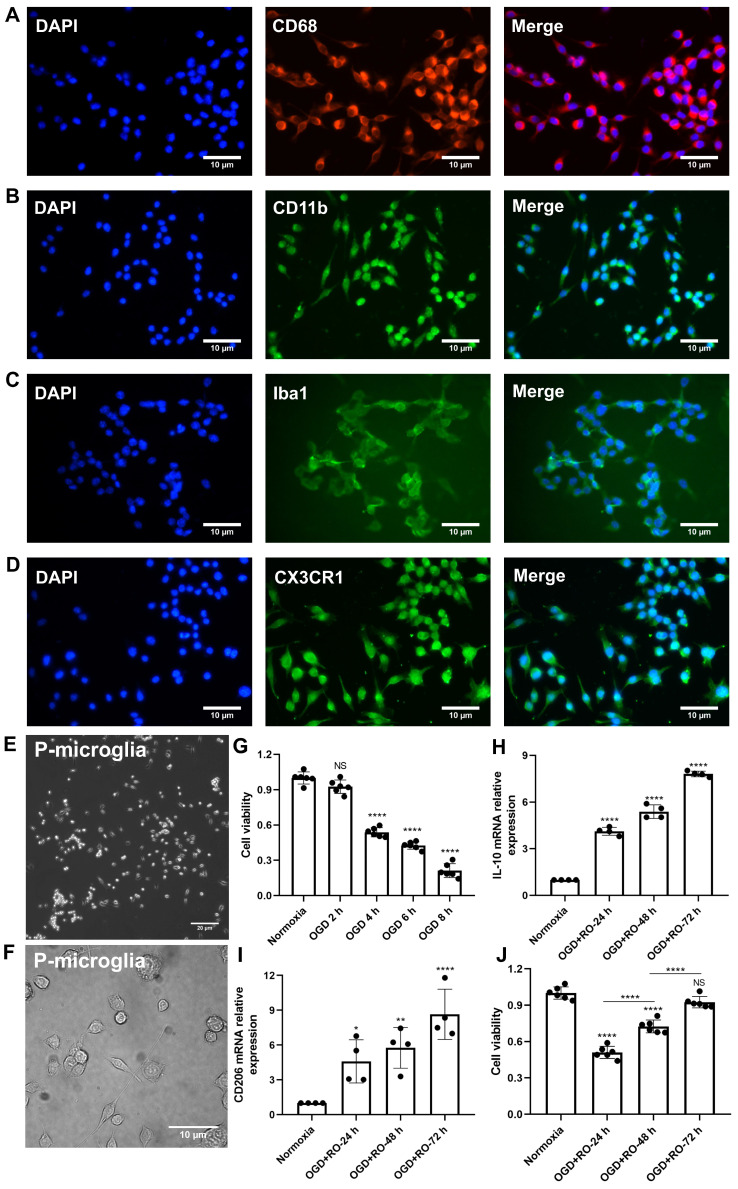
Figure 1 Identification of primary cortical microglia and the impact of hypoxia on microglial polarization. Primary microglia were extracted from neonatal C57BL/6 mice and plated for 24 h before use. Immunofluorescence staining found microglia positive for the expression of CD68 (A), CD11b (B), Iba1 (C), and CX3CR1 (D). DAPI was used as a counterstain for the cell nuclei. (E-F) Light microscopy of p3 passaged primary microglia in culture. Microglia appeared healthy and displayed processes and a ramified morphology. (G) MTT (Thiazolyl Blue Tetrazolium Bromide) was used to test the microglia viability exposed to 2, 4, 6, and 8 h of OGD followed by 24-h reoxygenation. Cells incubated under standard cell culture conditions ('Normoxia') were defined as 100% cell survival (n = 6). (H-I) RT-qPCR was employed to detect the M2 signature genes IL-10 and CD206 on the mRNA levels (n = 4). (J) MTT was used to test the cell viability exposed to 4 h of OGD followed by 24-, 48-, and 72-h reoxygenation. Cells incubated under standard cell culture conditions ('Normoxia') were defined as 100 % cell survival (n = 6). *p < 0.05; **p < 0.01; ****p < 0.0001; P-microglia, primary microglia; NS, not statistically significant; IL, Interleukin; OGD, oxygen-glucose deprivation; RT-qPCR, quantitative real-time PCR analysis; RO, reoxygenation.
Figure 1 Identification of primary cortical microglia and the impact of hypoxia on microglial polarization. Primary microglia were extracted from neonatal C57BL/6 mice and plated for 24 h before use. Immunofluorescence staining found microglia positive for the expression of CD68 (A), CD11b (B), Iba1 (C), and CX3CR1 (D). DAPI was used as a counterstain for the cell nuclei. (E-F) Light microscopy of p3 passaged primary microglia in culture. Microglia appeared healthy and displayed processes and a ramified morphology. (G) MTT (Thiazolyl Blue Tetrazolium Bromide) was used to test the microglia viability exposed to 2, 4, 6, and 8 h of OGD followed by 24-h reoxygenation. Cells incubated under standard cell culture conditions ('Normoxia') were defined as 100% cell survival (n = 6). (H-I) RT-qPCR was employed to detect the M2 signature genes IL-10 and CD206 on the mRNA levels (n = 4). (J) MTT was used to test the cell viability exposed to 4 h of OGD followed by 24-, 48-, and 72-h reoxygenation. Cells incubated under standard cell culture conditions ('Normoxia') were defined as 100 % cell survival (n = 6). *p < 0.05; **p < 0.01; ****p < 0.0001; P-microglia, primary microglia; NS, not statistically significant; IL, Interleukin; OGD, oxygen-glucose deprivation; RT-qPCR, quantitative real-time PCR analysis; RO, reoxygenation.CC BY · PubMed Central
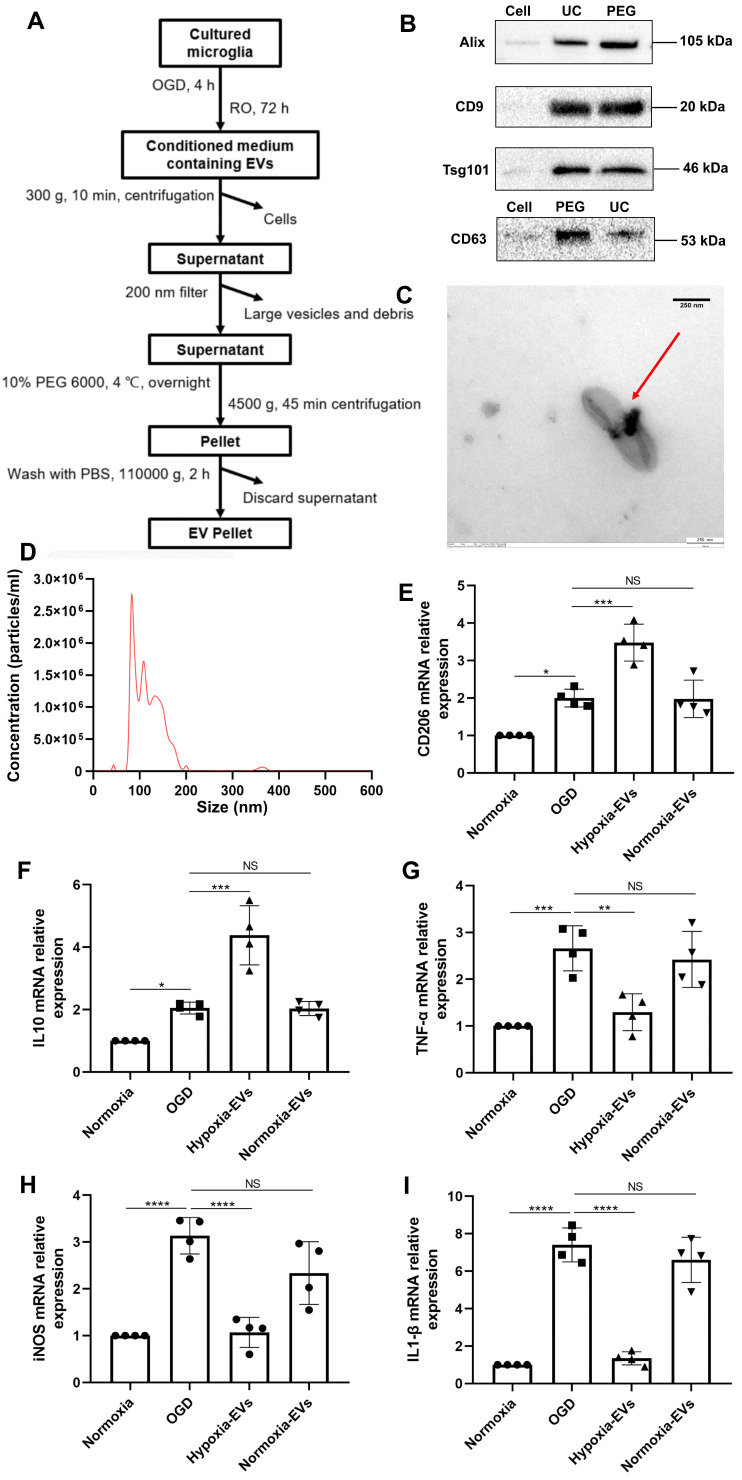
Figure 2 Characterization of EVs from formerly hypoxic microglia and the impact of the increased concentration of such EVs on cortical microglia polarization upon induction of hypoxia. (A) In the schematic diagram, EVs were enriched from the conditioned medium of OGD-preconditioned microglia by the method of PEG precipitation combined with various centrifugation steps. (B) Western blot analysis of EVs against the exosomal representative markers such as Alix, CD9, Tsg101 and CD63. Western blots were conducted on total cell lysates and EV lysates (UC and PEG) from hypoxia-preconditioned microglia. (C) TEM analysis of vesicles derived from hypoxic microglia. (D) The size distribution patterns of EVs were assessed by NTA (n = 3). (E-F) RT-qPCR analysis assay of M2 microglia polarization marker IL-10 and CD206 mRNA in primary microglia in three groups: normoxia, 4 h of OGD followed by 24-h reoxygenation, and 4 h of OGD followed by 24-h reoxygenation with EV treatment (n = 4). (G-I) RT-qPCR assay of M1 microglia polarization marker TNF-α, iNOS, and IL-1β mRNA in primary microglia (n = 4). *p < 0.05; **p < 0.01; ***p < 0.001; ****p < 0.0001; NS, not statistically significant; RO, reoxygenation; TSG101, tumor susceptibility gene 101; IL, Interleukin; TNF-α, tumor necrosis factor-α; NTA, nanoparticle tracking analysis; PEG, polyethylene glycol; TEM, transmission electron microscopy; EVs, extracellular vesicles; iNOS, inducible nitric oxide synthase; UC, ultracentrifugation; OGD, oxygen-glucose deprivation; RT-qPCR, quantitative real-time PCR analysis.
Figure 2 Characterization of EVs from formerly hypoxic microglia and the impact of the increased concentration of such EVs on cortical microglia polarization upon induction of hypoxia. (A) In the schematic diagram, EVs were enriched from the conditioned medium of OGD-preconditioned microglia by the method of PEG precipitation combined with various centrifugation steps. (B) Western blot analysis of EVs against the exosomal representative markers such as Alix, CD9, Tsg101 and CD63. Western blots were conducted on total cell lysates and EV lysates (UC and PEG) from hypoxia-preconditioned microglia. (C) TEM analysis of vesicles derived from hypoxic microglia. (D) The size distribution patterns of EVs were assessed by NTA (n = 3). (E-F) RT-qPCR analysis assay of M2 microglia polarization marker IL-10 and CD206 mRNA in primary microglia in three groups: normoxia, 4 h of OGD followed by 24-h reoxygenation, and 4 h of OGD followed by 24-h reoxygenation with EV treatment (n = 4). (G-I) RT-qPCR assay of M1 microglia polarization marker TNF-α, iNOS, and IL-1β mRNA in primary microglia (n = 4). *p < 0.05; **p < 0.01; ***p < 0.001; ****p < 0.0001; NS, not statistically significant; RO, reoxygenation; TSG101, tumor susceptibility gene 101; IL, Interleukin; TNF-α, tumor necrosis factor-α; NTA, nanoparticle tracking analysis; PEG, polyethylene glycol; TEM, transmission electron microscopy; EVs, extracellular vesicles; iNOS, inducible nitric oxide synthase; UC, ultracentrifugation; OGD, oxygen-glucose deprivation; RT-qPCR, quantitative real-time PCR analysis.CC BY · PubMed Central
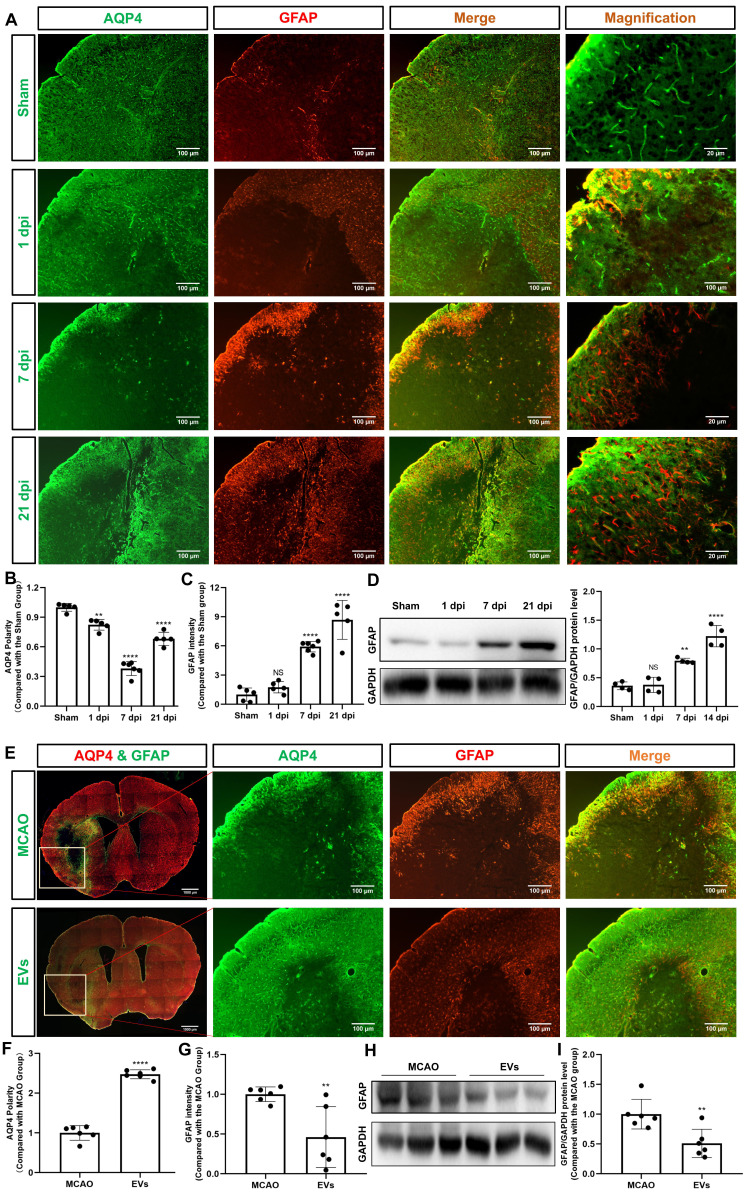
Figure 3 EVs from hypoxic microglia abrogate AQP4 depolarization and reactive astrogliosis in the periinfarct cortex. (A) Dynamic evolution of AQP4 polarity and GFAP fluorescence in the periinfarct cortex. (B-C) Statistical plots of AQP4 polarity and GFAP mean fluorescence intensity in the periinfarct cortex of different groups of mice (n = 5-6). The polarity of AQP4 decreased significantly at all time points compared with the sham group. The GFAP intensity was boosted on dpi7 and dpi21. (D) The dynamic GFAP protein expression in the ischemic cortex on dpi1, 7, and 21 was measured by western blot. Compared with the sham group, the protein expression of GFAP on dpi1 was not significantly increased, whereas the protein expression of GFAP on dpi7 and dpi21 were significantly increased (n = 4). (E) Schematic diagram of the cortex of interest along with representative immunofluorescence maps among the MCAO+PBS and EV treatment groups. The white boxes represent the region of interest. (F-G) Statistical analysis of the polarity of AQP4 and GFAP intensity. The EV treatment group was associated with a higher AQP4 polarity and a lower GFAP intensity in the ischemic cortex on dpi7 (n = 6). (H-I) The impact of EV treatment on GFAP protein level in the ischemic cortex on dpi7 was measured by western blot (n = 6). *p < 0.05; **p < 0.01; ****p < 0.0001; NS, not statistically significant; MCAO, middle cerebral artery occlusion; EVs, extracellular vesicles; AQP4, aquaporin 4; dpi, day post-ischemia; GFAP, glial fibrillary acidic protein.
Figure 3 EVs from hypoxic microglia abrogate AQP4 depolarization and reactive astrogliosis in the periinfarct cortex. (A) Dynamic evolution of AQP4 polarity and GFAP fluorescence in the periinfarct cortex. (B-C) Statistical plots of AQP4 polarity and GFAP mean fluorescence intensity in the periinfarct cortex of different groups of mice (n = 5-6). The polarity of AQP4 decreased significantly at all time points compared with the sham group. The GFAP intensity was boosted on dpi7 and dpi21. (D) The dynamic GFAP protein expression in the ischemic cortex on dpi1, 7, and 21 was measured by western blot. Compared with the sham group, the protein expression of GFAP on dpi1 was not significantly increased, whereas the protein expression of GFAP on dpi7 and dpi21 were significantly increased (n = 4). (E) Schematic diagram of the cortex of interest along with representative immunofluorescence maps among the MCAO+PBS and EV treatment groups. The white boxes represent the region of interest. (F-G) Statistical analysis of the polarity of AQP4 and GFAP intensity. The EV treatment group was associated with a higher AQP4 polarity and a lower GFAP intensity in the ischemic cortex on dpi7 (n = 6). (H-I) The impact of EV treatment on GFAP protein level in the ischemic cortex on dpi7 was measured by western blot (n = 6). *p < 0.05; **p < 0.01; ****p < 0.0001; NS, not statistically significant; MCAO, middle cerebral artery occlusion; EVs, extracellular vesicles; AQP4, aquaporin 4; dpi, day post-ischemia; GFAP, glial fibrillary acidic protein.CC BY · PubMed Central
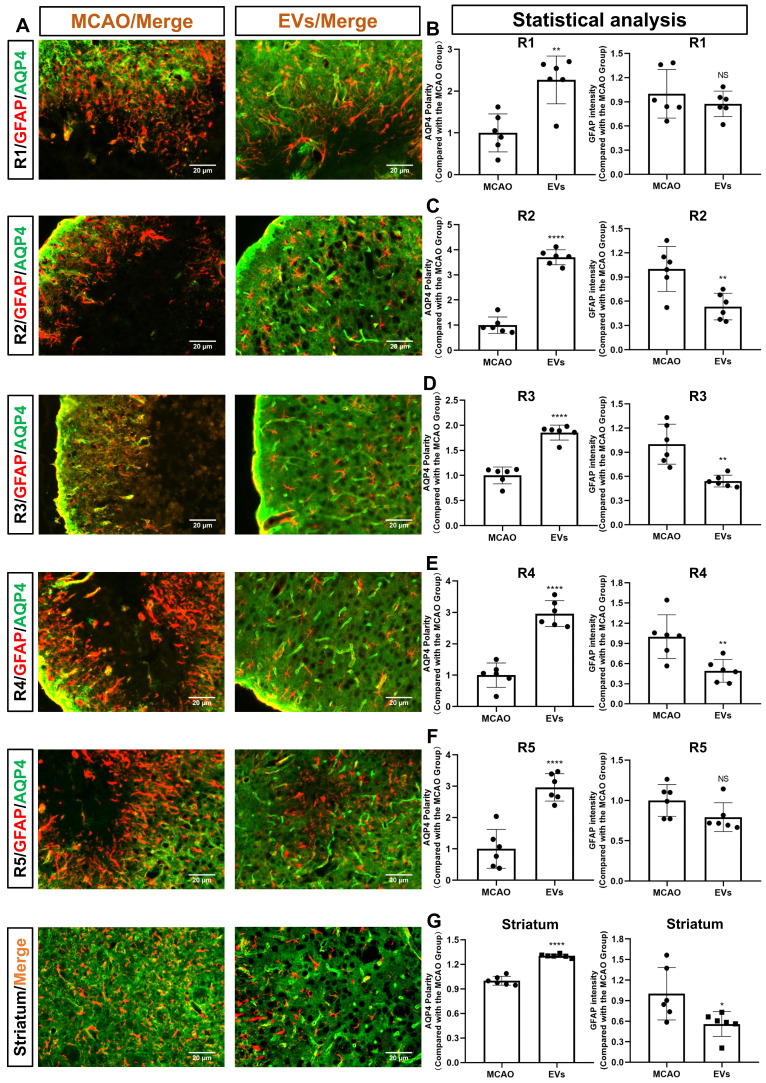
Figure 4 EVs derived from hypoxic microglia augment AQP4 polarity and attenuate astrogliosis in different regions of the periinfarct cortex and striatum. (A) Schematic diagram of the cortex and striatum at post-MCAO day 7 of interest along with representative immunofluorescence maps. (B-G) Statistical plots of the polarity of AQP4 and GFAP mean fluorescence intensity in the periinfarct region 1 (R1), R2, R3, R4, R5, and striatum (n = 6). The EV-treated mice exhibited a higher polarity of AQP4 in all periinfarct regions and striatum than those of the MCAO control mice. Likewise, the EV-treated mice were associated with a lower GFAP mean fluorescence intensity in the peri-infarct R2, R3, R4, and striatum. *p < 0.05; **p < 0.01; ****p < 0.0001; NS, not statistically significant; MCAO, middle cerebral artery occlusion; EVs, extracellular vesicles; AQP4, aquaporin 4.
Figure 4 EVs derived from hypoxic microglia augment AQP4 polarity and attenuate astrogliosis in different regions of the periinfarct cortex and striatum. (A) Schematic diagram of the cortex and striatum at post-MCAO day 7 of interest along with representative immunofluorescence maps. (B-G) Statistical plots of the polarity of AQP4 and GFAP mean fluorescence intensity in the periinfarct region 1 (R1), R2, R3, R4, R5, and striatum (n = 6). The EV-treated mice exhibited a higher polarity of AQP4 in all periinfarct regions and striatum than those of the MCAO control mice. Likewise, the EV-treated mice were associated with a lower GFAP mean fluorescence intensity in the peri-infarct R2, R3, R4, and striatum. *p < 0.05; **p < 0.01; ****p < 0.0001; NS, not statistically significant; MCAO, middle cerebral artery occlusion; EVs, extracellular vesicles; AQP4, aquaporin 4.CC BY · PubMed Central
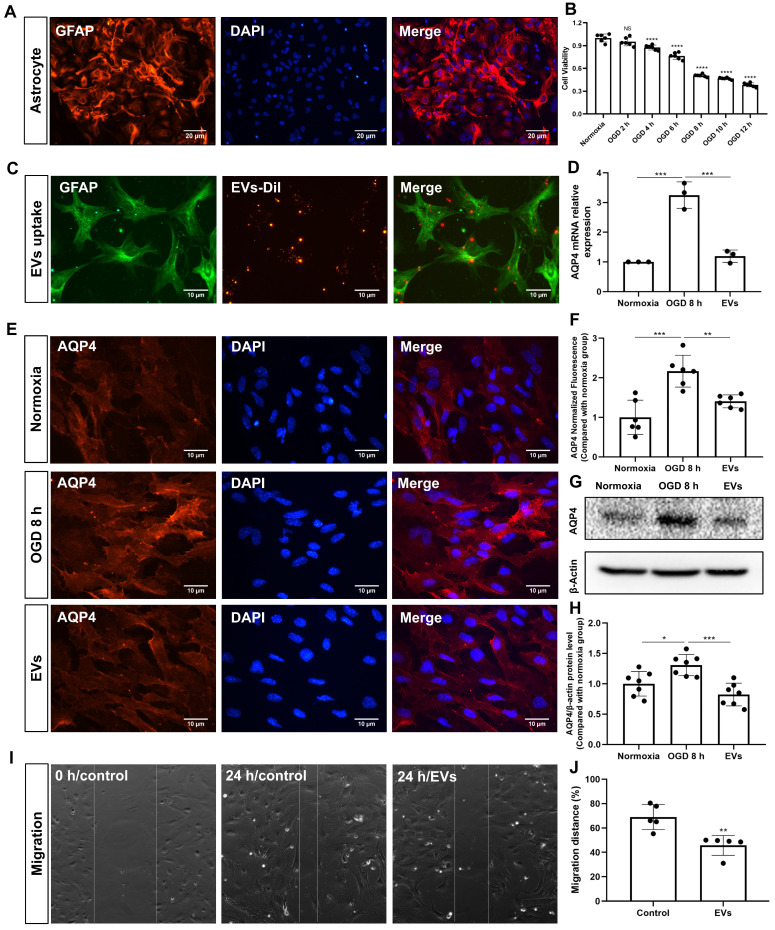
Figure 5 EV treatment reduces the clustering of AQP4 in the astrocyte plasma membrane exposed to hypoxia. (A) Identification of primary cortical astrocytes. Cell cultures were immunoassayed for GFAP (red) and counterstained with DAPI (blue). (B) MTT (Thiazolyl Blue Tetrazolium Bromide) was used to assess the astrocyte viability exposed to 2, 4, 6, 8 10, and 12 h of OGD followed by 24-h reoxygenation. Cells incubated under standard cell culture conditions ('Normoxia') were defined as 100 % cell survival (n = 6). (C) EVs labeled with DiI (red) were taken up into the cytoplasm of GFAP+ (green) astrocytes. (D) RT-qPCR assay of the impact of EV treatment of AQP4 gene expression in primary astrocytes exposed to 8 h of OGD followed by 24 h of reoxygenation (n = 3). (E-F) Immunocytochemistry with the antibody specific for AQP4 confirmed AQP4 protein clustering in the plasma membrane under different treatment conditions (n = 6). (G-H) Western blot analysis showing the AQP4 protein in primary astrocytes after OGD in untreated cells or cells treated with EVs (n = 7). (I-J) EVs decreased the capability of migration of astrocytes in the scratch wound model (24 h, n = 5). *p < 0.05; **p < 0.01; ***p < 0.001; ****p < 0.0001; NS, not statistically significant; OGD, oxygen-glucose deprivation; EVs, extracellular vesicles; AQP4, aquaporin 4; RT-qPCR, quantitative real-time PCR analysis.
Figure 5 EV treatment reduces the clustering of AQP4 in the astrocyte plasma membrane exposed to hypoxia. (A) Identification of primary cortical astrocytes. Cell cultures were immunoassayed for GFAP (red) and counterstained with DAPI (blue). (B) MTT (Thiazolyl Blue Tetrazolium Bromide) was used to assess the astrocyte viability exposed to 2, 4, 6, 8 10, and 12 h of OGD followed by 24-h reoxygenation. Cells incubated under standard cell culture conditions ('Normoxia') were defined as 100 % cell survival (n = 6). (C) EVs labeled with DiI (red) were taken up into the cytoplasm of GFAP+ (green) astrocytes. (D) RT-qPCR assay of the impact of EV treatment of AQP4 gene expression in primary astrocytes exposed to 8 h of OGD followed by 24 h of reoxygenation (n = 3). (E-F) Immunocytochemistry with the antibody specific for AQP4 confirmed AQP4 protein clustering in the plasma membrane under different treatment conditions (n = 6). (G-H) Western blot analysis showing the AQP4 protein in primary astrocytes after OGD in untreated cells or cells treated with EVs (n = 7). (I-J) EVs decreased the capability of migration of astrocytes in the scratch wound model (24 h, n = 5). *p < 0.05; **p < 0.01; ***p < 0.001; ****p < 0.0001; NS, not statistically significant; OGD, oxygen-glucose deprivation; EVs, extracellular vesicles; AQP4, aquaporin 4; RT-qPCR, quantitative real-time PCR analysis.CC BY · PubMed Central
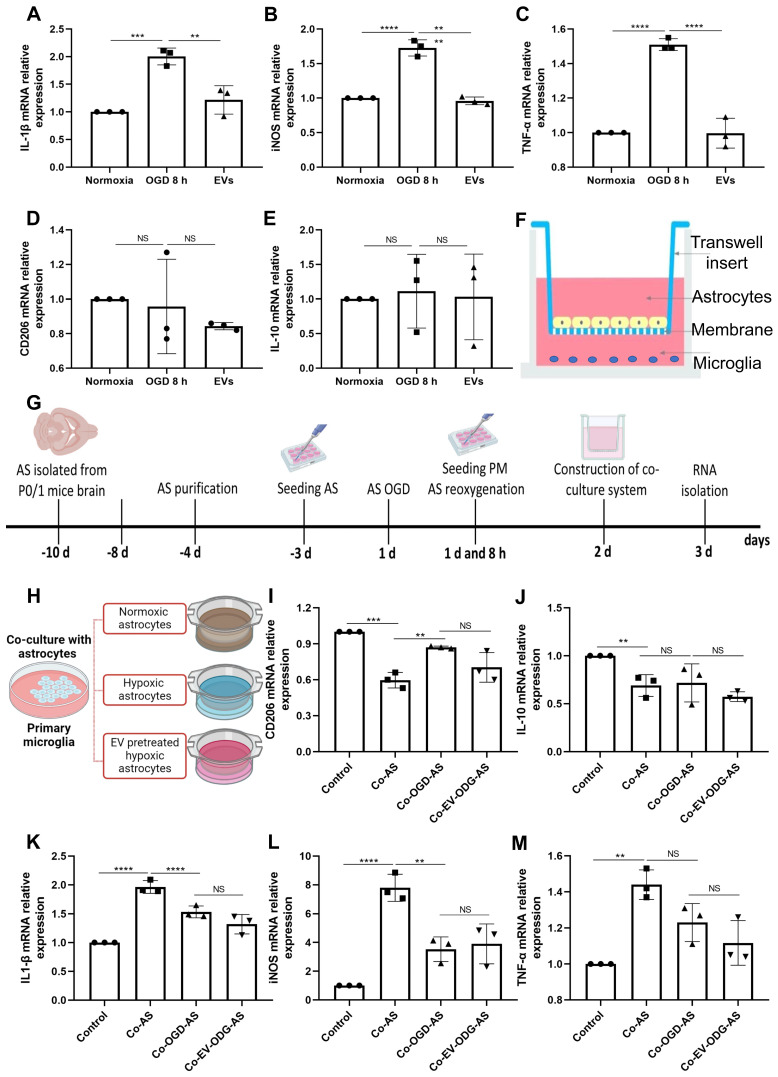
Figure 6 EVs derived from hypoxic microglia shift inflammation in primary astrocytes exposed to hypoxia. (A-E) RT-qPCR assay of IL-1β, iNOS, TNF-α, IL-10, and CD206 mRNA levels in primary astrocytes in the three groups: normoxic astrocytes and 8 h of OGD followed by 24-h reoxygenation in untreated astrocytes or astrocytes treated with EVs (n = 3). (F) The construction of the co-culture system of astrocyte-microglia communication. Astrocytes and microglia were respectively seeded on the upper and lower compartment. (G) Experimental paradigm summarizing the in vitro communication co-culture model. (H) Microglia were exposed to co-culture with astrocytes under three statuses: normoxia, 8 h of OGD followed by 24-h reoxygenation, and 8 h of OGD followed by 24-h reoxygenation with EV treatment. (I-M) An alteration of AQP4 level in modulating astrocyte-to-microglia communication in terms of neuroinflammation. Secreted anti-inflammatory cytokines (CD206 and IL-10 mRNA) and pro-inflammatory cytokines (IL-1β, iNOS, and TNF-α mRNA) in primary microglia were measured using RT-qPCR (n = 3). *p < 0.05; **p < 0.01; ***p < 0.001; ****p < 0.0001; NS, not statistically significant; OGD, oxygen-glucose deprivation; EVs, extracellular vesicles; AQP4, Aquaporin 4; PM, primary microglia; AS; astrocytes; RT-qPCR, quantitative real-time PCR analysis; IL, Interleukin; TNF-α, tumor necrosis factor-α; iNOS, inducible nitric oxide synthase.
Figure 6 EVs derived from hypoxic microglia shift inflammation in primary astrocytes exposed to hypoxia. (A-E) RT-qPCR assay of IL-1β, iNOS, TNF-α, IL-10, and CD206 mRNA levels in primary astrocytes in the three groups: normoxic astrocytes and 8 h of OGD followed by 24-h reoxygenation in untreated astrocytes or astrocytes treated with EVs (n = 3). (F) The construction of the co-culture system of astrocyte-microglia communication. Astrocytes and microglia were respectively seeded on the upper and lower compartment. (G) Experimental paradigm summarizing the in vitro communication co-culture model. (H) Microglia were exposed to co-culture with astrocytes under three statuses: normoxia, 8 h of OGD followed by 24-h reoxygenation, and 8 h of OGD followed by 24-h reoxygenation with EV treatment. (I-M) An alteration of AQP4 level in modulating astrocyte-to-microglia communication in terms of neuroinflammation. Secreted anti-inflammatory cytokines (CD206 and IL-10 mRNA) and pro-inflammatory cytokines (IL-1β, iNOS, and TNF-α mRNA) in primary microglia were measured using RT-qPCR (n = 3). *p < 0.05; **p < 0.01; ***p < 0.001; ****p < 0.0001; NS, not statistically significant; OGD, oxygen-glucose deprivation; EVs, extracellular vesicles; AQP4, Aquaporin 4; PM, primary microglia; AS; astrocytes; RT-qPCR, quantitative real-time PCR analysis; IL, Interleukin; TNF-α, tumor necrosis factor-α; iNOS, inducible nitric oxide synthase.CC BY · PubMed Central
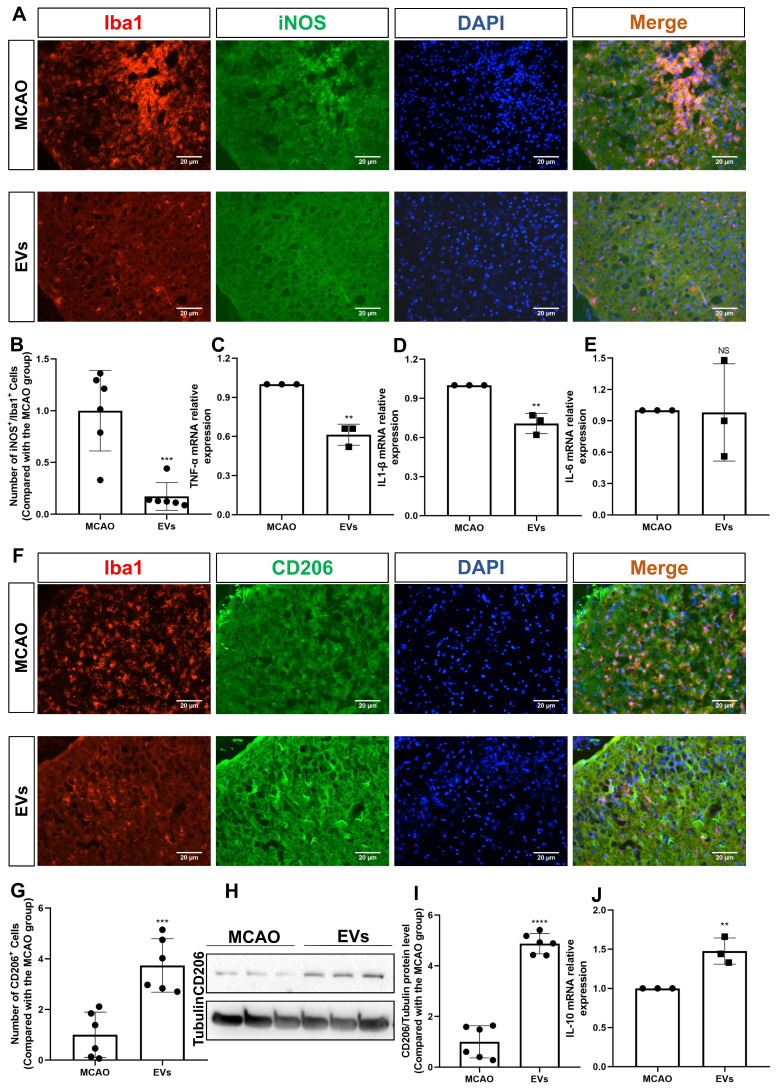
Figure 7 EV administration diminishes neuroinflammation in the periinfarct cortex. (A-B) On day 7 after stroke, the periinfarct cortex was co-stained for iNOS and Iba1 and quantification of the number of iNOS+/Iba1+ cells (M1 polarization of microglia cells) was carried by immunofluorescence staining in the untreated MCAO mice and MCAO mice treated with EVs (n = 6). (C-E) RT-qPCR assay of proinflammatory cytokines TNF-α, IL-1β, and IL-6 mRNA levels in the ischemic brain at post-MCAO day 7. In contrast to the untreated group, the TNF-α and IL-1β mRNA levels were reduced in the postischemic brain from EV-treated mice (n = 3). (F-G) Quantitative analysis of M2 polarization of microglia cells (CD206, green) in the ischemic cortex at post-MCAO day 7 by immunofluorescence staining (n = 6). (H-I) The CD206 protein level in the ischemic brain. EV infusion boosts M2 polarization rates of microglial cells in the ischemic brain at post-MCAO day 7 compared with the untreated group (n = 6). (J) RT-qPCR assay of anti-inflammatory cytokines IL-10 mRNA level in the ischemic brain at post-MCAO day 7. In contrast to the untreated group, the IL-10 mRNA level increased in the postischemic brain from EV treatment mice (n = 3). **p < 0.01; ***p < 0.001; ****p < 0.0001; NS, not statistically significant; EVs, extracellular vesicles; MCAO, middle cerebral artery occlusion; IL, Interleukin; TNF-α, tumor necrosis factor-α; RT-qPCR, quantitative real-time PCR analysis.
Figure 7 EV administration diminishes neuroinflammation in the periinfarct cortex. (A-B) On day 7 after stroke, the periinfarct cortex was co-stained for iNOS and Iba1 and quantification of the number of iNOS+/Iba1+ cells (M1 polarization of microglia cells) was carried by immunofluorescence staining in the untreated MCAO mice and MCAO mice treated with EVs (n = 6). (C-E) RT-qPCR assay of proinflammatory cytokines TNF-α, IL-1β, and IL-6 mRNA levels in the ischemic brain at post-MCAO day 7. In contrast to the untreated group, the TNF-α and IL-1β mRNA levels were reduced in the postischemic brain from EV-treated mice (n = 3). (F-G) Quantitative analysis of M2 polarization of microglia cells (CD206, green) in the ischemic cortex at post-MCAO day 7 by immunofluorescence staining (n = 6). (H-I) The CD206 protein level in the ischemic brain. EV infusion boosts M2 polarization rates of microglial cells in the ischemic brain at post-MCAO day 7 compared with the untreated group (n = 6). (J) RT-qPCR assay of anti-inflammatory cytokines IL-10 mRNA level in the ischemic brain at post-MCAO day 7. In contrast to the untreated group, the IL-10 mRNA level increased in the postischemic brain from EV treatment mice (n = 3). **p < 0.01; ***p < 0.001; ****p < 0.0001; NS, not statistically significant; EVs, extracellular vesicles; MCAO, middle cerebral artery occlusion; IL, Interleukin; TNF-α, tumor necrosis factor-α; RT-qPCR, quantitative real-time PCR analysis.CC BY · PubMed Central
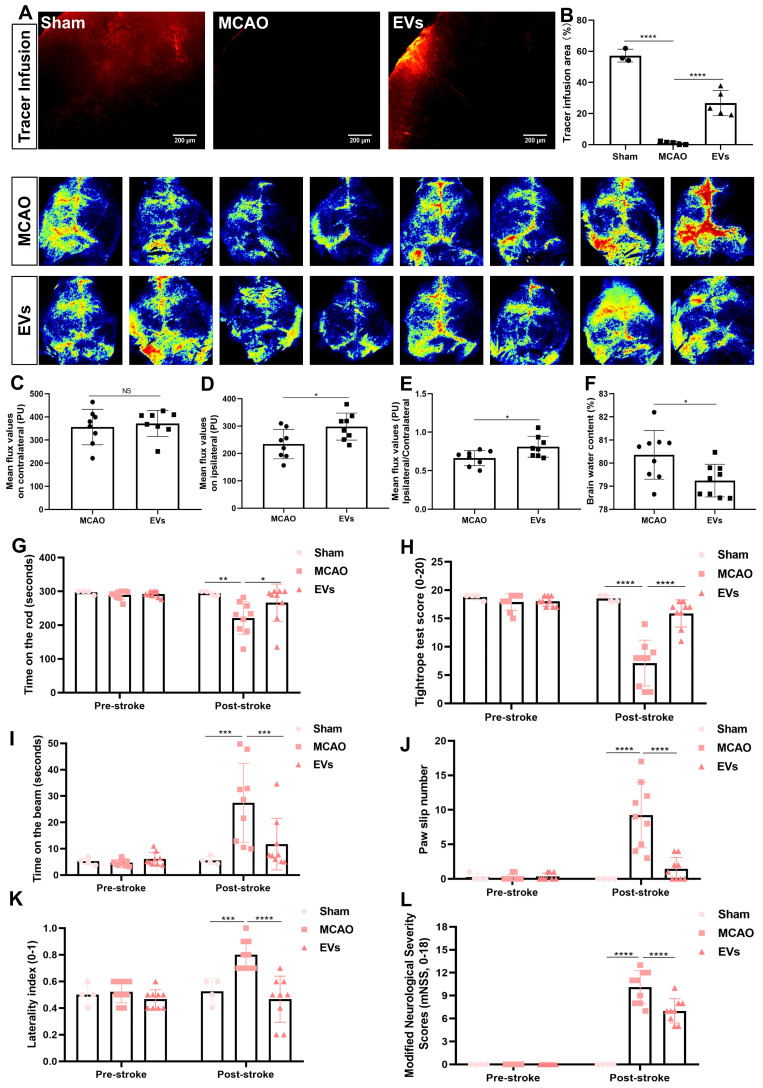
Figure 8 EV administration protects against ischemia-induced brain damage in mice. (A-B) To evaluate perivascular CSF penetration into the brain parenchyma, 10 μL of fluorescent CSF tracer were injected intracisternally into sham, MCAO + PBS, and MCAO + EVs mice. Thirty min after injection, the periinfarct fluorescence was measured. Representative images indicate that compared to sham brains, CSF tracer penetration into MCAO brains was markedly slowed. However, CSF tracer penetration was dramatically increased in MCAO + EVs mice compared to MCAO + PBS mice (n = 3-5). (C-E) Statistical analysis of laser speckle perfusion results in mice. Cerebral perfusion in the contralateral cortex is comparable among the untreated MCAO mice and MCAO mice treated with EVs on day 7 after stroke. The EV-treated mice were associated with a higher ipsilateral cortex blood flow and value of ipsilateral ratio to contralateral cortex blood flow (n = 8). (F) Statistical results of mouse brain water content between the untreated MCAO mice and MCAO mice treated with EVs (n = 9). (G-L) EV delivery protects against ischemia-induced motor coordination impairment. The rotarod test, the tightrope test, the balance beam test, the paw slips recording, the corner turn test, and the modified neurological severity scores were tested on day 1 before the stroke and day 7 after the stroke (n = 4-9). *p < 0.05; **p < 0.01; ***p < 0.001; ****p < 0.0001; NS, not statistically significant; EVs, extracellular vesicles; MCAO, middle cerebral artery occlusion.
Figure 8 EV administration protects against ischemia-induced brain damage in mice. (A-B) To evaluate perivascular CSF penetration into the brain parenchyma, 10 μL of fluorescent CSF tracer were injected intracisternally into sham, MCAO + PBS, and MCAO + EVs mice. Thirty min after injection, the periinfarct fluorescence was measured. Representative images indicate that compared to sham brains, CSF tracer penetration into MCAO brains was markedly slowed. However, CSF tracer penetration was dramatically increased in MCAO + EVs mice compared to MCAO + PBS mice (n = 3-5). (C-E) Statistical analysis of laser speckle perfusion results in mice. Cerebral perfusion in the contralateral cortex is comparable among the untreated MCAO mice and MCAO mice treated with EVs on day 7 after stroke. The EV-treated mice were associated with a higher ipsilateral cortex blood flow and value of ipsilateral ratio to contralateral cortex blood flow (n = 8). (F) Statistical results of mouse brain water content between the untreated MCAO mice and MCAO mice treated with EVs (n = 9). (G-L) EV delivery protects against ischemia-induced motor coordination impairment. The rotarod test, the tightrope test, the balance beam test, the paw slips recording, the corner turn test, and the modified neurological severity scores were tested on day 1 before the stroke and day 7 after the stroke (n = 4-9). *p < 0.05; **p < 0.01; ***p < 0.001; ****p < 0.0001; NS, not statistically significant; EVs, extracellular vesicles; MCAO, middle cerebral artery occlusion.CC BY · PubMed Central

Verification

Claims the paper makes

The claims and statistics of this paper haven’t been checked yet.

Run the check — free, no account needed. It reads the open-access text and checks the sources it cites.

A few free checks a day · papers already verified open instantly · results are public

Claims other papers make about this one

Each is checked against this paper’s own text: does it say what the citing paper says it does?

Self-check

Percentages, sums and reported differences re-computed from the paper’s own numbers.

The self-check needs the paper’s full text.

Citations

Cites

Show all 6 references

Research works printed but not linked: 68

  1. [1]Fischer R Wajant H Kontermann R Pfizenmaier K Maier O Astrocyte-specific activation of TNFR2 promotes oligodendrocyte maturation by secretion of leukemia inhibitory factor Glia 2014 62 2 272 83 24310780
  2. [2]Stoll G Jander S Schroeter M Inflammation and glial responses in ischemic brain lesions Prog Neurobiol 1998 56 2 149 71 9760699
  3. [3]Nayak AR Kashyap RS Kabra D Purohit HJ Taori GM Daginawala HF Time course of inflammatory cytokines in acute ischemic stroke patients and their relation to inter-alfa trypsin inhibitor heavy chain 4 and outcome Ann Indian Acad Neurol 2012 15 3 181 5 22919189 PMC3424794
  4. [4]Koyama Y Signaling molecules regulating phenotypic conversions of astrocytes and glial scar formation in damaged nerve tissues Neurochem Int 2014 78 35 42 25180676
  5. [5]Huang L Wu ZB Zhuge Q Zheng W Shao B Wang B Glial scar formation occurs in the human brain after ischemic stroke Int J Med Sci 2014 11 4 344 8 24578611 PMC3936028
  6. [6]Choudhury GR Ding S Reactive astrocytes and therapeutic potential in focal ischemic stroke Neurobiol Dis 2016 85 234 44 25982835 PMC4644522
  7. [7]Badaut J Fukuda AM Jullienne A Petry KG Aquaporin and brain diseases Biochim Biophys Acta 2014 1840 5 1554 65 24513456 PMC3960327
  8. [8]Ren Z Iliff JJ Yang L Yang J Chen X Chen MJ 'Hit & Run' model of closed-skull traumatic brain injury (TBI) reveals complex patterns of post-traumatic AQP4 dysregulation J Cereb Blood Flow Metab 2013 33 6 834 45 23443171 PMC3677112
  9. [9]Mogoanta L Ciurea M Pirici I Margaritescu C Simionescu C Ion DA Different dynamics of aquaporin 4 and glutamate transporter-1 distribution in the perineuronal and perivascular compartments during ischemic stroke Brain Pathol 2014 24 5 475 93 24571080 PMC8028976
  10. [10]Filchenko I Blochet C Buscemi L Price M Badaut J Hirt L Caveolin-1 Regulates Perivascular Aquaporin-4 Expression After Cerebral Ischemia Front Cell Dev Biol 2020 8 371 32523952 PMC7261922
  11. [11]Ji C Yu X Xu W Lenahan C Tu S Shao A The role of glymphatic system in the cerebral edema formation after ischemic stroke Exp Neurol 2021 340 113685 33676917
  12. [12]Sun C Lin L Yin L Hao X Tian J Zhang X Acutely Inhibiting AQP4 With TGN-020 Improves Functional Outcome by Attenuating Edema and Peri-Infarct Astrogliosis After Cerebral Ischemia Front Immunol 2022 13 870029 35592320 PMC9110854
  13. [13]Yi T Gao P Hou M Lv H Huang M Gao S The mechanisms underlying the actions of Xuefu Zhuyu decoction pretreatment against neurological deficits after ischemic stroke in mice: The mediation of glymphatic function by aquaporin-4 and its anchoring proteins Front Pharmacol 2022 13 1053253 36582539 PMC9792381
  14. [14]Zhu DD Yang G Huang YL Zhang T Sui AR Li N AQP4-A25Q Point Mutation in Mice Depolymerizes Orthogonal Arrays of Particles and Decreases Polarized Expression of AQP4 Protein in Astrocytic Endfeet at the Blood-Brain Barrier J Neurosci 2022 42 43 8169 83 36100398 PMC9637001
  15. [15]Hermann DM Xin W Bähr M Giebel B Doeppner TR Emerging roles of extracellular vesicle-associated non-coding RNAs in hypoxia: Insights from cancer, myocardial infarction and ischemic stroke Theranostics 2022 12 13 5776 802 35966580 PMC9373807
  16. [16]Lan X Han X Li Q Yang QW Wang J Modulators of microglial activation and polarization after intracerebral haemorrhage Nat Rev Neurol 2017 13 7 420 33 28524175 PMC5575938
  17. [17]Xiong XY Liu L Yang QW Functions and mechanisms of microglia/macrophages in neuroinflammation and neurogenesis after stroke Prog Neurobiol 2016 142 23 44 27166859
  18. [19]Liu Y Li Y-P Xiao L-M Chen L-K Zheng S-Y Zeng E-M Extracellular vesicles derived from M2 microglia reduce ischemic brain injury through microRNA-135a-5p/TXNIP/NLRP3 axis Lab Invest 2021 101 7 837 50 33875790
  19. [20]Tian Y Zhu P Liu S Jin Z Li D Zhao H IL-4-polarized BV2 microglia cells promote angiogenesis by secreting exosomes Adv Clin Exp Med 2019 28 4 421 30 30684318
  20. [21]Zhang D Cai G Liu K Zhuang Z Jia K Pei S Microglia exosomal miRNA-137 attenuates ischemic brain injury through targeting Notch1 Aging (Albany NY) 2021 13 3 4079 33461167 PMC7906161
  21. [22]Zhang L Wei W Ai X Kilic E Hermann DM Venkataramani V Extracellular vesicles from hypoxia-preconditioned microglia promote angiogenesis and repress apoptosis in stroke mice via the TGF-β/Smad2/3 pathway Cell Death Dis 2021 12 11 1068 34753919 PMC8578653
  22. [23]Lian H Roy E Zheng H Protocol for primary microglial culture preparation Bio-protocol 2016 6 21 e1989 e 29104890 PMC5669279
  23. [25]Kuang Y Zheng X Zhang L Ai X Venkataramani V Kilic E Adipose-derived mesenchymal stem cells reduce autophagy in stroke mice by extracellular vesicle transfer of miR-25 J Extracell Vesicles 2020 10 1 e12024 33304476 PMC7710129
  24. [26]Hung CC Lin CH Chang H Wang CY Lin SH Hsu PC Astrocytic GAP43 Induced by the TLR4/NF-κB/STAT3 Axis Attenuates Astrogliosis-Mediated Microglial Activation and Neurotoxicity J Neurosci 2016 36 6 2027 43 26865625 PMC6602016
  25. [27]Zhang F Zhang JG Yang W Xu P Xiao YL Zhang HT 6-Gingerol attenuates LPS-induced neuroinflammation and cognitive impairment partially via suppressing astrocyte overactivation Biomed Pharmacother 2018 107 1523 9 30257370
  26. [28]Lin A Liu J Gong P Chen Y Zhang H Zhang Y Serum amyloid A inhibits astrocyte migration via activating p38 MAPK J Neuroinflammation 2020 17 1 254 32861245 PMC7456509
  27. [30]Iliff JJ Chen MJ Plog BA Zeppenfeld DM Soltero M Yang L Impairment of glymphatic pathway function promotes tau pathology after traumatic brain injury J Neurosci 2014 34 49 16180 93 25471560 PMC4252540
  28. [31]Su Y Fan W Ma Z Wen X Wang W Wu Q Taurine improves functional and histological outcomes and reduces inflammation in traumatic brain injury Neuroscience 2014 266 56 65 24530657
  29. [32]Gao C Qian Y Huang J Wang D Su W Wang P A three-day consecutive fingolimod administration improves neurological functions and modulates multiple immune responses of CCI mice Mol Neurobiol 2017 54 10 8348 60 27924525
  30. [33]Balkaya M Kröber JM Rex A Endres M Assessing post-stroke behavior in mouse models of focal ischemia J Cereb Blood Flow Metab 2013 33 3 330 8 23232947 PMC3587814
  31. [34]Carter RJ Lione LA Humby T Mangiarini L Mahal A Bates GP Characterization of progressive motor deficits in mice transgenic for the human Huntington's disease mutation J Neurosci 1999 19 8 3248 57 10191337 PMC6782264
  32. [35]Théry C Witwer KW Aikawa E Alcaraz MJ Anderson JD Andriantsitohaina R Minimal information for studies of extracellular vesicles 2018 (MISEV2018): a position statement of the International Society for Extracellular Vesicles and update of the MISEV2014 guidelines J Extracell Vesicles 2018 7 1 1535750 30637094 PMC6322352
  33. [36]Hou C Li J Wang B Liu Q Zhao Y Zhang H Dynamic Evolution of the Glymphatic System at the Early Stages of Subarachnoid Hemorrhage Front Neurol 2022 13 924080 35847203 PMC9283644
  34. [37]Benfenati V Nicchia GP Svelto M Rapisarda C Frigeri A Ferroni S Functional down-regulation of volume-regulated anion channels in AQP4 knockdown cultured rat cortical astrocytes J Neurochem 2007 100 1 87 104 17064359
  35. [38]Clasadonte J Dong J Hines DJ Haydon PG Astrocyte control of synaptic NMDA receptors contributes to the progressive development of temporal lobe epilepsy Proc Natl Acad Sci U S A 2013 110 43 17540 5 24101472 PMC3808607
  36. [39]Manley GT Binder DK Papadopoulos MC Verkman AS New insights into water transport and edema in the central nervous system from phenotype analysis of aquaporin-4 null mice Neuroscience 2004 129 4 983 91 15561413
  37. [40]Clément T Rodriguez-Grande B Badaut J Aquaporins in brain edema J Neurosci Res 2020 98 1 9 18 30430614
  38. [41]Hou C Liu Q Zhang H Wang W Wang B Cui X Nimodipine Attenuates Early Brain Injury by Protecting the Glymphatic System After Subarachnoid Hemorrhage in Mice Neurochem Res 2022 47 3 701 12 34792752
  39. [42]Pekny M Pekna M Astrocyte reactivity and reactive astrogliosis: costs and benefits Physiol Rev 2014 94 4 1077 98 25287860
  40. [44]Cregg JM DePaul MA Filous AR Lang BT Tran A Silver J Functional regeneration beyond the glial scar Exp Neurol 2014 253 197 207 24424280 PMC3951813
  41. [45]Zhang R Wu Y Xie F Zhong Y Wang Y Xu M RGMa mediates reactive astrogliosis and glial scar formation through TGFβ1/Smad2/3 signaling after stroke Cell Death Differ 2018 25 8 1503 16 29396549 PMC6113216
  42. [46]Zhong K Wang RX Qian XD Yu P Zhu XY Zhang Q Neuroprotective effects of saffron on the late cerebral ischemia injury through inhibiting astrogliosis and glial scar formation in rats Biomed Pharmacother 2020 126 110041 32113053
  43. [47]Song Y Li Z He T Qu M Jiang L Li W M2 microglia-derived exosomes protect the mouse brain from ischemia-reperfusion injury via exosomal miR-124 Theranostics 2019 9 10 2910 23 31244932 PMC6568171
  44. [48]Gao M Lu W Shu Y Yang Z Sun S Xu J Poldip2 mediates blood-brain barrier disruption and cerebral edema by inducing AQP4 polarity loss in mouse bacterial meningitis model CNS Neurosci Ther 2020 26 12 1288 302 32790044 PMC7702237
  45. [51]Holter KE Kehlet B Devor A Sejnowski TJ Dale AM Omholt SW Interstitial solute transport in 3D reconstructed neuropil occurs by diffusion rather than bulk flow Proc Natl Acad Sci U S A 2017 114 37 9894 9 28847942 PMC5604020
  46. [52]Mestre H Hablitz LM Xavier AL Feng W Zou W Pu T Aquaporin-4-dependent glymphatic solute transport in the rodent brain Elife 2018 7 e40070 30561329 PMC6307855
  47. [53]Zeppenfeld DM Simon M Haswell JD D'Abreo D Murchison C Quinn JF Association of perivascular localization of aquaporin-4 with cognition and Alzheimer disease in aging brains JAMA Neurol 2017 74 1 91 9 27893874
  48. [54]Zhu A Lin Y Hu X Lin Z Lin Y Xie Q Treadmill exercise decreases cerebral edema in rats with local cerebral infarction by modulating AQP4 polar expression through the caveolin-1/TRPV4 signaling pathway Brain Res Bull 2022 188 155 68 35961528
  49. [55]Weber RZ Grönnert L Mulders G Maurer MA Tackenberg C Schwab ME Characterization of the Blood Brain Barrier Disruption in the Photothrombotic Stroke Model Front Physiol 2020 11 586226 33262704 PMC7688466
  50. [56]Liu H Qiu G Zhuo F Yu W Sun S Li F Lost Polarization of Aquaporin4 and Dystroglycan in the Core Lesion after Traumatic Brain Injury Suggests Functional Divergence in Evolution Biomed Res Int 2015 2015 471631 26583111 PMC4637040
  51. [57]He XF Li G Li LL Li MY Liang FY Chen X Overexpression of Slit2 decreases neuronal excitotoxicity, accelerates glymphatic clearance, and improves cognition in a multiple microinfarcts model Mol Brain 2020 13 1 135 33028376 PMC7542754
  52. [58]Smith AJ Duan T Verkman AS Aquaporin-4 reduces neuropathology in a mouse model of Alzheimer's disease by remodeling peri-plaque astrocyte structure Acta Neuropathol Commun 2019 7 1 74 31068220 PMC6506955
  53. [59]Liddelow SA Barres BA Reactive Astrocytes: Production, Function, and Therapeutic Potential Immunity 2017 46 6 957 67 28636962
  54. [60]Dai W Yan J Chen G Hu G Zhou X Zeng X AQP4-knockout alleviates the lipopolysaccharide-induced inflammatory response in astrocytes via SPHK1/MAPK/AKT signaling Int J Mol Med 2018 42 3 1716 22 29956748
  55. [61]Sun H Liang R Yang B Zhou Y Liu M Fang F Aquaporin-4 mediates communication between astrocyte and microglia: Implications of neuroinflammation in experimental Parkinson's disease Neuroscience 2016 317 65 75 26774050
  56. [62]Manley GT Fujimura M Ma T Noshita N Filiz F Bollen AW Aquaporin-4 deletion in mice reduces brain edema after acute water intoxication and ischemic stroke Nat Med 2000 6 2 159 63 10655103
  57. [63]Xin WQ Wei W Pan YL Cui BL Yang XY Bähr M Modulating poststroke inflammatory mechanisms: Novel aspects of mesenchymal stem cells, extracellular vesicles and microglia World J Stem Cells 2021 13 8 1030 48 34567423 PMC8422926
  58. [64]Han B Jiang W Cui P Zheng K Dang C Wang J Microglial PGC-1α protects against ischemic brain injury by suppressing neuroinflammation Genome Med 2021 13 1 47 33771213 PMC8004413
  59. [65]Boland B Yu WH Corti O Mollereau B Henriques A Bezard E Promoting the clearance of neurotoxic proteins in neurodegenerative disorders of ageing Nat Rev Drug Discov 2018 17 9 660 88 30116051 PMC6456907
  60. [66]Mader S Brimberg L Aquaporin-4 Water Channel in the Brain and Its Implication for Health and Disease Cells 2019 8(2) PMC6406241 30691235
  61. [67]Mogensen FL Delle C Nedergaard M The Glymphatic System (En)during Inflammation Int J Mol Sci 2021 22(14) PMC8305763 34299111
  62. [68]Li Z Song Y He T Wen R Li Y Chen T M2 microglial small extracellular vesicles reduce glial scar formation via the miR-124/STAT3 pathway after ischemic stroke in mice Theranostics 2021 11 3 1232 33391532 PMC7738903
  63. [69]Wang W Huang XR Li AG Liu F Li J-H Truong LD Signaling mechanism of TGF-β1 in prevention of renal inflammation: role of Smad7 J Am Soc Nephrol 2005 16 5 1371 83 15788474
  64. [70]Kulkarni AB Ward JM Yaswen L Mackall CL Bauer SR Huh C-G Transforming growth factor-beta 1 null mice. An animal model for inflammatory disorders Am J Pathol 1995 146 1 264 7856732 PMC1870760
  65. [71]Yaswen L Kulkarni AB Fredrickson T Mittleman B Schiffman R Payne S Autoimmune manifestations in the transforming growth factor-beta 1 knockout mouse Blood 1996 87 4 1439 45 8608234
  66. [72]Islam A Choudhury ME Kigami Y Utsunomiya R Matsumoto S Watanabe H Sustained anti-inflammatory effects of TGF-β1 on microglia/macrophages Biochim Biophys Acta, Mol Basis Dis 2018 1864 3 721 34 29269050
  67. [73]Liu X Zhang M Liu H Zhu R He H Zhou Y Bone marrow mesenchymal stem cell-derived exosomes attenuate cerebral ischemia-reperfusion injury-induced neuroinflammation and pyroptosis by modulating microglia M1/M2 phenotypes Exp Neurol 2021 341 113700 33741350
  68. [74]Gregorius J Wang C Stambouli O Hussner T Qi Y Tertel T Small extracellular vesicles obtained from hypoxic mesenchymal stromal cells have unique characteristics that promote cerebral angiogenesis, brain remodeling and neurological recovery after focal cerebral ischemia in mice Basic Res Cardiol 2021 116 1 40 34105014 PMC8187185

Cited by

Sorted by citations

Metadata

Authors
Xin, W., Pan, Y., Wei, W., Tatenhorst, L., Graf, I., Popa-Wagner, A., Gerner, S. T., Huber, S., Kilic, E., Hermann, D. M., Bähr, M., Huttner, H. B., & Doeppner, T. R.
Venue
Theranostics
Published
2023
Volume
13
Issue
12
Pages
4197-4216
ISSN
1838-7640
Cited by
77
References
6
Language
en

About these checks

Registry, retraction, Cites and statistics results are computed, not judged, with one exception: a printed reference that no index lists is read once by a model before it counts as a citation error. Claims are extracted by a model and kept only when their quote appears verbatim in the text; each cited source is then checked, with a model’s help, for whether it says what the claim relies on. Those verdicts can be wrong — read the claim’s quote and the cited source before relying on one.

Statistics and arithmetic are recomputed, not judged.

Confidence bands are shown only for fields calibrated on our annotated test set. None is calibrated yet, so no band is shown.

What counts as a claim ›How we measure confidence ›How we check this ›

Are you an author, or do you see a problem with this page? Request a review