Cited by 0Glycosylation and Glycoproteins ResearchCellular transport and secretionViral Infectious Diseases and Gene Expression in Insects

The DOI matches its Crossref record; 3 of the 3 references it cites were found in a registry or an index.

Cell membrane glycan contents are biochemical factors that constitute a kinetic barrier to viral particle uptake in a protein-nonspecific manner

Open access

Published version of a preprint

Abstract

Various types of glycoproteins have been suggested to inhibit viral infection of cells via steric repulsion. However, it is difficult to evaluate such physical actions genetically, simply because they are nonspecific and can be caused by any molecule. Therefore, we investigated a method to compare this nonspecific action among cells with diverse membrane protein profiles. We found that a wide range of glycoproteins individually had a strong inhibitory effect on infection, while on the other hand, the total amount of glycans was negatively correlated with the infection level in each cell. Thus, the infection-inhibitory effect of glycoproteins was molecularly nonspecific but was additively enhanced according to the amount of glycans on the cell surface. In this correlation, glycans function as a fundamental factor. Further investigating the mechanism by which glycans function as a factor in infection control, we conclude that the repulsion between proteins created by branched glycans forms a kinetic energy barrier against packing the virus into the region of protein interstitial space. As a result, the formation of the adhesive interface between the virus and the cell membrane, which is necessary for infection, is inhibited. This study attempted to link the cell’s nonspecific physical properties with intracellular biochemicals. A similar approach may be applied to quantify other nonspecific biological phenomena.

Overview

The claims and statistics of this paper haven’t been checked yet.

Run the check — free, no account needed. It reads the open-access text and checks the sources it cites.

A few free checks a day · papers already verified open instantly · results are public

Integrity signals

Registry

Crossref · 10.7554/elife.101175

Cites

3 of 3 references verified0 citation errors · 0 not checkable

Statistics

Figures

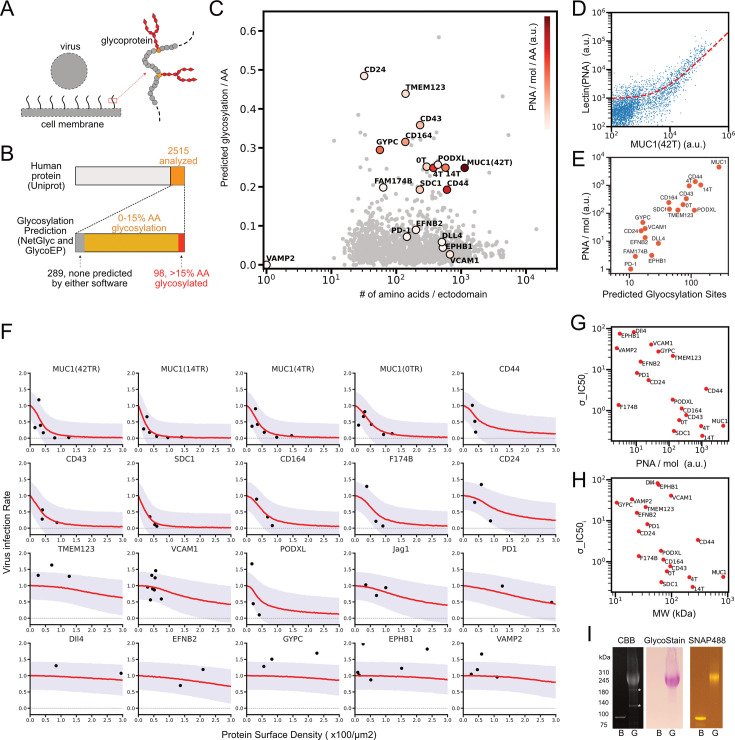
Figure 1. List of glycoproteins in the human genome: predictions and measurement of glycosylation, and virus infection inhibition assays using sample proteins from the list. (A) Schematic of inhibition of virus infection by membrane glycoproteins. (B) The number of membrane proteins and predicted glycosylated proteins in human genome from UniProt. (C) The number of predicted glycosylation sites per the number of amino acid sequence of ectodomain for 2515 membrane associated proteins, plotted along with the number of ectodomain amino acid sequence. Color indicates the measured rate for glycosylation per molecule (PNA/mol) per amino acid. 0T, 4T, and 14T indicate truncation mutants of MUC1 that contain 0, 4, and 14 tandem repeat sequences, respectively. (D) Flow cytogram for the binding of Alexa Fluor 647 labeled PNA to HEK293T cells expressing MUC1(42 tandem repeats) tagged with SNAP surface 488 and the linear regression of the data to the reaction model (red dashed line, see the method section for details). (E) Relations of the measured PNA/mol and the number of predicted glycosylation sites for the indicated molecules. (F) SARS-CoV2-PP infection assay in HEK293T cells expressing ACE2, TMPRSS2, and each of designated membrane protein. Dots were measured values of the integral of GFP expressions from infected viruses in those samples adjusted by the total ACE2 expressions at the time of infection and were plotted along with the mean density of membrane protein at the time of infection. Red lines indicate learned predicted infection rates mean from Bayesian hierarchical inference based on sigmoidal function, and purple area represents one sigma below and above the red lines. (G) Relations between the measured rate for glycosylation per molecule (PNA/mol) and molecular specific IC50 density in sigmoidal inhibitory function inferred from Bayesian hierarchical modeling in F (σ_IC50). (H) Relations between σ_IC50 and estimated molecular weight including glycans in the experimental system. (I) Purification and analysis of recombinant proteins, non-glycosylated (bacterial or B) and glycosylated (G) MUC1 (14TR) tagged with SNAP surface 488. Coomassie Brilliant Blue stained (left), glycan stained (middle), and fluorescent (right) for proteins in SDS-PAGE.
Figure 1. List of glycoproteins in the human genome: predictions and measurement of glycosylation, and virus infection inhibition assays using sample proteins from the list. (A) Schematic of inhibition of virus infection by membrane glycoproteins. (B) The number of membrane proteins and predicted glycosylated proteins in human genome from UniProt. (C) The number of predicted glycosylation sites per the number of amino acid sequence of ectodomain for 2515 membrane associated proteins, plotted along with the number of ectodomain amino acid sequence. Color indicates the measured rate for glycosylation per molecule (PNA/mol) per amino acid. 0T, 4T, and 14T indicate truncation mutants of MUC1 that contain 0, 4, and 14 tandem repeat sequences, respectively. (D) Flow cytogram for the binding of Alexa Fluor 647 labeled PNA to HEK293T cells expressing MUC1(42 tandem repeats) tagged with SNAP surface 488 and the linear regression of the data to the reaction model (red dashed line, see the method section for details). (E) Relations of the measured PNA/mol and the number of predicted glycosylation sites for the indicated molecules. (F) SARS-CoV2-PP infection assay in HEK293T cells expressing ACE2, TMPRSS2, and each of designated membrane protein. Dots were measured values of the integral of GFP expressions from infected viruses in those samples adjusted by the total ACE2 expressions at the time of infection and were plotted along with the mean density of membrane protein at the time of infection. Red lines indicate learned predicted infection rates mean from Bayesian hierarchical inference based on sigmoidal function, and purple area represents one sigma below and above the red lines. (G) Relations between the measured rate for glycosylation per molecule (PNA/mol) and molecular specific IC50 density in sigmoidal inhibitory function inferred from Bayesian hierarchical modeling in F (σ_IC50). (H) Relations between σ_IC50 and estimated molecular weight including glycans in the experimental system. (I) Purification and analysis of recombinant proteins, non-glycosylated (bacterial or B) and glycosylated (G) MUC1 (14TR) tagged with SNAP surface 488. Coomassie Brilliant Blue stained (left), glycan stained (middle), and fluorescent (right) for proteins in SDS-PAGE.CC BY · PubMed Central
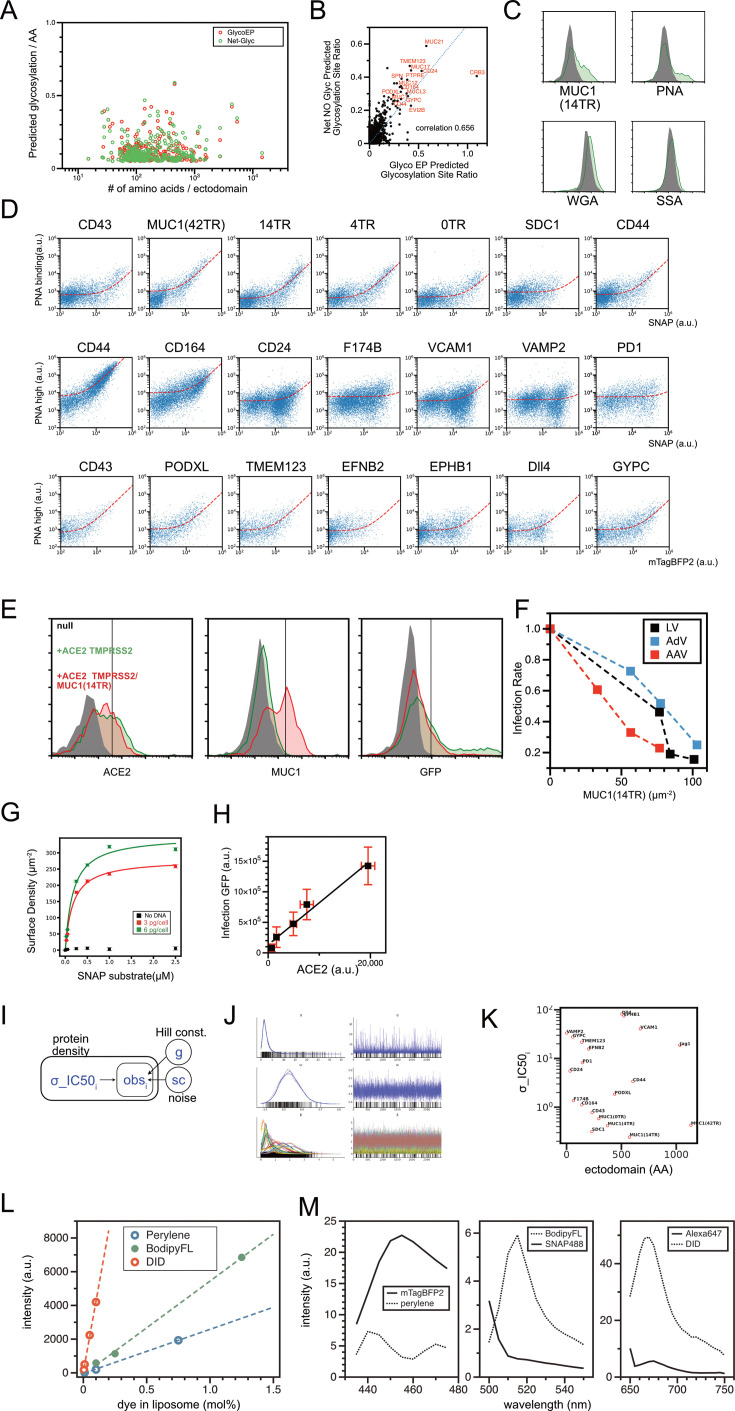
Figure 1—figure supplement 1. List of glycoproteins in the human genome: technical details for predictions and measurement of glycosylation, and virus infection inhibition assays using sample proteins from the list. (A) Glycosylation site prediction by Net O Glyc/Net N Glyc and GlycoEP. (B) Comparisons of the number of predicted glycosylation sites by both software packages. (C) Flow cytograms demonstrating the binding of three different fluorescent labeled lectins (PNA, WGA, SSA) to HEK 293T cells expressing MUC1(14TR) proteins. Protein expression probed by SNAP tag fluorescence (upper left), PNA binding (upper right), WGA binding (bottom left), and SSA binding (bottom right) was shown. (D) Two-dimensional flow cytograms of PNA binding assay to HEK 293T cells expressing various membrane proteins. Protein density was shown in either SNAP tag (SNAP surface 488) or mTagBFP2 fluorescence. Two different PNA concentrations were used to have wide enough dynamic range in PNA signals to resolve glycosylation in both low- and high-glycosylated proteins. PNA signals between low- and high- PNA concentrations and between SNAP tag and mTagBFP2 were adjusted with data of sample measured in both conditions (CD43, CD44). (E) Examples of flow cytograms in virus infection inhibition assays in HEK293T cells and SARS-CoV2-PP. Expressions of ACE2-mTagBFP2 (left) and SNAP-MUC1(14TR) (middle) were measured at the time of infection, and expression of GFP (right) was measured 2 days after the infection in the same batch of cells. Dark is null HEK293T cells without ACE2 and MUC1 expression. Green lines for HEK293T-ACE2 cells without MUC1 expression. Red lines for HEK293T-ACE2-MUC1 cells. (F) Infection inhibition assays for HEK293T cells and various other viruses (lentivirus, adenovirus, and adeno-associated virus). Mean GFP expression of infected cells is plotted along with mean MUC1 (14TR) densities in cells at the time of infection. These were measured by flow cytometry, in a similar manner as in the assay for SARS-CoV2-PP. (G) Measurement of surface densities of SNAP – Surface 488 labeled SNAP – MUC1 (14TR) proteins in HEK 293T cells, transfected with different amounts of plasmid DNAs. (H) Integrated amount of GFP expression in SARS-CoV2-PP infected HEK 293T cells compared with integrated amount of ACE2-mTagBFP2 expression at the time of infection. (I) Graphical model for Bayesian hierarchical sigmoidal regression of infection inhibition assay data. (J) Results of four repeated rounds of MCMC samplings by Numpyro for inferences for each parameter. (K) Relations between amino acid sequence for ectodomain of each protein and molecular specific IC50 density in sigmoidal inhibitory function inferred from Bayesian hierarchical modeling (σ_IC50). (L) Flow cytometry measurements for liposomes containing serially diluted dye-conjugated lipids and fluorescent membrane incorporating molecules (Bodipy-FL, peryelene, and DID) with indicated mol%. Linear fitting shown was used for calibration. (M) Fluorescence emission spectrum for equimolar molecules (50 µM for green and far-red channels, and 100 µM for blue channel), excited at 405 nm, 488 nm, and 638 nm, respectively. Membrane dyes were measured as incorporated in liposomes. Purified recombinant mTagBFP2 was used.
Figure 1—figure supplement 1. List of glycoproteins in the human genome: technical details for predictions and measurement of glycosylation, and virus infection inhibition assays using sample proteins from the list. (A) Glycosylation site prediction by Net O Glyc/Net N Glyc and GlycoEP. (B) Comparisons of the number of predicted glycosylation sites by both software packages. (C) Flow cytograms demonstrating the binding of three different fluorescent labeled lectins (PNA, WGA, SSA) to HEK 293T cells expressing MUC1(14TR) proteins. Protein expression probed by SNAP tag fluorescence (upper left), PNA binding (upper right), WGA binding (bottom left), and SSA binding (bottom right) was shown. (D) Two-dimensional flow cytograms of PNA binding assay to HEK 293T cells expressing various membrane proteins. Protein density was shown in either SNAP tag (SNAP surface 488) or mTagBFP2 fluorescence. Two different PNA concentrations were used to have wide enough dynamic range in PNA signals to resolve glycosylation in both low- and high-glycosylated proteins. PNA signals between low- and high- PNA concentrations and between SNAP tag and mTagBFP2 were adjusted with data of sample measured in both conditions (CD43, CD44). (E) Examples of flow cytograms in virus infection inhibition assays in HEK293T cells and SARS-CoV2-PP. Expressions of ACE2-mTagBFP2 (left) and SNAP-MUC1(14TR) (middle) were measured at the time of infection, and expression of GFP (right) was measured 2 days after the infection in the same batch of cells. Dark is null HEK293T cells without ACE2 and MUC1 expression. Green lines for HEK293T-ACE2 cells without MUC1 expression. Red lines for HEK293T-ACE2-MUC1 cells. (F) Infection inhibition assays for HEK293T cells and various other viruses (lentivirus, adenovirus, and adeno-associated virus). Mean GFP expression of infected cells is plotted along with mean MUC1 (14TR) densities in cells at the time of infection. These were measured by flow cytometry, in a similar manner as in the assay for SARS-CoV2-PP. (G) Measurement of surface densities of SNAP – Surface 488 labeled SNAP – MUC1 (14TR) proteins in HEK 293T cells, transfected with different amounts of plasmid DNAs. (H) Integrated amount of GFP expression in SARS-CoV2-PP infected HEK 293T cells compared with integrated amount of ACE2-mTagBFP2 expression at the time of infection. (I) Graphical model for Bayesian hierarchical sigmoidal regression of infection inhibition assay data. (J) Results of four repeated rounds of MCMC samplings by Numpyro for inferences for each parameter. (K) Relations between amino acid sequence for ectodomain of each protein and molecular specific IC50 density in sigmoidal inhibitory function inferred from Bayesian hierarchical modeling (σ_IC50). (L) Flow cytometry measurements for liposomes containing serially diluted dye-conjugated lipids and fluorescent membrane incorporating molecules (Bodipy-FL, peryelene, and DID) with indicated mol%. Linear fitting shown was used for calibration. (M) Fluorescence emission spectrum for equimolar molecules (50 µM for green and far-red channels, and 100 µM for blue channel), excited at 405 nm, 488 nm, and 638 nm, respectively. Membrane dyes were measured as incorporated in liposomes. Purified recombinant mTagBFP2 was used.CC BY · PubMed Central
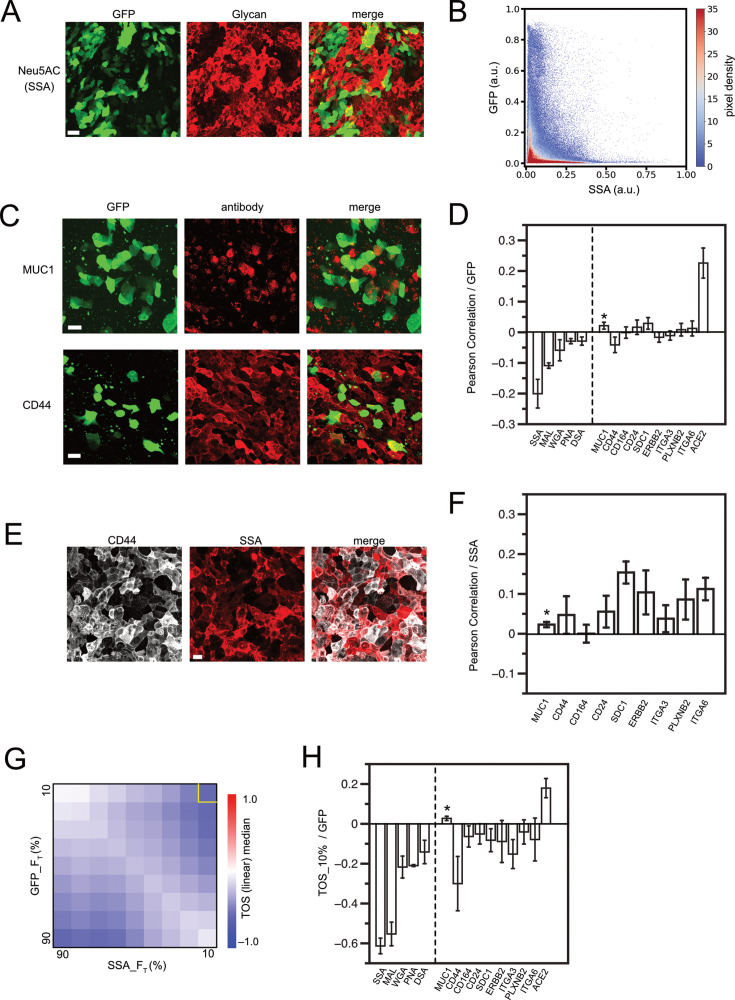
Figure 2. Virus infection in epithelium regulated by glycan contents in each cell. (A) Maximum projection of Z-stack images at 1 µm intervals taken with a confocal microscope. SARS-CoV2-pp-infected, air-liquid interface (ALI)-cultured Calu-3 cell monolayers were chemically fixed and imaged by binding of Alexa Fluor 647-labeled Neu5AC-specific lectin from Sambucus sieboldiana (SSA) and GFP expression from the infecting virus. (B) Density scatter plot of normalized fluorescence intensities in all pixels in (A) in both GFP and SSA channels. Color indicates the pixel density. (C) SARS-CoV2-pp infected Calu-3 ALI monolayer, imaged by immunofluorescence for each membrane protein and GFP. Maximal projection of z-stack of images is shown. (D) Pearson correlation for fluorescence intensities of lectin/antibody and GFPs in image pixels in maximal projection of z-stack images. Error bars are standard error of mean from images from three or more different samples. Lectins used were SSA, MAL (from Maackia amurensis, Neu5AC specific), WGA (from Triticum vulgaris, GlcNAc specific), PNA, and DSA (from Datura stramonium, GlcNAc specific). (E) SARS-CoV2-pp infected Calu-3 ALI monolayer, imaged by immunofluorescence for CD44 and SSA lectin binding. Maximal projection of z-stack images is shown. (F) Pearson correlation of lectin/antibody signal and SSA signal in image pixels in maximal projection of z-stack images. Error bars are standard error of mean from images from three or more different samples. (G) TOS analysis for GFP and SSA signal pixels in image of (A). (H) Correlation in top 10% in both axes in the TOS analysis. Error bars are standard error of mean from images from three or more different samples. *MUC1 has a small mean expression level and variance and is more affected by measurement noise than other molecules when calculating the Pearson correlation function (C and F). In addition, the number of cells in which expression can be detected is small, so no significant correlation was detected by TOS analysis (H). Scale bars = 40 µm (A) and 20 µm (C, E).
Figure 2. Virus infection in epithelium regulated by glycan contents in each cell. (A) Maximum projection of Z-stack images at 1 µm intervals taken with a confocal microscope. SARS-CoV2-pp-infected, air-liquid interface (ALI)-cultured Calu-3 cell monolayers were chemically fixed and imaged by binding of Alexa Fluor 647-labeled Neu5AC-specific lectin from Sambucus sieboldiana (SSA) and GFP expression from the infecting virus. (B) Density scatter plot of normalized fluorescence intensities in all pixels in (A) in both GFP and SSA channels. Color indicates the pixel density. (C) SARS-CoV2-pp infected Calu-3 ALI monolayer, imaged by immunofluorescence for each membrane protein and GFP. Maximal projection of z-stack of images is shown. (D) Pearson correlation for fluorescence intensities of lectin/antibody and GFPs in image pixels in maximal projection of z-stack images. Error bars are standard error of mean from images from three or more different samples. Lectins used were SSA, MAL (from Maackia amurensis, Neu5AC specific), WGA (from Triticum vulgaris, GlcNAc specific), PNA, and DSA (from Datura stramonium, GlcNAc specific). (E) SARS-CoV2-pp infected Calu-3 ALI monolayer, imaged by immunofluorescence for CD44 and SSA lectin binding. Maximal projection of z-stack images is shown. (F) Pearson correlation of lectin/antibody signal and SSA signal in image pixels in maximal projection of z-stack images. Error bars are standard error of mean from images from three or more different samples. (G) TOS analysis for GFP and SSA signal pixels in image of (A). (H) Correlation in top 10% in both axes in the TOS analysis. Error bars are standard error of mean from images from three or more different samples. *MUC1 has a small mean expression level and variance and is more affected by measurement noise than other molecules when calculating the Pearson correlation function (C and F). In addition, the number of cells in which expression can be detected is small, so no significant correlation was detected by TOS analysis (H). Scale bars = 40 µm (A) and 20 µm (C, E).CC BY · PubMed Central
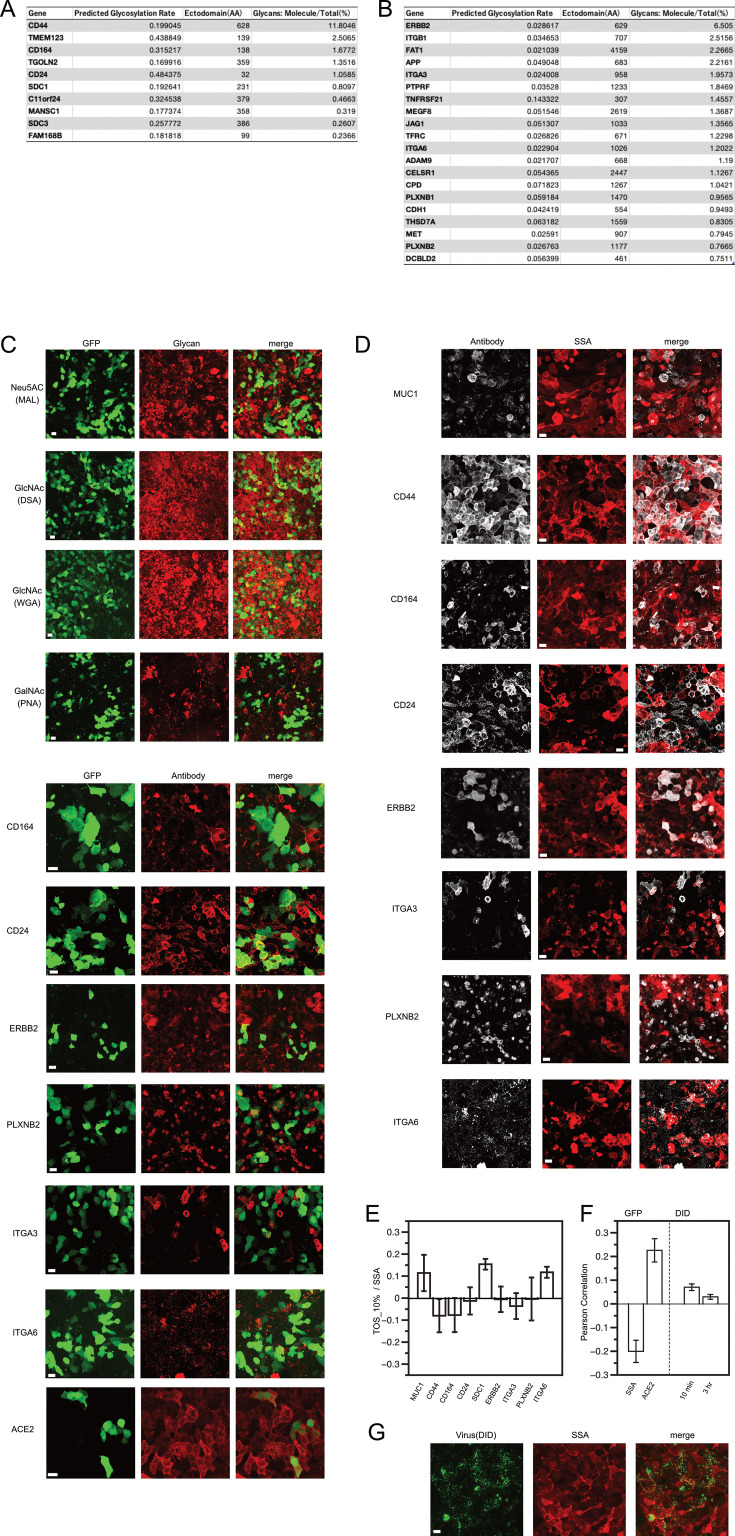
Figure 2—figure supplement 1. Virus infection in epithelium regulated by glycan contents in each cell. (A-B) List of highly expressed membrane proteins in air liquid interface cultured Calu-3 cells, aligned in the order of normalized expression shown in bulk RNA-seq analysis by Wyler E et al. (GSE148729). Ratios for total glycans of each molecule are calculated by combining with predicted glycosylation rate determined in our study and the ratio of expression from the RNA seq result. The panel A is the list for proteins predicted to have predicted glycosylation rate >0.15, and the panel B is the list for other membrane proteins. (C) Maximal projection of z-stack of images. SARS-CoV2-pp infected air-liquid interface (ALI) cultured Calu-3 cell monolayer, imaged by the binding of Alexa Fluor 647-labeled lectins specific for indicated glycans or the binding of primary and Alexa Fluor 555-labeled secondary antibodies against indicated proteins, and the expression of GFP derived from infected viruses. (D) Maximal projection of z-stack of images. SARS-CoV2-pp infected air-liquid interface (ALI) cultured Calu-3 cell monolayer, imaged by the binding of Alexa647-labeled Neu5AC-specific lectin from Sambucus sieboldiana (SSA) and the binding of primary and Alexa Fluor 555-labeled secondary antibodies against indicated proteins. (E) Correlation in top 10% in both axes in TOS analysis, for colocalizations in SSA and glycoproteins. Error bars are standard error of mean from images from three or more different samples. (F-G) DID-labeled SARS-CoV2-pp was incubated on ALI Calu-3 cells for 10 min or 3 hr, and the Pearson correlation between DID and SSA was calculated at the pixel level. Correlation values were compared to those of positively and negatively correlated samples (ACE2, SSA, versus GFP, respectively). Example virus and lectin images after 10 min virus incubation are shown in G. Scale bar 20 µm.
Figure 2—figure supplement 1. Virus infection in epithelium regulated by glycan contents in each cell. (A-B) List of highly expressed membrane proteins in air liquid interface cultured Calu-3 cells, aligned in the order of normalized expression shown in bulk RNA-seq analysis by Wyler E et al. (GSE148729). Ratios for total glycans of each molecule are calculated by combining with predicted glycosylation rate determined in our study and the ratio of expression from the RNA seq result. The panel A is the list for proteins predicted to have predicted glycosylation rate >0.15, and the panel B is the list for other membrane proteins. (C) Maximal projection of z-stack of images. SARS-CoV2-pp infected air-liquid interface (ALI) cultured Calu-3 cell monolayer, imaged by the binding of Alexa Fluor 647-labeled lectins specific for indicated glycans or the binding of primary and Alexa Fluor 555-labeled secondary antibodies against indicated proteins, and the expression of GFP derived from infected viruses. (D) Maximal projection of z-stack of images. SARS-CoV2-pp infected air-liquid interface (ALI) cultured Calu-3 cell monolayer, imaged by the binding of Alexa647-labeled Neu5AC-specific lectin from Sambucus sieboldiana (SSA) and the binding of primary and Alexa Fluor 555-labeled secondary antibodies against indicated proteins. (E) Correlation in top 10% in both axes in TOS analysis, for colocalizations in SSA and glycoproteins. Error bars are standard error of mean from images from three or more different samples. (F-G) DID-labeled SARS-CoV2-pp was incubated on ALI Calu-3 cells for 10 min or 3 hr, and the Pearson correlation between DID and SSA was calculated at the pixel level. Correlation values were compared to those of positively and negatively correlated samples (ACE2, SSA, versus GFP, respectively). Example virus and lectin images after 10 min virus incubation are shown in G. Scale bar 20 µm.CC BY · PubMed Central
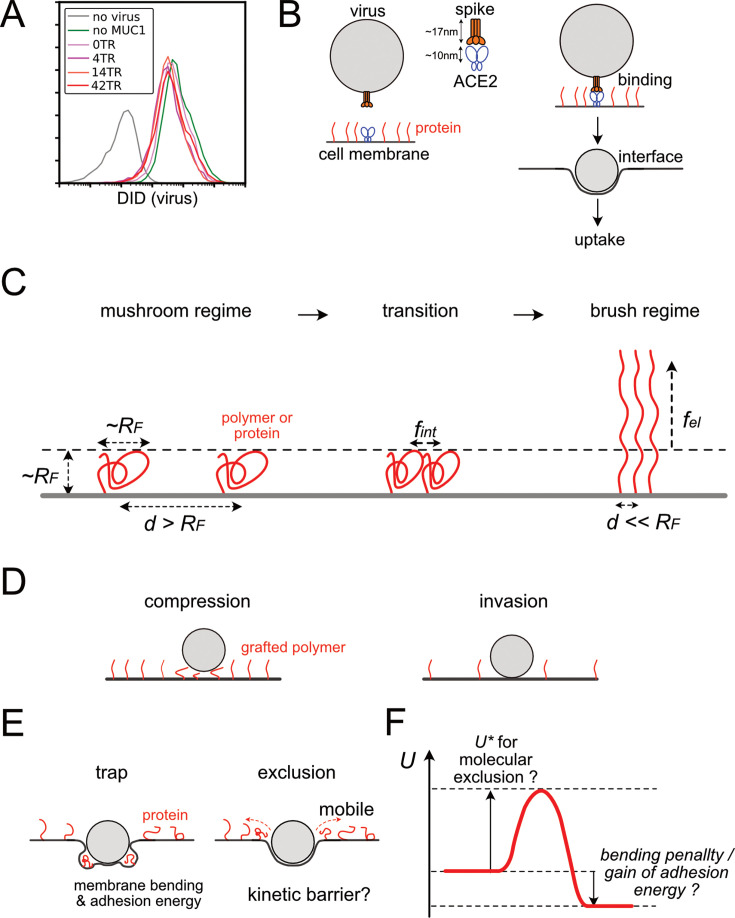
Figure 3. Structure of interface between viruses and cell membranes and polymer brush theory. (A) Flow cytogram of DID labeled SARS-CoV2-PP binding to HEK293T cells expressing ACE2, TMPRSS2, and/or various truncation mutants of MUC1. (B) Schematic diagram of the interface structure between the virus and the cell membrane during the process from cell-virus binding to virus uptake via stable interface formation. (C) Basics of polymer brush theory and free energy of the polymer in the course of mushroom to brush transitions. d, spacing distance between polymers, RF, Flory radius of polymers, fint, and fel, intermolecular and elastic free energies per a single polymer. (D) Two types of interfacial structures of particle binding to polymer graft surfaces in the conventional polymer brush model. (E) Two additional structure types of particle-surface interface, specialized cases for virus-cell interface. (F) A chart for free energy of the system U during the process of virus-cell interface formation.
Figure 3. Structure of interface between viruses and cell membranes and polymer brush theory. (A) Flow cytogram of DID labeled SARS-CoV2-PP binding to HEK293T cells expressing ACE2, TMPRSS2, and/or various truncation mutants of MUC1. (B) Schematic diagram of the interface structure between the virus and the cell membrane during the process from cell-virus binding to virus uptake via stable interface formation. (C) Basics of polymer brush theory and free energy of the polymer in the course of mushroom to brush transitions. d, spacing distance between polymers, RF, Flory radius of polymers, fint, and fel, intermolecular and elastic free energies per a single polymer. (D) Two types of interfacial structures of particle binding to polymer graft surfaces in the conventional polymer brush model. (E) Two additional structure types of particle-surface interface, specialized cases for virus-cell interface. (F) A chart for free energy of the system U during the process of virus-cell interface formation.CC BY · PubMed Central
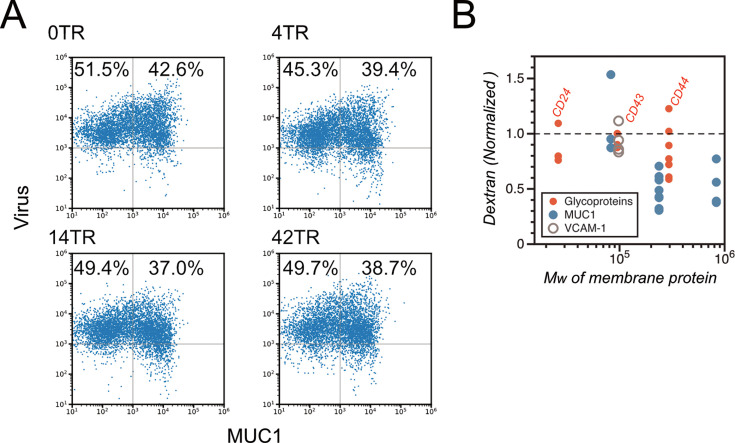
Figure 3—figure supplement 1. Virus binding to cells and fluid phase endocytosis were not significantly affected by surface glycoproteins. (A) Dual-color flow cytogram (DID and SNAP surface 488) of DID-labeled SARS-CoV2-pp-bound HEK293T cells expressing MUC1 with tandem repeat domains of the indicated lengths. MUC1 was labeled and quantified with SNAP surface 488. (B) Normalized mean fluorescence intensity of FITC-labeled dextran endocytosed into HEK293T cells expressing the indicated membrane proteins, measured by flow cytometry. Data are normalized to a control sample without exogenous membrane protein expression and plotted against the molecular weight of the introduced membrane protein. Three different MUC1 molecules with different molecular weights (0TR, 14TR, and 42TR) were used. Each dot represents an independent measurement.
Figure 3—figure supplement 1. Virus binding to cells and fluid phase endocytosis were not significantly affected by surface glycoproteins. (A) Dual-color flow cytogram (DID and SNAP surface 488) of DID-labeled SARS-CoV2-pp-bound HEK293T cells expressing MUC1 with tandem repeat domains of the indicated lengths. MUC1 was labeled and quantified with SNAP surface 488. (B) Normalized mean fluorescence intensity of FITC-labeled dextran endocytosed into HEK293T cells expressing the indicated membrane proteins, measured by flow cytometry. Data are normalized to a control sample without exogenous membrane protein expression and plotted against the molecular weight of the introduced membrane protein. Three different MUC1 molecules with different molecular weights (0TR, 14TR, and 42TR) were used. Each dot represents an independent measurement.CC BY · PubMed Central
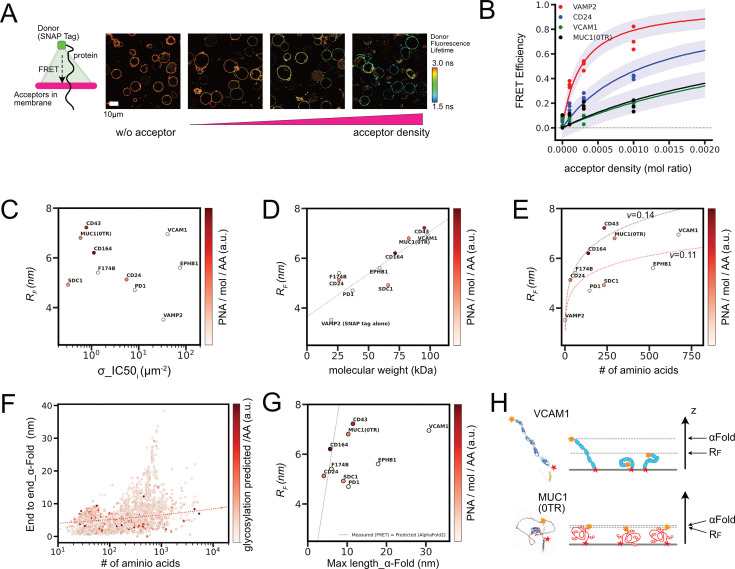
Figure 4. In situ FLIM–FRET measurements for protein sizes and conformational predictions. (A) Example of FLIM images for cells expressing SNAP–Surface 488 conjugated CD24 proteins and being incorporated with PlasMem Bright Red dyes in different surface densities. Schematic drawing (left) depicts a geometry of the FRET from a single donor dye conjugated to SNAP tag at the end of protein ectodomain to populations of acceptor dyes incorporated in plasma membrane. (B) FRET efficiency estimated from FLIM imaging for cells expressing each protein at different mean acceptor densities. Lines are predicted mean FRET efficiencies from Bayesian hierarchical inference (see Method details), and purple area represents one sigma below and above the lines. (C) Relations between inferred Flory radius from FLIM – FRET analyses and inferred σ_IC50 from infection inhibition assays. Measured glycosylation rate PNA/mol/AA was depicted in color. (D) Relations between inferred Flory radius from FLIM – FRET analyses and estimated molecular weight including glycans. Dot line is the result of linear regression. (E) Relations between inferred Flory radius from FLIM – FRET analyses and amino acid length. Dot lines are the fit to the Flory model for RF ~Nν. (F) Relations between the distance between coordinates of two amino acids at both ends of ectodomain in Alpha Fold2 predicted conformations and number of amino acids for all 2515 proteins in the list. The number of predicted glycosylation sites per amino acid was depicted in color. The dot line indicates the Flory model RF ~Nν, where ν=0.14. (G) Relations between the distance between coordinates of two amino acids at both ends of ectodomain in Alpha Fold2 predicted conformations for our sample molecules and measured Flory radius from FLIM–FRET assays. A dot line indicates where the measured RF is equal to the Alpha Fold 2 predicted length. (H) Schematic diagram of protein conformational dynamics and two length scales, RF and Alpha Fold 2 prediction. Yellow and red stars indicate the two ends of the ectodomain.
Figure 4. In situ FLIM–FRET measurements for protein sizes and conformational predictions. (A) Example of FLIM images for cells expressing SNAP–Surface 488 conjugated CD24 proteins and being incorporated with PlasMem Bright Red dyes in different surface densities. Schematic drawing (left) depicts a geometry of the FRET from a single donor dye conjugated to SNAP tag at the end of protein ectodomain to populations of acceptor dyes incorporated in plasma membrane. (B) FRET efficiency estimated from FLIM imaging for cells expressing each protein at different mean acceptor densities. Lines are predicted mean FRET efficiencies from Bayesian hierarchical inference (see Method details), and purple area represents one sigma below and above the lines. (C) Relations between inferred Flory radius from FLIM – FRET analyses and inferred σ_IC50 from infection inhibition assays. Measured glycosylation rate PNA/mol/AA was depicted in color. (D) Relations between inferred Flory radius from FLIM – FRET analyses and estimated molecular weight including glycans. Dot line is the result of linear regression. (E) Relations between inferred Flory radius from FLIM – FRET analyses and amino acid length. Dot lines are the fit to the Flory model for RF ~Nν. (F) Relations between the distance between coordinates of two amino acids at both ends of ectodomain in Alpha Fold2 predicted conformations and number of amino acids for all 2515 proteins in the list. The number of predicted glycosylation sites per amino acid was depicted in color. The dot line indicates the Flory model RF ~Nν, where ν=0.14. (G) Relations between the distance between coordinates of two amino acids at both ends of ectodomain in Alpha Fold2 predicted conformations for our sample molecules and measured Flory radius from FLIM–FRET assays. A dot line indicates where the measured RF is equal to the Alpha Fold 2 predicted length. (H) Schematic diagram of protein conformational dynamics and two length scales, RF and Alpha Fold 2 prediction. Yellow and red stars indicate the two ends of the ectodomain.CC BY · PubMed Central
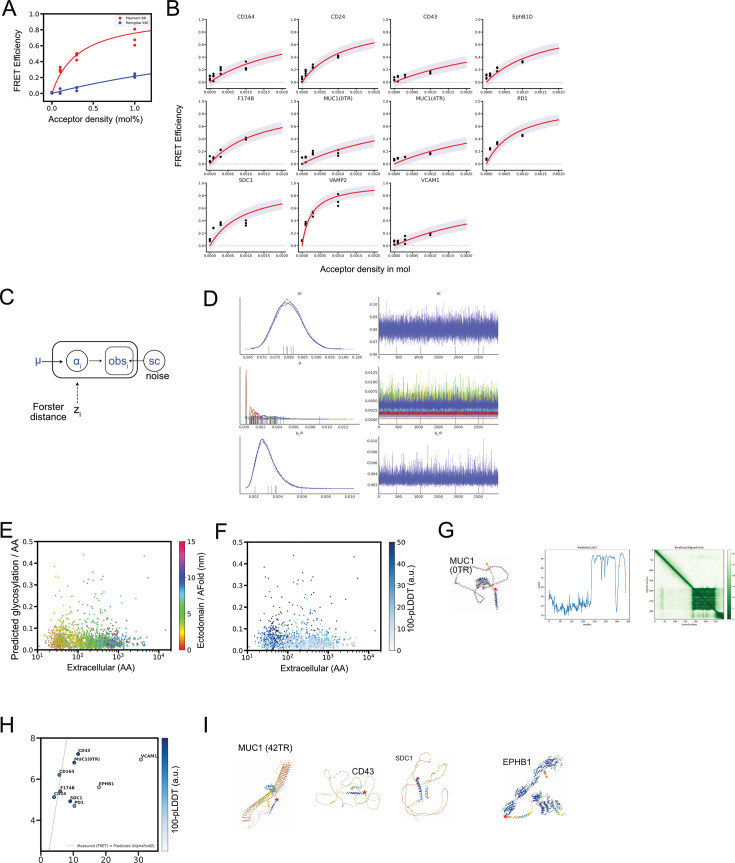
Figure 4—figure supplement 1. Technical details for In situ FLIM–FRET measurements for protein sizes and conformational predictions. (A) FRET efficiency estimated from FLIM imaging for HEK 293T cells expressing SNAP-VAMP2 conjugated with SNAP – Surface 488, where cell membranes contained different mean acceptor densities of either PlasMem Bright Red or MemGlow 590. Lines are learned predicted mean FRET efficiencies from Bayesian hierarchical inference (see method), and purple area represents one sigma below and above the lines. (B) FRET efficiency estimated from FLIM imaging for cells expressing each protein at different mean acceptor densities. Lines are learned predicted mean FRET efficiencies from Bayesian hierarchical inference (see Method details), and the purple area represents one sigma below and above the lines. (C) Graphical model for Bayesian hierarchical regression of FLIM – FRET data. (D) Results of four repeated rounds of MCMC samplings by Numpyro for inferences for each parameter. (E) Protein size derived from the predicted ectodomain conformations by AlphaFold 2, plotted on Figure 1C by color map. (F) Predicted local Distance Difference test scores (pLDDT) for the predicted ectodomain conformations by AlphaFold 2 were subtracted from 100 and were plotted on Figure 1C by color map. By applying this color map that is inverse to original pLDDT score, proteins predicted not to fit well to reference models were highlighted by darker blue marks. (G) Alpha Fold 2 (ver 2.2 in Google Colaboratory) predicted conformation of MUC1 (0TR), with predicted LDDT along with amino acid and the map of predicted aligned error. (H) Relations between pLDDT subtracted from 100 in Alpha Fold 2 prediction and measured Flory radius from FLIM – FRET assays. The dot line indicates where the measured RF is equal to the Alpha Fold 2 predicted length. (I) Conformation drawings of proteins predicted by Alpha Fold 2. Yellow and red stars indicate the two ends of ectodomain.
Figure 4—figure supplement 1. Technical details for In situ FLIM–FRET measurements for protein sizes and conformational predictions. (A) FRET efficiency estimated from FLIM imaging for HEK 293T cells expressing SNAP-VAMP2 conjugated with SNAP – Surface 488, where cell membranes contained different mean acceptor densities of either PlasMem Bright Red or MemGlow 590. Lines are learned predicted mean FRET efficiencies from Bayesian hierarchical inference (see method), and purple area represents one sigma below and above the lines. (B) FRET efficiency estimated from FLIM imaging for cells expressing each protein at different mean acceptor densities. Lines are learned predicted mean FRET efficiencies from Bayesian hierarchical inference (see Method details), and the purple area represents one sigma below and above the lines. (C) Graphical model for Bayesian hierarchical regression of FLIM – FRET data. (D) Results of four repeated rounds of MCMC samplings by Numpyro for inferences for each parameter. (E) Protein size derived from the predicted ectodomain conformations by AlphaFold 2, plotted on Figure 1C by color map. (F) Predicted local Distance Difference test scores (pLDDT) for the predicted ectodomain conformations by AlphaFold 2 were subtracted from 100 and were plotted on Figure 1C by color map. By applying this color map that is inverse to original pLDDT score, proteins predicted not to fit well to reference models were highlighted by darker blue marks. (G) Alpha Fold 2 (ver 2.2 in Google Colaboratory) predicted conformation of MUC1 (0TR), with predicted LDDT along with amino acid and the map of predicted aligned error. (H) Relations between pLDDT subtracted from 100 in Alpha Fold 2 prediction and measured Flory radius from FLIM – FRET assays. The dot line indicates where the measured RF is equal to the Alpha Fold 2 predicted length. (I) Conformation drawings of proteins predicted by Alpha Fold 2. Yellow and red stars indicate the two ends of ectodomain.CC BY · PubMed Central
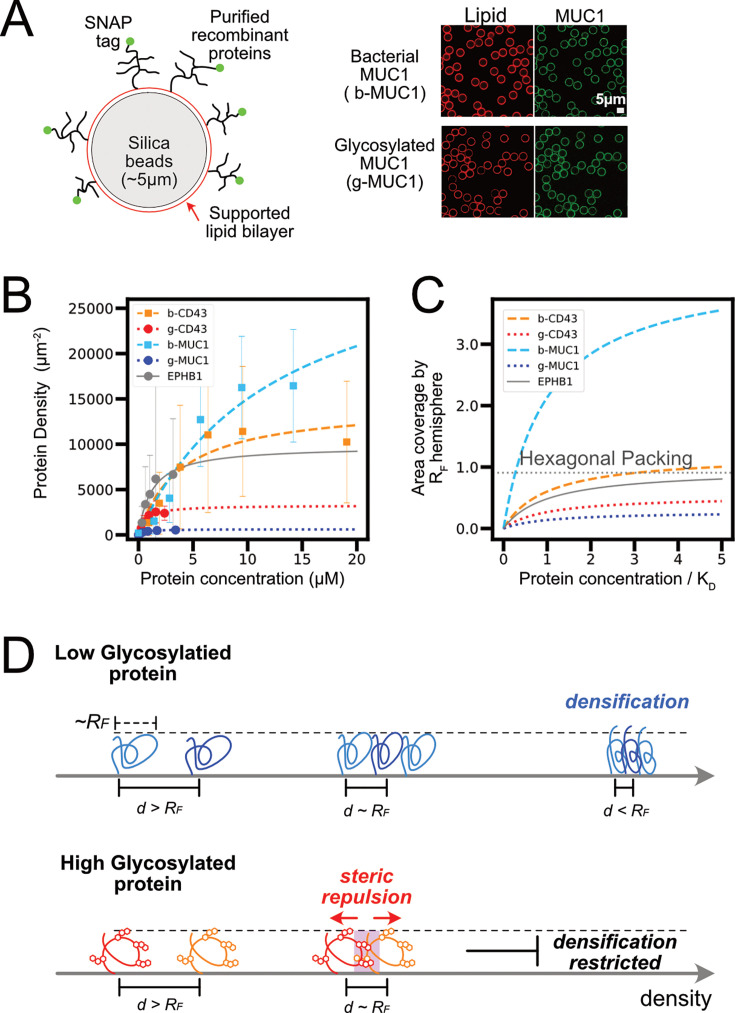
Figure 5. Biochemical reconstitution of protein packing in membrane surface. (A) Lipid bilayers coated on silica beads for incorporating bacterial (b-) and glycosylated (mammalian expressed, g-) proteins, schematic and fluorescent images. (B) Representative result for flow cytometry analyses of protein binding to lipid bilayer coated silica beads. Bar is the standard deviation in each measurement. Lines are regression curves to receptor binding model Bx/(KD +x), where x is protein concentration, KD is the dissociation constant, and B is the saturated density. (C) Relations of surface area coverage by bound proteins and concentrations of proteins used for membrane binding. Surface area was normalized by assuming all bound proteins were in a hemisphere of radius RF and the ratio of coverage was calculated. Protein concentrations were normalized by KD. The dot line in the plot indicates the coverage when the hemisphere of radius RF aligned in a hexagonal close packing. (D) Schematic for structures and free energies for glycosylated and non-glycosylated proteins with similar RF that are at diluted and more condensed densities on the membrane surface.
Figure 5. Biochemical reconstitution of protein packing in membrane surface. (A) Lipid bilayers coated on silica beads for incorporating bacterial (b-) and glycosylated (mammalian expressed, g-) proteins, schematic and fluorescent images. (B) Representative result for flow cytometry analyses of protein binding to lipid bilayer coated silica beads. Bar is the standard deviation in each measurement. Lines are regression curves to receptor binding model Bx/(KD +x), where x is protein concentration, KD is the dissociation constant, and B is the saturated density. (C) Relations of surface area coverage by bound proteins and concentrations of proteins used for membrane binding. Surface area was normalized by assuming all bound proteins were in a hemisphere of radius RF and the ratio of coverage was calculated. Protein concentrations were normalized by KD. The dot line in the plot indicates the coverage when the hemisphere of radius RF aligned in a hexagonal close packing. (D) Schematic for structures and free energies for glycosylated and non-glycosylated proteins with similar RF that are at diluted and more condensed densities on the membrane surface.CC BY · PubMed Central
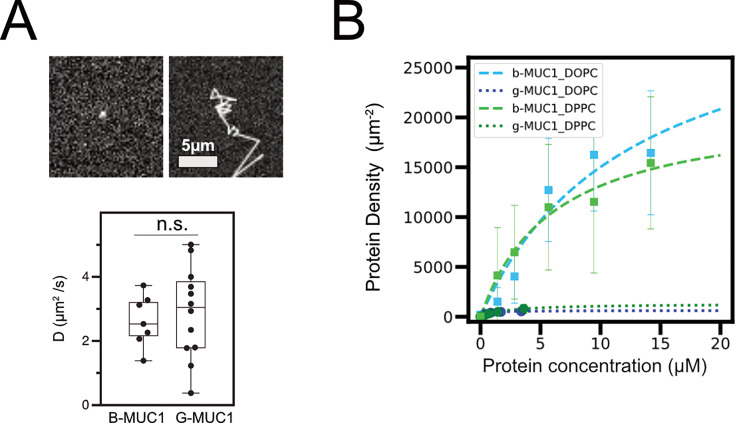
Figure 5—figure supplement 1. Dynamics is not a factor to influence the packing of glycoprotein. (A) An example of a snapshot image of single molecular SNAP–cell TMR star conjugated g-MUC1 (14TR) (upper left) and a tracked path of its diffusive motion on a supported lipid bilayer (upper right). Statistics of diffusion coefficients of g-MUC1 and b-MUC1 calculated from tracked paths (lower). n.s.: nonspecific in a two-sided unpaired t-test with Welch’s correction. (B) Representative result for flow cytometry analyses of protein binding to lipid bilayer coated silica beads. Bar is standard deviation in each measurement. Lines are regression curves to receptor binding model Bx/(KD +x), where x is protein concentration, KD is the dissociation constant, and B is the saturated density.
Figure 5—figure supplement 1. Dynamics is not a factor to influence the packing of glycoprotein. (A) An example of a snapshot image of single molecular SNAP–cell TMR star conjugated g-MUC1 (14TR) (upper left) and a tracked path of its diffusive motion on a supported lipid bilayer (upper right). Statistics of diffusion coefficients of g-MUC1 and b-MUC1 calculated from tracked paths (lower). n.s.: nonspecific in a two-sided unpaired t-test with Welch’s correction. (B) Representative result for flow cytometry analyses of protein binding to lipid bilayer coated silica beads. Bar is standard deviation in each measurement. Lines are regression curves to receptor binding model Bx/(KD +x), where x is protein concentration, KD is the dissociation constant, and B is the saturated density.CC BY · PubMed Central
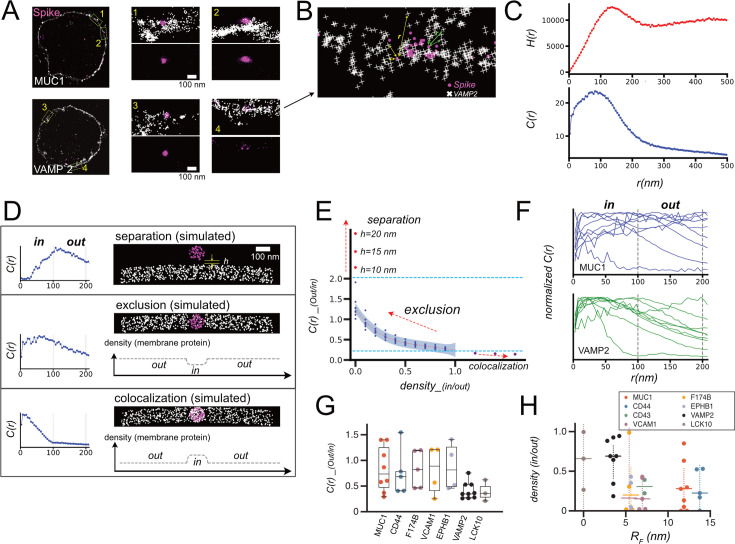
Figure 6. Superresolution imaging of virus and cellular proteins for analyses of virus – cell interface. (A) Dual color STORM images of SNAP-MUC1/SNAP-VAMP2 in cells and Spike in SARS-CoV-2-PP bound to the cells. Whole cell images (left) were reconstructed from STORM data, and coordinates determined by STORM were individually plotted in expanded images on the right. (B) Schematic of calculation of cross-correlation. Mutual distance between all combinations of two dyes was calculated from the coordinates determined by STORM imaging. (C) Examples of histogram of mutual distances between all combinations of two dyes were calculated from coordinates H(r), and the cross-correlation function C(r) that is the normalized radial average of H(r). Δr, a size of shell and the bin size for histogram, was set to be 5 nm. (D) Examples of simulated STORM images, and calculated C(r) from these images. h denotes the distance between virus and cell when they are separated, and density plot illustrates average protein densities along membranes in these images. (E) Plot of C(r)_(out/in) calculated for all simulated images, along with density_(in/out) and h. Blue dashed lines indicate upper and lower bounds for C(r)_(out/in) calculated for stable virus – cell interface, and red dot line is the fifth polynomial regression to data point and purple area represents one sigma below and above the line. (F) Traces of C(r) for individual cells expressing MUC1 and VAMP2. (G) C(r)_(out/in) calculated for all STORM images. (H) density_(in/out) for all STORM images converted from C(r)_(out/in) based on the regression in E was plotted along with RF for each protein determined by FLIM – FRET (Figure 4).
Figure 6. Superresolution imaging of virus and cellular proteins for analyses of virus – cell interface. (A) Dual color STORM images of SNAP-MUC1/SNAP-VAMP2 in cells and Spike in SARS-CoV-2-PP bound to the cells. Whole cell images (left) were reconstructed from STORM data, and coordinates determined by STORM were individually plotted in expanded images on the right. (B) Schematic of calculation of cross-correlation. Mutual distance between all combinations of two dyes was calculated from the coordinates determined by STORM imaging. (C) Examples of histogram of mutual distances between all combinations of two dyes were calculated from coordinates H(r), and the cross-correlation function C(r) that is the normalized radial average of H(r). Δr, a size of shell and the bin size for histogram, was set to be 5 nm. (D) Examples of simulated STORM images, and calculated C(r) from these images. h denotes the distance between virus and cell when they are separated, and density plot illustrates average protein densities along membranes in these images. (E) Plot of C(r)_(out/in) calculated for all simulated images, along with density_(in/out) and h. Blue dashed lines indicate upper and lower bounds for C(r)_(out/in) calculated for stable virus – cell interface, and red dot line is the fifth polynomial regression to data point and purple area represents one sigma below and above the line. (F) Traces of C(r) for individual cells expressing MUC1 and VAMP2. (G) C(r)_(out/in) calculated for all STORM images. (H) density_(in/out) for all STORM images converted from C(r)_(out/in) based on the regression in E was plotted along with RF for each protein determined by FLIM – FRET (Figure 4).CC BY · PubMed Central
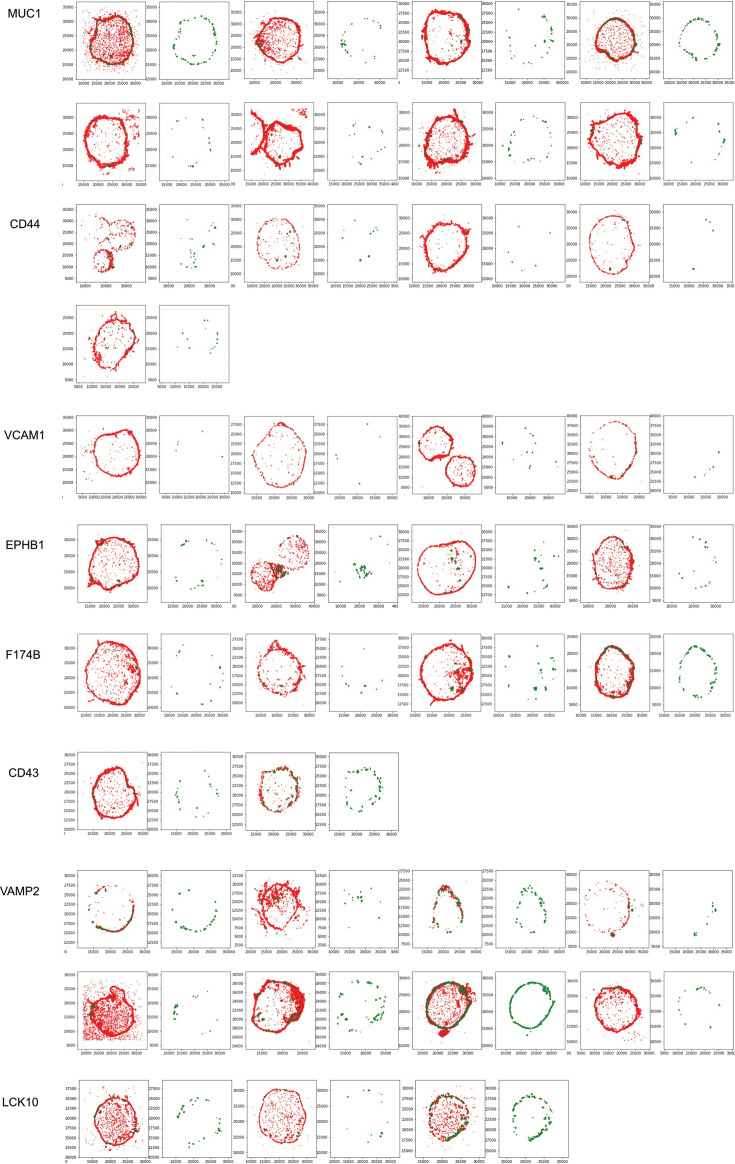
Figure 6—figure supplement 1. STORM images of all analyzed cells, expressing designated proteins. The detected spots of SNAP-surface Alexa 647 bound to each membrane protein are shown in red, and the spots of CF568-conjugated anti-mouse IgG secondary antibody that recognizes Spike on SARS-CoV2-PP are shown in green. For cells, a pair of two-color composite images and a CF658-only image are shown. mNumbers on axes are coordinates in nanometer.
Figure 6—figure supplement 1. STORM images of all analyzed cells, expressing designated proteins. The detected spots of SNAP-surface Alexa 647 bound to each membrane protein are shown in red, and the spots of CF568-conjugated anti-mouse IgG secondary antibody that recognizes Spike on SARS-CoV2-PP are shown in green. For cells, a pair of two-color composite images and a CF658-only image are shown. mNumbers on axes are coordinates in nanometer.CC BY · PubMed Central
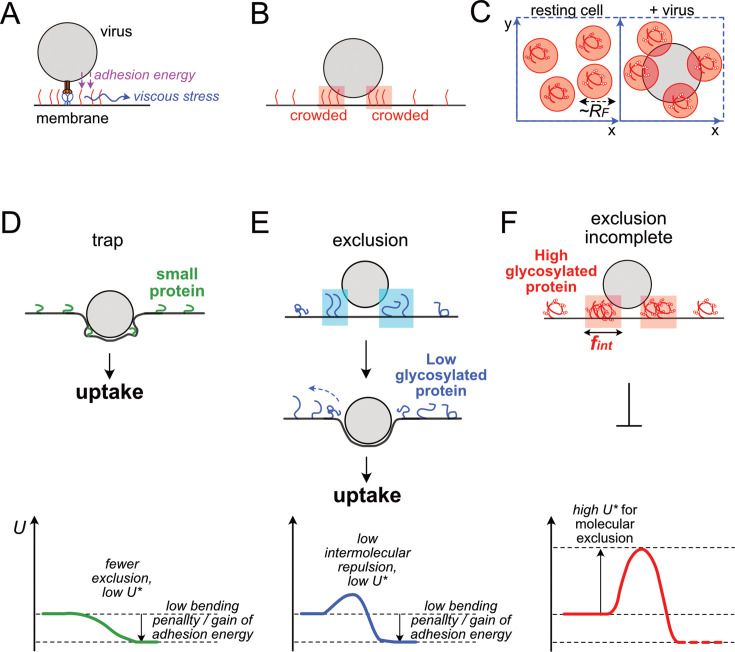
Figure 7. Models for three distinct cases of virus – cell interface. (A) Energy and force involved in molecular exclusion from virus-cell interface. (B) Transient distribution of membrane proteins nearby the interface. (C) Two-dimensional distribution of viruses and glycoproteins on the surface horizontal direction of the cell membrane. (D-F) Schematic of virus-cell interface structure and corresponding free energy chart. (D) Virus-cell interface with very small membrane proteins. Due to the low energy penalty in constructing virus-cell interface entrapping these small molecules, the virus can form the interface without excluding proteins and can infect cells. (E-F). Virus-cell interface structure for larger membrane proteins. Interface formation requires protein exclusion. Due to membrane viscosity and inhomogeneous field in adhesive energy, excluded proteins become crowded at proximity of the interface. In the case for highly glycosylated proteins (F), intermolecular repulsion between excluded proteins becomes very high at high density regions. Such repulsion generates a high kinetic barrier for molecular exclusion, preventing the process from proceeding to subsequent steps for infection. In contrast, in the case of low glycosylated proteins (E), their intermolecular repulsion and energy barrier are lower, and thus these molecules are easier to be excluded from the interface, and virus infection is not strongly inhibited.
Figure 7. Models for three distinct cases of virus – cell interface. (A) Energy and force involved in molecular exclusion from virus-cell interface. (B) Transient distribution of membrane proteins nearby the interface. (C) Two-dimensional distribution of viruses and glycoproteins on the surface horizontal direction of the cell membrane. (D-F) Schematic of virus-cell interface structure and corresponding free energy chart. (D) Virus-cell interface with very small membrane proteins. Due to the low energy penalty in constructing virus-cell interface entrapping these small molecules, the virus can form the interface without excluding proteins and can infect cells. (E-F). Virus-cell interface structure for larger membrane proteins. Interface formation requires protein exclusion. Due to membrane viscosity and inhomogeneous field in adhesive energy, excluded proteins become crowded at proximity of the interface. In the case for highly glycosylated proteins (F), intermolecular repulsion between excluded proteins becomes very high at high density regions. Such repulsion generates a high kinetic barrier for molecular exclusion, preventing the process from proceeding to subsequent steps for infection. In contrast, in the case of low glycosylated proteins (E), their intermolecular repulsion and energy barrier are lower, and thus these molecules are easier to be excluded from the interface, and virus infection is not strongly inhibited.CC BY · PubMed Central

Verification

Claims the paper makes

The claims and statistics of this paper haven’t been checked yet.

Run the check — free, no account needed. It reads the open-access text and checks the sources it cites.

A few free checks a day · papers already verified open instantly · results are public

Self-check

Percentages, sums and reported differences re-computed from the paper’s own numbers.

The self-check needs the paper’s full text.

Citations

Cites

Research works printed but not linked: 81

  1. Ahern, 2022, A blood atlas of COVID-19 defines hallmarks of disease severity and specificity, Cell, 185, 916, 10.1016/j.cell.2022.01.012 · DOI · Paper page
  2. Alexander, 1977, Polymer adsorption on small spheres. A scaling approach, Journal de Physique, 38, 977, 10.1051/jphys:01977003808097700 · DOI
  3. Attili, 2012, Films of end-grafted hyaluronan are a prototype of a brush of a strongly charged, semiflexible polyelectrolyte with intrinsic excluded volume, Biomacromolecules, 13, 1466, 10.1021/bm3001759 · DOI
  4. Bateman, 2023, UniProt: the universal protein knowledgebase in 2023, Nucleic Acids Research, 51, D523, 10.1093/nar/gkac1052 · DOI · Paper page
  5. Biering, 2022, Genome-wide bidirectional CRISPR screens identify mucins as host factors modulating SARS-CoV-2 infection, Nature Genetics, 54, 1078, 10.1038/s41588-022-01131-x · DOI
  6. Carbone, 2017, In vitro reconstitution of T cell receptor-mediated segregation of the CD45 phosphatase, PNAS, 114, E9338, 10.1073/pnas.1710358114 · DOI
  7. Chan, 2020, A familial cluster of pneumonia associated with the 2019 novel coronavirus indicating person-to-person transmission: a study of a family cluster, The Lancet, 395, 514, 10.1016/S0140-6736(20)30154-9 · DOI
  8. Chatterjee, 2023, Glycosylated extracellular mucin domains protect against SARS-CoV-2 infection at the respiratory surface, PLOS Pathogens, 19, 10.1371/journal.ppat.1011571 · DOI
  9. Chauhan, 2013, In silico platform for prediction of N-, O- and C-glycosites in eukaryotic protein sequences, PLOS ONE, 8, 10.1371/journal.pone.0067008 · DOI
  10. de Gennes, 1980, Conformations of polymers attached to an interface, Macromolecules, 13, 1069, 10.1021/ma60077a009 · DOI
  11. Delaveris, 2020, Membrane-tethered mucin-like polypeptides sterically inhibit binding and slow fusion kinetics of influenza A virus, PNAS, 117, 12643, 10.1073/pnas.1921962117 · DOI
  12. Delgado, 2020, Mechanical regulation of cell size, fate, and behavior during asymmetric cell division, Current Opinion in Cell Biology, 67, 9, 10.1016/j.ceb.2020.07.002 · DOI
  13. Delorey, 2021, COVID-19 tissue atlases reveal SARS-CoV-2 pathology and cellular targets, Nature, 595, 107, 10.1038/s41586-021-03570-8 · DOI
  14. Du, 2023, Tuning immunity through tissue mechanotransduction, Nature Reviews. Immunology, 23, 174, 10.1038/s41577-022-00761-w · DOI
  15. Dworkin, 2022, Applying transcriptomics to studyglycosylation at the cell type level, iScience, 25, 10.1016/j.isci.2022.104419 · DOI
  16. Ellinghaus, 2020, Genomewide association study of severe covid-19 with Respiratory Failure, The New England Journal of Medicine, 383, 1522, 10.1056/NEJMoa2020283 · DOI
  17. Enyedi, 2016, The cell nucleus serves as a mechanotransducer of tissue damage-induced inflammation, Cell, 165, 1160, 10.1016/j.cell.2016.04.016 · DOI
  18. Evans, 1996, Interactions between polymer-grafted membranes in concentrated solutions of free polymer, Langmuir, 12, 3031, 10.1021/la9509559 · DOI
  19. Faivre, 2018, Intermolecular interactions between bottlebrush polymers boost the protection of surfaces against frictional wear, Chemistry of Materials, 30, 4140, 10.1021/acs.chemmater.8b01676 · DOI
  20. Furlan, 2014, Phosphatase CD45 both positively and negatively regulates T cell receptor phosphorylation in reconstituted membrane protein clusters, The Journal of Biological Chemistry, 289, 28514, 10.1074/jbc.M114.574319 · DOI
  21. Galush, 2008, Quantitative fluorescence microscopy using supported lipid bilayer standards, Biophysical Journal, 95, 2512, 10.1529/biophysj.108.131540 · DOI
  22. Gibson, 1979, Application of Forster resonance energy transfer to interactions between cell or lipid vesicle surfaces, Biochemical and Biophysical Research Communications, 88, 141, 10.1016/0006-291X(79)91708-X · DOI
  23. Grant, 2021, Circuits between infected macrophages and T cells in SARS-CoV-2 pneumonia, Nature, 590, 635, 10.1038/s41586-020-03148-w · DOI
  24. Gupta, 2002, Prediction of glycosylation across the human proteome and the correlation to protein function, Pacific Symposium on Biocomputing, 1, 310
  25. Hadjadj, 2020, Impaired type I interferon activity and inflammatory responses in severe COVID-19 patients, Science, 369, 718, 10.1126/science.abc6027 · DOI · Paper page
  26. Halperin, 1999, Polymer brushes that resist adsorption of model proteins: design parameters, Langmuir, 15, 2525, 10.1021/la981356f · DOI
  27. Hansen, 2003, Osmotic properties of poly(ethylene glycols): quantitative features of brush and bulk scaling laws, Biophysical Journal, 84, 350, 10.1016/S0006-3495(03)74855-3 · DOI
  28. Hermans, 1952, The excluded volume of polymer chains, The Journal of Chemical Physics, 20, 1360, 10.1063/1.1700763 · DOI
  29. Hiergeist, 1996, Elastic properties of polymer-decorated membranes, Journal de Physique II, 6, 1465, 10.1051/jp2:1996142 · DOI
  30. Huang, 2021, Global mapping of glycosylation pathways in human-derived cells, Developmental Cell, 56, 1195, 10.1016/j.devcel.2021.02.023 · DOI
  31. Jalihal, 2020, Multivalent proteins rapidly and reversibly phase-separate upon osmotic cell volume change, Molecular Cell, 79, 978, 10.1016/j.molcel.2020.08.004 · DOI
  32. Kaizuka, 2021, Mechanochemical regulation of cell adhesion by incorporation of synthetic polymers to plasma membranes, Langmuir, 37, 366, 10.1021/acs.langmuir.0c02955 · DOI
  33. Kaizuka, 2023, Antiviral activity of cell membrane-bound amphiphilic polymers, Langmuir, 39, 5408, 10.1021/acs.langmuir.3c00054 · DOI
  34. Kaizuka Y. 2024. ELife_glycoprotein-virus. Software Heritage. swh:1:rev:8db9adc8b33320a56c53e63062c9546e4dd6a874. https://archive.softwareheritage.org/swh:1:dir:95ae02cb1978367755e2cedd26fae90e85ea45bc;origin=https://github.com/ykaizuka/eLife_glycoprotein-virus;visit=swh:1:snp:63ebff451683c0f926acd41905599a6a93a7a231;anchor=swh:1:rev:8db9adc8b33320a56c53e63062c9546e4dd6a874.
  35. Ke, 2020, Structures and distributions of SARS-CoV-2 spike proteins on intact virions, Nature, 588, 498, 10.1038/s41586-020-2665-2 · DOI
  36. Kreussling, 1954, The excluded volume of branched chains, Journal of Polymer Science, 12, 123, 10.1002/pol.1954.120120110 · DOI
  37. Kuo, 2018, Physical biology of the cancer cell glycocalyx, Nature Physics, 14, 658, 10.1038/s41567-018-0186-9 · DOI
  38. Le, 2024, Redistribution of the glycocalyx exposes phagocytic determinants on apoptotic cells, Developmental Cell, 59, 853, 10.1016/j.devcel.2024.01.020 · DOI
  39. Lee, 2021, Stochasticity and positive feedback enable enzyme kinetics at the membrane to sense reaction size, PNAS, 118, 10.1073/pnas.2103626118 · DOI
  40. Li, 2022, Theoretical analysis of the elastic free energy contributions to polymer brushes in poor solvent: A refined mean-field theory, The Journal of Chemical Physics, 157, 10.1063/5.0103351 · DOI
  41. Linden, 2008, Mucins in the mucosal barrier to infection, Mucosal Immunology, 1, 183, 10.1038/mi.2008.5 · DOI
  42. Ma, 2014, TCR Triggering by pMHC Ligands Tethered on Surfaces via Poly(Ethylene Glycol) Depends on Polymer Length, PLOS ONE, 9, 10.1371/journal.pone.0112292 · DOI
  43. Mariani, 2013, lDDT: a local superposition-free score for comparing protein structures and models using distance difference tests, Bioinformatics, 29, 2722, 10.1093/bioinformatics/btt473 · DOI · Paper page
  44. McAuley, 2017, The cell surface mucin MUC1 limits the severity of influenza A virus infection, Mucosal Immunology, 10, 1581, 10.1038/mi.2017.16 · DOI
  45. Meckiff, 2020, Imbalance of regulatory and cytotoxic SARS-CoV-2-Reactive CD4+ T Cells in COVID-19, Cell, 183, 1340, 10.1016/j.cell.2020.10.001 · DOI
  46. Milner, 1991, Polymer brushes, Science, 251, 905, 10.1126/science.251.4996.905 · DOI
  47. Moremen, 2012, Vertebrate protein glycosylation: diversity, synthesis and function, Nature Reviews. Molecular Cell Biology, 13, 448, 10.1038/nrm3383 · DOI
  48. Murakami, 2020, Virion-incorporated PSGL-1 and CD43 inhibit both cell-free infection and transinfection of HIV-1 by preventing virus–cell binding, PNAS, 117, 8055, 10.1073/pnas.1916055117 · DOI
  49. Nye, 2008, Kinetic control of histidine-tagged protein surface density on supported lipid bilayers, Langmuir, 24, 4145, 10.1021/la703788h · DOI
  50. Ogando, 2020, SARS-coronavirus-2 replication in Vero E6 cells: replication kinetics, rapid adaptation and cytopathology, The Journal of General Virology, 101, 925, 10.1099/jgv.0.001453 · DOI
  51. Overney, 1996, Compliance measurements of confined polystyrene solutions by atomic force microscopy, Physical Review Letters, 76, 1272, 10.1103/PhysRevLett.76.1272 · DOI
  52. Paszek, 2014, The cancer glycocalyx mechanically primes integrin-mediated growth and survival, Nature, 511, 319, 10.1038/nature13535 · DOI · Paper page
  53. Paturej, 2016, Molecular structure of bottlebrush polymers in melts, Science Advances, 2, 10.1126/sciadv.1601478 · DOI
  54. Pyrć, 2021, SARS-CoV-2 inhibition using a mucoadhesive, amphiphilic chitosan that may serve as an anti-viral nasal spray, Scientific Reports, 11, 10.1038/s41598-021-99404-8 · DOI
  55. Rademacher, 1988, GLYCOBIOLOGY, Annual Review of Biochemistry, 57, 785, 10.1146/annurev.bi.57.070188.004033 · DOI
  56. Ravindra, 2021, Single-cell longitudinal analysis of SARS-CoV-2 infection in human airway epithelium identifies target cells, alterations in gene expression, and cell state changes, PLOS Biology, 19, 10.1371/journal.pbio.3001143 · DOI · Paper page
  57. Reshef, 2011, Detecting novel associations in large data sets, Science, 334, 1518, 10.1126/science.1205438 · DOI
  58. Riback, 2019, Commonly used FRET fluorophores promote collapse of an otherwise disordered protein, PNAS, 116, 8889, 10.1073/pnas.1813038116 · DOI
  59. Russell, 2018, Extreme heterogeneity of influenza virus infection in single cells, eLife, 7, 10.7554/eLife.32303 · DOI
  60. Rust, 2006, Sub-diffraction-limit imaging by stochastic optical reconstruction microscopy (STORM), Nature Methods, 3, 793, 10.1038/nmeth929 · DOI
  61. Saraswathibhatla, 2023, Cell-extracellular matrix mechanotransduction in 3D, Nature Reviews. Molecular Cell Biology, 24, 495, 10.1038/s41580-023-00583-1 · DOI
  62. Schnitzbauer, 2018, Correlation analysis framework for localization-based superresolution microscopy, PNAS, 115, 3219, 10.1073/pnas.1711314115 · DOI
  63. Sheng, 2016, Systematic and general method for quantifying localization in microscopy images, Biology Open, 5, 1882, 10.1242/bio.019893 · DOI
  64. Shurer, 2019, Physical principles of membrane shape regulation by the Glycocalyx, Cell, 177, 1757, 10.1016/j.cell.2019.04.017 · DOI
  65. Sibener, 2018, Isolation of a Structural Mechanism for Uncoupling T cell receptor signaling from peptide-MHC Binding, Cell, 174, 672, 10.1016/j.cell.2018.06.017 · DOI
  66. Stauffer, 2018, EzColocalization: an imageJ plugin for visualizing and measuring colocalization in cells and organisms, Scientific Reports, 8, 10.1038/s41598-018-33592-8 · DOI
  67. Steentoft, 2013, Precision mapping of the human O-GalNAc glycoproteome through SimpleCell technology, The EMBO Journal, 32, 1478, 10.1038/emboj.2013.79 · DOI · Paper page
  68. Stone, 2015, Steady-state cross-correlations for live two-colour super-resolution localization data sets, Nature Communications, 6, 10.1038/ncomms8347 · DOI
  69. Tesei, 2024, Conformational ensembles of the human intrinsically disordered proteome, Nature, 626, 897, 10.1038/s41586-023-07004-5 · DOI
  70. Thompson, 2019, Virus recognition of glycan receptors, Current Opinion in Virology, 34, 117, 10.1016/j.coviro.2019.01.004 · DOI
  71. Ushiyama, 2015, Induction of intermembrane adhesion by incorporation of synthetic adhesive molecules into cell membranes, Langmuir, 31, 1988, 10.1021/la504523c · DOI
  72. Van den Steen, 1998, Concepts and principles of O-linked glycosylation, Critical Reviews in Biochemistry and Molecular Biology, 33, 151, 10.1080/10409239891204198 · DOI
  73. Varma, 2006, T cell receptor-proximal signals are sustained in peripheral microclusters and terminated in the central supramolecular activation cluster, Immunity, 25, 117, 10.1016/j.immuni.2006.04.010 · DOI
  74. Wardzala, 2022, Mucins inhibit coronavirus infection in a glycan-dependent manner, ACS Central Science, 8, 351, 10.1021/acscentsci.1c01369 · DOI
  75. Wong, 2002, Molecular topography imaging by intermembrane fluorescence resonance energy transfer, PNAS, 99, 14147, 10.1073/pnas.212392599 · DOI
  76. Wu, 1994, Resonance energy transfer: methods and applications, Analytical Biochemistry, 218, 1, 10.1006/abio.1994.1134 · DOI
  77. Wu, 2002, Combinatorial study of the mushroom-to-brush crossover in surface anchored polyacrylamide, Journal of the American Chemical Society, 124, 9394, 10.1021/ja027412n · DOI
  78. Wyler, 2021, Transcriptomic profiling of SARS-CoV-2 infected human cell lines identifies HSP90 as target for COVID-19 therapy, iScience, 24, 10.1016/j.isci.2021.102151 · DOI
  79. Yoshida, 2022, Local and systemic responses to SARS-CoV-2 infection in children and adults, Nature, 602, 321, 10.1038/s41586-021-04345-x · DOI · Paper page
  80. Zhao, 2000, Polymer brushes: surface-immobilized macromolecules, Progress in Polymer Science, 25, 677, 10.1016/S0079-6700(00)00012-5 · DOI · Paper page
  81. Ziegler, 2021, Impaired local intrinsic immunity to SARS-CoV-2 infection in severe COVID-19, Cell, 184, 4713, 10.1016/j.cell.2021.07.023 · DOI

Metadata

Authors
Kaizuka, Y., & Machida, R.
Affiliations
National Institute for Materials Science (JP)
Corresponding author
Kaizuka, Yoshihisa
Venue
eLife
Published
2025-10-28
Volume
14
ISSN
2050-084X (ISSN-L)
OpenAlex
W4406518185
Cited by
0
References
3
Type
posted content
Language
en
Open access
Locations
  • eLife (publishedVersion, cc-by)
  • Europe PMC (PubMed Central) (publishedVersion, cc-by)
  • PubMed (publishedVersion)
  • DOAJ (DOAJ: Directory of Open Access Journals) (submittedVersion, cc-by-sa)
  • NIMS Materials Data Repository (submittedVersion, cc-by)
Funders
National Institute for Materials Science
Topics
  • Life Sciences › Biochemistry, Genetics and Molecular Biology › Molecular Biology › Glycosylation and Glycoproteins Research
  • Life Sciences › Biochemistry, Genetics and Molecular Biology › Cell Biology › Cellular transport and secretion
  • Life Sciences › Biochemistry, Genetics and Molecular Biology › Molecular Biology › Viral Infectious Diseases and Gene Expression in Insects
Keywords
viral infection inhibition, steric repulsion, glycoproteins, kinetic barriers, cell surface glycosylation
MeSH terms
Animals, Cell Membrane, Glycoproteins, Humans, Kinetics, Polysaccharides, Virion, Virus Internalization

About these checks

Registry, retraction, Cites and statistics results are computed, not judged, with one exception: a printed reference that no index lists is read once by a model before it counts as a citation error. Claims are extracted by a model and kept only when their quote appears verbatim in the text; each cited source is then checked, with a model’s help, for whether it says what the claim relies on. Those verdicts can be wrong — read the claim’s quote and the cited source before relying on one.

Statistics and arithmetic are recomputed, not judged.

Confidence bands are shown only for fields calibrated on our annotated test set. None is calibrated yet, so no band is shown.

What counts as a claim ›How we measure confidence ›How we check this ›

Are you an author, or do you see a problem with this page? Request a review