

The DOI matches its Crossref record; 27 of the 29 references it cites were found in a registry or an index; none of the 28 sources its claims cite is checked for support yet.
scikit-image: image processing in Python
Open accessPublished version of a preprint
Abstract
scikit-image is an image processing library that implements algorithms and utilities for use in research, education and industry applications. It is released under the liberal Modified BSD open source license, provides a well-documented API in the Python programming language, and is developed by an active, international team of collaborators. In this paper we highlight the advantages of open source to achieve the goals of the scikit-image library, and we showcase several real-world image processing applications that use scikit-image. More information can be found on the project homepage, http://scikit-image.org.
Overview
CoChat Summary
TL;DR
scikit-image is an open-source (Modified BSD) Python image processing library built on NumPy arrays, described here alongside its design philosophy, development practices, and real-world research, education, and industry use cases. The paper is a software description rather than an empirical study, presenting the library's architecture, submodules, and example applications.
Key findings
- The project started in August 2009, has received contributions from more than 100 individuals, and was downloaded more than 5,000 times from PyPI in March 2014 alone.
- As of version 0.10 the package contains 15 sub-modules (color, data, draw, exposure, feature, filter, graph, io, measure, morphology, novice, restoration, segmentation, transform, viewer).
- Unit test coverage is "above 87% as of release 0.10 and continues to rise," with continuous integration checking each commit on both Python 2 and Python 3.
- Images are represented as NumPy arrays under an "Anything In, Anything Out" convention, with floating-point images expected in [0, 1] (unsigned) or [−1, 1] (signed) and 8-bit images in {0, …, 255}.
Methods
- Design: a descriptive/software paper outlining the library's goals (high-quality documented algorithms, education, industry use), data format, pipelining conventions, and development practices (GitHub pull-request review, PEP8 compliance, Cython for performance-critical sections).
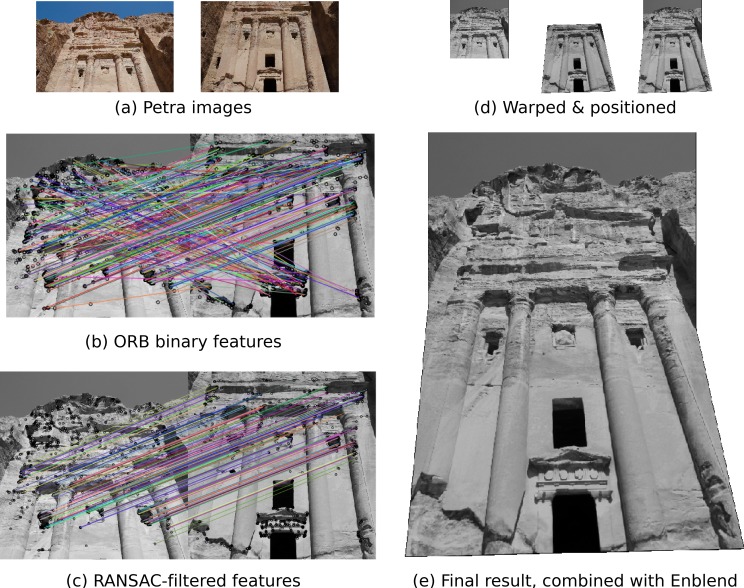
- Data/sample: illustrative usage examples rather than a study sample — analysis of drying colloidal droplets (crack tracking via Hough transform), zebrafish spinal cord regeneration (measure.profile_line), silicon wafer defect detection at BT Imaging, disguise detection at AICBT, and a Petra panorama stitching demo using ORB features and RANSAC.
- Main analysis: narrative exposition of API design, licensing, and comparisons with related libraries (Mahotas, ImageJ/Fiji, Matlab's toolbox, OpenCV); no quantitative benchmark or evaluation is reported.
Limitations
- Stated by the paper: the authors note that their choice of a high-level language "may affect performance," and that strict code review guidelines "may hamper the number of features we ultimately provide"; they also note that Fiji's breadth of functionality is "unparalleled" and that OpenCV offers faster implementations for real-time applications.
- Evident from the text: full test coverage is listed as a roadmap goal, implying it is not yet achieved; the paper reports no performance benchmarks, accuracy metrics, or user studies to substantiate the claimed advantages.
- Evident from the text: the usage examples are demonstrations of the library's capabilities rather than controlled evaluations, so no comparative outcome data are provided.
Model-written summary. Check it against the paper before relying on it.
Integrity signals
Registry
Cites
Statistics
Figures
Verification
Claims the paper makes
0 Valid · 10 Not valid · 21 Not checked · 66 Own results and interpretations
A check of a cited source is scheduled, or we don’t hold its full text yet; the claim is checked once it runs.
In the paper
“scikit-image represents images as NumPy arrays (Van der Walt, Colbert & Varoquaux, 2011), the de facto standard for storage of multi-dimensional data in scientific Python.”
§ scikit-image: image processing in Python > Data format and pipelining
What the sources say
- Not checked yetcites Van der Walt, Colbert & Varoquaux, 2011 source
A check is scheduled.
plain- Asserted: passes — The authors put it forward as true.
- Checkable: passes — It can be checked against evidence.
- Load-bearing: passes — The paper’s conclusions depend on it.
- Based: passes — The paper gives a reason why it holds.
- Not checked yet
None of the sources cited for this claim have been checked yet.
In the paper
“Data can be passed as-is to other tools such as NumPy, SciPy, matplotlib, scikit-learn (Pedregosa et al., 2011), Mahotas (Coelho, 2013), OpenCV, and more.”
§ scikit-image: image processing in Python > Data format and pipelining
What the sources say
- Not matchedcites Pedregosa et al., 2011
Couldn’t be matched to a paper in Crossref, so it can’t be checked.
- Not checked yetcites Coelho, 2013 source
plain- Asserted: passes — The authors put it forward as true.
- Checkable: passes — It can be checked against evidence.
- Load-bearing: passes — The paper’s conclusions depend on it.
- Based: passes — The paper gives a reason why it holds.
- Not matched
In the paper
“The library is licensed under the Modified BSD license, which allows unrestricted redistribution for any purpose as long as copyright notices and disclaimers of warranty are maintained (Wilson, 2012).”
§ scikit-image: image processing in Python > Development practices
What the sources say
- Not matchedcites Wilson, 2012
Couldn’t be matched to a paper in Crossref, so it can’t be checked.
plain- Asserted: passes — The authors put it forward as true.
- Checkable: passes — It can be checked against evidence.
- Load-bearing: unclear — It is unclear whether the paper’s conclusions depend on it.
- Based: passes — The paper gives a reason why it holds.
- Not matched
A result the paper reports from its own data — it cites no other source for it, so there is none to check. The quote shows it is in the paper.
In the paper
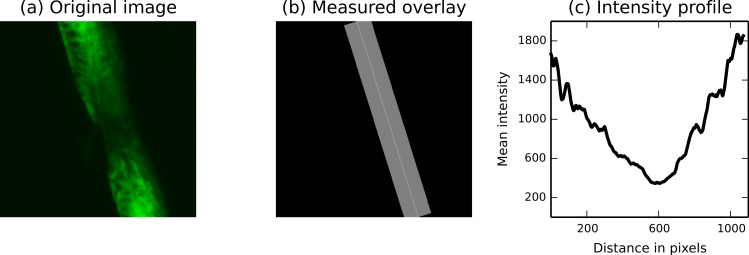
“Next, in regenerative medicine research, scikit-image is used to monitor the regeneration of spinal cord cells in zebrafish embryos (Fig. 3).”
§ scikit-image: image processing in Python > Usage examples > Research
plain- Asserted: passes — The authors put it forward as true.
- Checkable: passes — It can be checked against evidence.
- Load-bearing: unclear — It is unclear whether the paper’s conclusions depend on it.
- Based: passes — The paper gives a reason why it holds.
A result the paper states — it cites no source for it, so there is none to check. The quote shows it is in the paper.
In the paper
“Although Fiji’s breadth of functionality is unparalleled, it is centered around interactive, GUI use.”
§ scikit-image: image processing in Python > Discussion > Related work
plain- Asserted: passes — The authors put it forward as true.
- Checkable: passes — It can be checked against evidence.
- Load-bearing: passes — The paper’s conclusions depend on it.
- Based: passes — The paper gives a reason why it holds.
1 more claim
Create a free account to see all 97 claims and to verify the 10 references still open.
- Probably not a substantial claim. 87
- It may state two separate claims as one. 39
- The quote only partly states this claim. 1
Citations
Cites
Scikit-learn: Machine Learning in Python
Pedregosa, F., Varoquaux, G., Gramfort, A., Michel, V., Thirion, B., Grisel, O., Blondel, M., Müller, A., Nothman, J., Louppe, G., et al. (2012) · arXiv · doi:10.48550/arxiv.1201.0490 · Cited by 71,016
Fiji: an open-source platform for biological-image analysis
Schindelin, J., Arganda-Carreras, I., Frise, E., Kaynig, V., Longair, M., Pietzsch, T., Preibisch, S., Rueden, C., Saalfeld, S., Schmid, B., et al. (2012) · Nature Methods · doi:10.1038/nmeth.2019 · Cited by 66,890
NIH Image to ImageJ: 25 years of image analysis
Schneider, C. A., Rasband, W. S., & Eliceiri, K. W. (2012) · Nature Methods · doi:10.1038/nmeth.2089 · Cited by 64,638
Matplotlib: a 2D graphics environment
Hunter, J. D. (2007) · Computing in Science & Engineering · doi:10.1109/mcse.2007.55 · Cited by 39,249
A Computational Approach to Edge Detection
Canny, J. (1986) · IEEE Transactions on Pattern Analysis and Machine Intelligence · doi:10.1109/tpami.1986.4767851 · Cited by 30,004
Fischler, M. A., & Bolles, R. C. (1981) · Communications of the ACM · doi:10.1145/358669.358692 · Cited by 25,893
ORB: An efficient alternative to SIFT or SURF
Rublee, E., Rabaud, V., Konolige, K., & Bradski, G. (2011) · 2011 International Conference on Computer Vision · doi:10.1109/iccv.2011.6126544 · Cited by 11,037
The NumPy Array: A Structure for Efficient Numerical Computation
van der Walt, S., Colbert, S. C., & Varoquaux, G. (2011) · Computing in Science & Engineering · doi:10.1109/mcse.2011.37 · Cited by 9,381
The Laplacian pyramid as a compact image code
Burt, P., & Adelson, E. (1983) · IEEE Transactions on Communications · doi:10.1109/tcom.1983.1095851 · Cited by 6,077
Python for scientific computing
Oliphant, T. E. (2007) · Computing in Science & Engineering · doi:10.1109/mcse.2007.58 · Cited by 3,303
Cited by
Items 7,301–7,400 of 8,191
Computer Vision Approaches for Extracting Fire-Safety Information from Service Drawings
Ekstrand, J., & Truong, V. (2026) · Lund University Publications Student Papers (Lund University)
Monkam, P., Du, X., Wu, Y., Zhang, T., Xu, J., Feng, J., Chen, R., Liang, Z., & Qi, S. (2026) · Medical & Biological Engineering & Computing · doi:10.1007/s11517-026-03556-6
Leppäaho, A. (2026) · Tampere University Institutional Repository (Tampere University)
Elnageh, A., Forbes, S., Moreno, S. M., Mohanan, S., Smith, G. L., Huethorst, E., & Müllenbroich, C. (2026) · Journal of Microscopy · doi:10.1111/jmi.70201
Tui: A Multigenerational and Expert-Correctable Tracker for Cellular Dynamics
Chang, I.-M., & Tsai, H. (2026) · Computational and Structural Biotechnology Journal · doi:10.34133/csbj.0054
Roschke, J., Gast, B., Radenz, M., Ansmann, A., Seifert, P., McCosh, G., & Kalesse‐Los, H. (2026) · Geoscientific model development · doi:10.5194/gmd-19-9905-2026
Denoising framework for X-ray absorption spectroscopy data
Aidukas, T., Usmanova, I., Béjar, B., Nachtegaal, M., & Clark, A. H. (2026) · Journal of Synchrotron Radiation · doi:10.1107/s1600577526001712
Endothelial Adgrl2 Expression and Alternative Splicing Controls the Cerebrovasculature
King, A., Garcia, C., Blanton, C., Chen, A., Ahmad, A., Lukacsovich, D., Földy, C., Makita, T., & Anderson, G. R. (2026) · Journal of Neuroscience · doi:10.1523/jneurosci.0019-26.2026
Replaying the Tape: Comparative Genomics of Color Pattern in HeliconiusPreprint
Lawrence, C. G., Arias, C. F., McMillan, W. O., & Rubenstein, D. (2026) · bioRxiv (Cold Spring Harbor Laboratory) · doi:10.64898/2026.03.23.713665
Valman, S. J. (2025) · Nottingham ePrints (University of Nottingham) · doi:10.17639/12721
The effects of fission vs fusion-like neutron spectra on REBCO activation and microstructurePreprint
Reis, C., Kinyon, E., Martel, M., Hu, Y., Pat, F., Verstraete, W., Li, Z., Sobenes, R., Amundson, D., Yoon, K. N., et al. (2026) · Research Square · doi:10.21203/rs.3.rs-8888914/v1
Advancing Digital Twin Generation Through a Novel Simulation Framework and Quantitative BenchmarkingPreprint
Rubinstein, J., Donaty, A., & Engel, D. (2026) · arXiv (Cornell University) · doi:10.13016/m26vkp-qxv0
In-situ peel test analysis via synchrotron tomography and DVC
Ivarsson, N., Hall, S. A., Toft, N., Pettersson, S., Hallberg, H., Schlepütz, C. M., Novák, V., & Engqvist, J. (2026) · Tomography of Materials and Structures · doi:10.1016/j.tmater.2026.100084
SynThIA: A semi-automated tool for quantification of multi-partite synapsesPreprint
Neather, M., Morgan, J., & Wong, F. K. (2026) · bioRxiv (Cold Spring Harbor Laboratory) · doi:10.64898/2026.03.23.713591
Genetic architecture of cichlid brain morphology
Morris, J., Rivas-Sánchez, D. F., Elkin, J., Hickey, A., Fischer, B., Marconi, A., Durbin, R. M., Turner, G. F., Santos, M. E., & Montgomery, S. H. (2026) · Genetics · doi:10.1093/genetics/iyag300
Jeong, Y., Kwon, D., Kim, S.-O., Kim, G.-H., Park, M.-S., & Kim, Y. (2026) · Investigative Magnetic Resonance Imaging · doi:10.13104/imri.2025.0038
Model-based seismic inversion practice to the image seismic section
Raharjo, W., Palupi, I. R., & Alfiani, O. D. (2026) · AIP conference proceedings · doi:10.1063/5.0317032
Dentate gyrus and CA3 activity mediates light-tone second-order conditioning expression in mice
Canela-Grimau, M., Adell, J. B., Coll, D. R., González-Parra, J. A., Pinho, J., & Busquets-García, A. (2026) · iScience · doi:10.1016/j.isci.2026.115522
Jakob, J., Braun, M. B., Hipp, K., Koch, I., Li, G., Felgner, P., Giralt-Zúñiga, M., Raasch, H., Ghering-Khav, C., Szolek, A., et al. (2026) · bioRxiv (Cold Spring Harbor Laboratory) · doi:10.64898/2026.03.27.714778
松田, 直. (2023) · Institutional Repositories DataBase (IRDB) · doi:10.15083/0002011140
Myotubeの定量的自動セグメンテーションはS6キナーゼ活性化の1細胞dynamicsを明らかにする
Inoue, H. (2019) · Institutional Repositories DataBase (IRDB) · doi:10.15083/0002002605
水澤, 悟. (2022) · Institutional Repositories DataBase (IRDB) · doi:10.18952/00010101
Modiri, E., Rakovec, O., Shrestha, P. K., García-García, A., Avila, L., Blackford, K. R., Cooper, E., Droppers, B., Filippucci, P., Fischer, M., et al. (2026) · doi:10.5194/egusphere-2026-1012
Enhanced representation & learning of magnetic resonance signatures in multiple sclerosis
Karpate, Y. (2015) · theses.fr (ABES) · doi:10.70675/7b26f3f3zfab3z43b0z8d51z5ced495b8953
Pre-Deployment Complexity Estimation for Federated Perception SystemsPreprint
Solaiman, K., Islam, S., de Oliveira, R., & Bhargava, B. (2026) · arXiv (Cornell University) · doi:10.48550/arxiv.2603.28282
A remark on an error analysis for classical and learned Tikhonov regularization schemesPreprint
Behrens, A., Iske, M., Jiang, M., Maass, P., & Neumayer, S. (2026) · arXiv (Cornell University) · doi:10.48550/arxiv.2604.00759
Pereda, J. (2018) · theses.fr (ABES) · doi:10.70675/4e262992zd273z4ee6z95a2zc2a016cf837f
Cardiac myofibril networks induce shear stress
Murray, L. A., Quinn, A. P., Pinali, C., Collins, D. J., & Rajagopal, V. (2026) · npj Systems Biology and Applications · doi:10.1038/s41540-026-00696-1
Delassus, R. (2018) · theses.fr (ABES) · doi:10.70675/6709deabz656bz44daza182zbd95543ae323
Study on dynamics of microbial collective behaviour using an original machine-ecosystem interaction
Fosseprez, C. (2019) · theses.fr (ABES) · doi:10.70675/7395ef93z0fe1z4bfbz9d5czfce77c6b5e31
Unraveling the role of immunoglobulin-mediated adhesions within the neural stem cell niche
Cristina, A. S. (2021) · theses.fr (ABES) · doi:10.70675/02517ec6zd0fbz4343z8749zc5783f14fdc7
Post-transcriptional regulation by the RNA degradosome of the gastric pathogen Helicobacter pylori
Tejada-Arranz, A. (2021) · theses.fr (ABES) · doi:10.70675/ac3b1053z9001z4165z8691z3c7f8fe66e5c
Morice, P. (2020) · theses.fr (ABES) · doi:10.70675/a9546607z2470z4eb4z939dz9f86517ea337
Lombard, A. H. (2020) · theses.fr (ABES) · doi:10.70675/b75ebd76z6db4z4c6ezadcdz5c7fbd007dd9
MUSE's privileged look at the sources of cosmic reionization
de la Vieuville, G. (2019) · theses.fr (ABES) · doi:10.70675/954df3bcz512ez4976zbcc8z81e3bc1c3460
Molecular mechanisms of aneuploidy-mediated stress-resistance
Kucharavy, A. (2017) · theses.fr (ABES) · doi:10.70675/1194da4bzebb1z49a1zbf33z4aa4101d485f
Q-RUN: Quantum-inspired data re-uploading networks
Qiao, W., Wang, S., Zhang, P., Ming, Y., & Zhao, J. (2026) · Information Processing & Management · doi:10.1016/j.ipm.2026.104770
Adaptive localisation of the ETKF by domain clustering of the forecast ensemblePreprint
Mauran, S., Mouysset, S., Simon, E., & May, L. B. (2026) · HAL
Towards Reduced Dose Positron Emission Tomography Imaging Using Sparse Sampling and Machine Learning
Colmeiro, R. R. (2021) · theses.fr (ABES) · doi:10.70675/bf722efdz54d5z4c97zb1cfz60df79e8d4af
Singh, A. (2021) · theses.fr (ABES) · doi:10.70675/1fe33455z489ez47f2z8a69z32d906457a72
Patient-Specific In-vivo Dynamic Motion of Ascending Thoracic Aortic Aneurysms from Cine CTA
Valente, R., Mourato, A., Carvalho, A., Xavier, J., Brito, M., Avril, S., Tomás, A. C., & Fragata, J. (2026) · IEEE Transactions on Biomedical Engineering · doi:10.1109/tbme.2026.3681119
Détection de falsification d’images via l’analyse du démosaïquage : dévoilement d’une signature
Bammey, Q. (2021) · theses.fr (ABES) · doi:10.70675/ada5c835z7eecz4bd0zb943z245bab5cf1aa
Plasticité du site de liaison et mécanisme grappin de l'adhésine FimH
Languin–Cattoën, O. (2022) · theses.fr (ABES) · doi:10.70675/4d45f05dzd3c3z4db9za0c8z2633bd51bfca
Computer vision for the analysis of intra-cellular RNA localization patterns
Imbert, A. (2022) · theses.fr (ABES) · doi:10.70675/bb85932czd594z4c4fzb785z51e20a62ad87
Moreira, M. H. M. (2022) · theses.fr (ABES) · doi:10.70675/9603d951z185fz4a5dz8eaez394bc889600c
Etude des interactions origami d'ADN/surface pour des applications en lithographie
Rotsen, L. (2023) · theses.fr (ABES) · doi:10.70675/c65e1e7fz0725z48e9za8fcz8cefcc4d08c8
Jaleel, M. J. K. A. (2022) · theses.fr (ABES) · doi:10.70675/0b1c5319z9950z4e87zb8acz0bc61a266d4f
3D deep-learning based quantification of the nuclei distribution for light-sheet microscopy
Galindo, X. (2022) · theses.fr (ABES) · doi:10.70675/1703dc73z1f91z4856z80c7z0016d42bf27c
Yadav, C., & Reniwal, B. S. (2026) · IEEE Open Journal of the Computer Society · doi:10.1109/ojcs.2026.3681673
Galaxy morphology with Euclid : simulations, forecasts and detection with deep learning
Bretonnière, H. (2022) · theses.fr (ABES) · doi:10.70675/8f129d60z09daz4317zb532z6ea391cbdd9f
Méthodes computationnelles pour améliorer les phases primaires de recherche de nouveaux médicaments
Grignard, J. (2022) · theses.fr (ABES) · doi:10.70675/14300afaz228fz45bcz939fz8f8eab3c6699
Nanofluidique avec des bulles de savon et des surfactants
Bae, C. (2024) · theses.fr (ABES) · doi:10.70675/02660621zf701z424dzbf80z929c123c637f
Coloration-bleaching mechanisms in nickel-tungsten mixed oxides
Redor, S. (2024) · theses.fr (ABES) · doi:10.70675/49988a10zb6f0z4ab6zbe87zbfaf1abfdc95
Probing galactic growth with low surface brightness (LSB) data from deep imaging surveys
Sola, E. (2023) · theses.fr (ABES) · doi:10.70675/c03459f6z8feez4c3dzaba6ze65ac73c08ad
Controlling the microscopic emulsification by fine rheological tuning
Missi, E. (2023) · theses.fr (ABES) · doi:10.70675/66ed6e20za32bz4a0cz8aa6z37ff0660bf6a
Inter-organ communication in physiology and pathophysiology : a role for the ChREBP-FGF21 axis?
Carbinatti, T. (2024) · theses.fr (ABES) · doi:10.70675/5d147ab4zad37z4f6bzac51z32a08efeaa51
Advanced computational techniques to aid the rational design of small molecules targeting RNA
Panei, F. P. (2024) · theses.fr (ABES) · doi:10.70675/f278a628z9cf1z4408za15fzfed05518864e
Integration of contextual knowledge in deep Learning modeling for vision-based scene analysis
Benkirane, F. E. (2024) · theses.fr (ABES) · doi:10.70675/0e4c2937zce17z4a35za4d4za8b692969acb
Electromagnetic Field Exposure Reconstruction by Artificial Intelligence
Mallik, M. (2023) · theses.fr (ABES) · doi:10.70675/9fed277bzedaaz4398zb592z621b51499d81
Quinio, A. L. (2023) · theses.fr (ABES) · doi:10.70675/e12cac5bzb947z47e5zaec4z4afba7def9a8
Méta-décomposition et processus d'évaluation dans les applications d'apprentissage automatique
Modaresi, S. M. R. (2023) · theses.fr (ABES) · doi:10.70675/c34a0b31za5cez4274zb605z624f5fa3a8f2
In situ X-ray computed tomography for soft contact mechanics
Acito, V. (2023) · theses.fr (ABES) · doi:10.70675/6eb3544czf5adz42f1zb5a1zf077e3e11418
Dynamic monitoring of photosynthesis in light-acclimated organisms
Lahlou, A. (2023) · theses.fr (ABES) · doi:10.70675/118bdcd6z0ad5z4c05zaac3z9dbe70f4717a
Role of Rhizaria in biogeochemical Cycles in the epi- and mesopelagic ocean
Laget, M. (2023) · theses.fr (ABES) · doi:10.70675/fcf9b090z8c2bz4b40zad80zb0f46ea0ebbf
Développement de la méthode eCHORD pour la caractérisation multiéchelle d’alliages d’aluminium
Facchinetti, R. (2023) · theses.fr (ABES) · doi:10.70675/385d2c36z720bz4dd4zad61z15c711518207
Physical inference from microscopy images
Ichbiah, S. (2023) · theses.fr (ABES) · doi:10.70675/08e45a27za634z4d34zb64ez51f2cb479e82
The sources of cosmic re-ionization as seen by MUSE/VLT
Thai, T. T. (2023) · theses.fr (ABES) · doi:10.70675/f23924b1z35c3z4b11z800dz9d2040002745
Savelev, E. S. (2023) · theses.fr (ABES) · doi:10.70675/fe1655d3z1688z425fza169z82ccbeac7c5e
Programmation Génétique Cartésienne pour la Segmentation d'Images Biomédicales
Cortacero, K. (2023) · theses.fr (ABES) · doi:10.70675/79918042zfaa6z4f0az998az8effa75120a6
More environmentally friendly fishing gear through material science
Gué, L. L. (2024) · theses.fr (ABES) · doi:10.70675/3cf93d33z3665z4dc0zb099z9320fe9c1fcc
Metadata
- Authors
- van der Walt, S., Schönberger, J. L., Nunez-Iglesias, J., Boulogne, F., Warner, J. D., Yager, N., Gouillart, E., & Yu, T.
- Affiliations
- Stellenbosch University (ZA)
- University of North Carolina at Chapel Hill (US)
- Melbourne Bioinformatics (AU)
- Princeton University (US)
- Mayo Clinic (US)
- AICBT Ltd, Oxford, UK
- Centre National de la Recherche Scientifique (FR)
- Enthought (United States) (US)
- ORCID
- Venue
- PeerJ
- Publisher
- PeerJ
- Published
- 2014-06-19
- Volume
- 2
- Pages
- e453
- ISSN
- 2167-8359 (ISSN-L)
- PMC
- PMC4081273
- OpenAlex
- W2015159529
- Cited by
- 6,794
- References
- 29
- Citations by year
- 2026: 846 · 2025: 1046 · 2024: 914 · 2023: 915 · 2022: 867 · 2021: 768 · 2020: 507 · 2019: 366 · 2018: 227 · 2017: 165 · 2016: 102 · 2015: 50 · 2014: 15
- FWCI
- 110.33
- Type
- journal article
- Language
- en
- Open access
- gold
- doi.org
- Licence
- cc-by
- Locations
- PeerJ (publishedVersion, cc-by)
- PubMed Central (publishedVersion, cc-by)
- PubMed (publishedVersion)
- arXiv (Cornell University) (submittedVersion)
- Minerva Access (University of Melbourne) (submittedVersion, cc-by)
- HAL (submittedVersion, other-oa)
- DOAJ (DOAJ: Directory of Open Access Journals) (submittedVersion, cc-by-sa)
- SUNScholar (Stellenbosch University) (submittedVersion)
- arXiv (Cornell University) (cc-by)
- Funders
- National Institute of Diabetes and Digestive and Kidney Diseases (F30DK098832)
- Topics
- Physical Sciences › Computer Science › Software › Computational Physics and Python Applications
- Physical Sciences › Computer Science › Artificial Intelligence › Computer Science and Engineering
- Physical Sciences › Computer Science › Computer Vision and Pattern Recognition › Digital Image Processing Techniques
- Keywords
- scikit-image, image processing, Python library, open source software, image processing algorithms, real-world applications
About these checks
Registry, retraction, Cites and statistics results are computed, not judged, with one exception: a printed reference that no index lists is read once by a model before it counts as a citation error. Claims are extracted by a model and kept only when their quote appears verbatim in the text; each cited source is then checked, with a model’s help, for whether it says what the claim relies on. Those verdicts can be wrong — read the claim’s quote and the cited source before relying on one.
A language model drew the claims from the paper on 2026-11-18, under version 3 of the claim definition (model deepseek-v4.1-flash, prompt extract-v3).
A second model labelled each claim on 2026-11-18 (model jev-1.13-20260917, definition revision gold-guideline-v0.2).
Statistics and arithmetic are recomputed, not judged.
Confidence bands are shown only for fields calibrated on our annotated test set. None is calibrated yet, so no band is shown.
What counts as a claim ›How we measure confidence ›How we check this ›
Are you an author, or do you see a problem with this page? Request a review
Data sources
Bibliographic data: Semantic Scholar, OpenAlex, Crossref.
Contains information from the Semantic Scholar Academic Graph Datasets, made available under the ODC Attribution License (ODC-BY 1.0).
Semantic Scholar’s data is described in: Kinney, R., et al. (2023). The Semantic Scholar Open Data Platform. arXiv:2301.10140.
