

The DOI matches its Crossref record; 42 of the 43 references it cites were found in a registry or an index.
Association of the Gut Microbiota With Cognitive Function in Midlife
Open accessAbstract
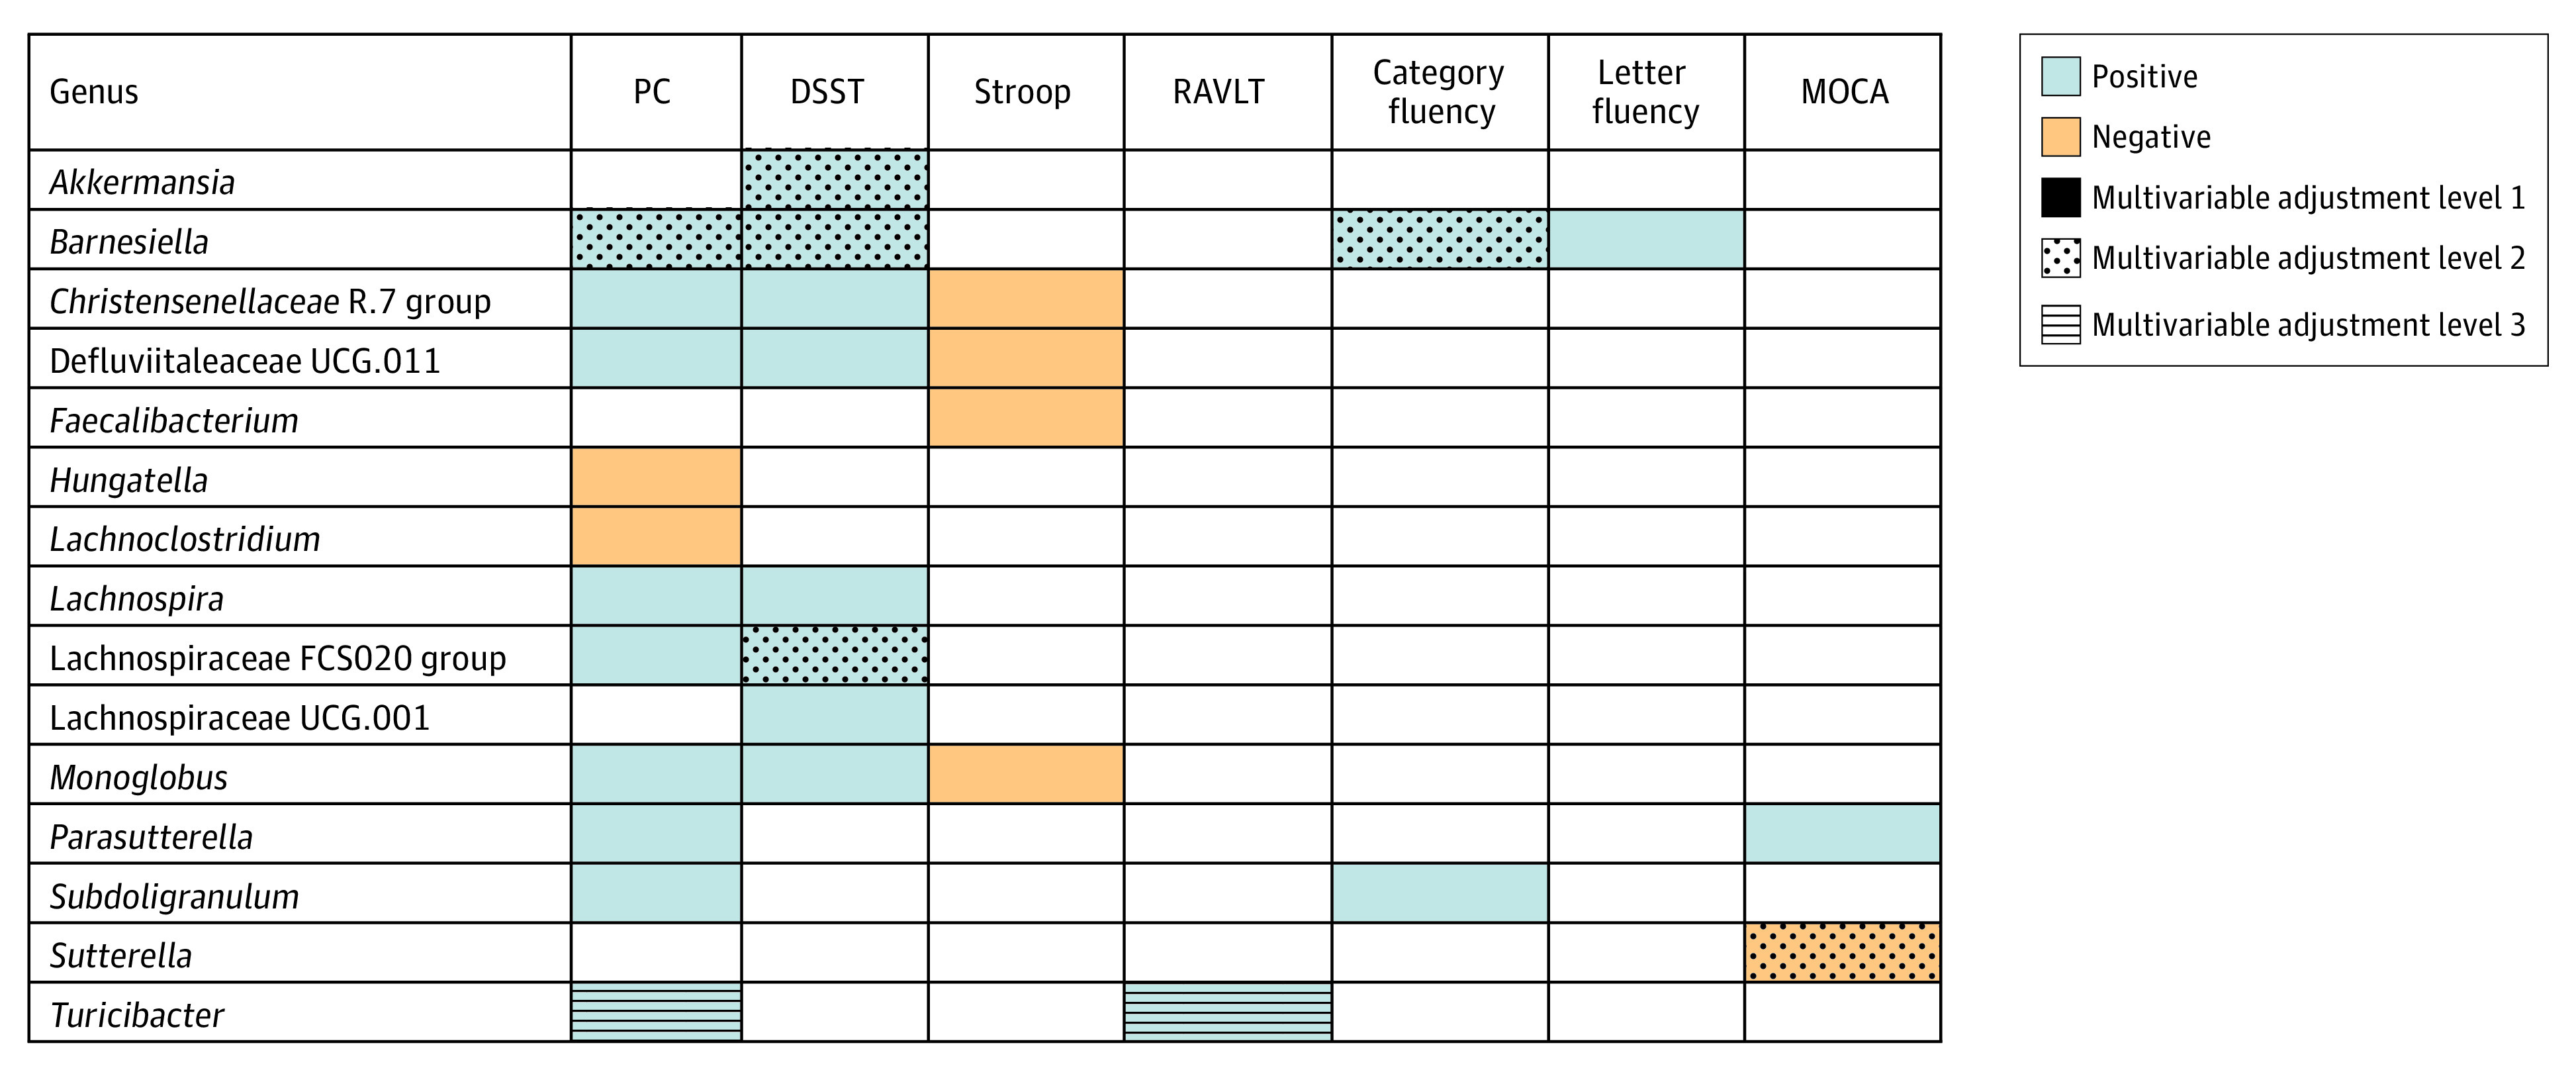
Importance: Animal experiments and small clinical studies support a role for the gut microbiota in cognitive functioning. Few studies have investigated gut microbiota and cognition in large community samples. Objective: To examine associations of gut microbial composition with measures of cognition in an established population-based study of middle-aged adults. Design, Setting, and Participants: This cross-sectional study analyzed data from the prospective Coronary Artery Risk Development in Young Adults (CARDIA) cohort in 4 US metropolitan centers between 2015 and 2016. Data were analyzed in 2019 and 2020. Exposures: Stool DNA were sequenced, and the following gut microbial measures were gathered: (1) β-diversity (between-person) derived with multivariate principal coordinates analysis; (2) α-diversity (within-person), defined as richness (genera count) and the Shannon index (integrative measure of genera richness and evenness); and (3) taxonomy (107 genera, after filtering). Main Outcomes and Measures: Cognitive status was assessed using 6 clinic-administered cognitive tests: Montreal Cognitive Assessment (MoCA), Digit Symbol Substitution Test (DSST), Rey-Auditory Verbal Learning Test (RAVLT), Stroop, category fluency, and letter fluency. A global score measure derived using principal components analysis was also assessed; the first principal component explained 56% of variability. Results: Microbiome data were available on 597 CARDIA participants; mean (SD) age was 55.2 (3.5) years, 268 participants (44.7%) were men, and 270 (45.2%) were Black. In multivariable-adjusted principal coordinates analysis, permutational multivariate analysis of variance tests for β-diversity were statistically significant for all cognition measures (principal component analysis, P = .001; MoCA, P = .001; DSST, P = .001; RAVLT, P = .001; Stroop, P = .007; category fluency, P = .001) with the exception of letter fluency (P = .07). After adjusting for sociodemographic variables (age, race, sex, education), health behaviors (physical activity, diet, smoking, medication use), and clinical covariates (body mass index, diabetes, hypertension), Barnesiella was positively associated with the first principal component (β, 0.16; 95% CI, 0.08-0.24), DSST (β, 1.18; 95% CI, 0.35-2.00), and category fluency (β, 0.59; 95% CI, 0.31-0.87); Lachnospiraceae FCS020 group was positively associated with DSST (β, 2.67; 95% CI, 1.10-4.23), and Sutterella was negatively associated with MoCA (β, -0.27; 95% CI, -0.44 to -0.11). Conclusions and Relevance: In this cross-sectional study, microbial community composition, based on β-diversity, was associated with all cognitive measures in multivariable-adjusted analysis. These data contribute to a growing body of literature suggesting that the gut microbiota may be associated with cognitive aging, but must be replicated in larger samples and further researched to identify relevant pathways.
Overview
The claims and statistics of this paper haven’t been checked yet.
Run the check — free, no account needed. It reads the open-access text and checks the sources it cites.
Integrity signals
Registry
Cites
Statistics
Figures
Verification
Claims the paper makes
The claims and statistics of this paper haven’t been checked yet.
Run the check — free, no account needed. It reads the open-access text and checks the sources it cites.
Claims other papers make about this one
Each is checked against this paper’s own text: does it say what the citing paper says it does?
In the citing paper
“Confirming the role of the GM in cognitive function in midlife, Meyer et al. explored the relationship between gut microbial community composition and cognitive function in 597 middle-aged adults, and found a significant positive association between β-diversity and all higher cognitive functions tested (89).”
From Signalling cognition: The gut microbiota and hypothalamic-pituitary-adrenal axis (2023) · cites this paper as [89]
Self-check
Percentages, sums and reported differences re-computed from the paper’s own numbers.
The self-check needs the paper’s full text.
Citations
Cites
Controlling the False Discovery Rate: A Practical and Powerful Approach to Multiple Testing
Benjamini, Y., & Hochberg, Y. (1995) · Journal of the Royal Statistical Society Series B: Statistical Methodology · doi:10.1111/j.2517-6161.1995.tb02031.x · Cited by 109,482
DADA2: High–resolution sample inference from Illumina amplicon data
Callahan, B. J., McMurdie, P. J., Rosen, M. J., Han, A. W., Johnson, A. J. A., & Holmes, S. P. (2016) · Nature Methods · doi:10.1038/nmeth.3869 · Cited by 35,698
The SILVA ribosomal RNA gene database project: improved data processing and web-based tools
Quast, C., Pruesse, E., Yilmaz, P., Gerken, J., Schweer, T., Yarza, P., Peplies, J., & Glöckner, F. O. (2012) · Nucleic Acids Research · doi:10.1093/nar/gks1219 · Cited by 33,055
Cross-talk between Akkermansia muciniphila and intestinal epithelium controls diet-induced obesity
Everard, A., Belzer, C., Geurts, L., Ouwerkerk, J. P., Druart, C., Bindels, L. B., Guiot, Y., Derrien, M., Muccioli, G. G., Delzenne, N. M., et al. (2013) · Proceedings of the National Academy of Sciences · doi:10.1073/pnas.1219451110 · Cited by 4,511
The role of short-chain fatty acids in microbiota–gut–brain communication
Dalile, B., Van Oudenhove, L., Vervliet, B., & Verbeke, K. (2019) · Nature Reviews Gastroenterology & Hepatology · doi:10.1038/s41575-019-0157-3 · Cited by 3,357
Population-level analysis of gut microbiome variation
Falony, G., Joossens, M., Vieira-Silva, S., Wang, J., Darzi, Y., Faust, K., Kurilshikov, A., Bonder, M. J., Valles-Colomer, M., Vandeputte, D., et al. (2016) · Science · doi:10.1126/science.aad3503 · Cited by 2,400
The Measurement of Species Diversity
Peet, R. (1974) · Annual Review of Ecology and Systematics · doi:10.1146/annurev.es.05.110174.001441 · Cited by 2,399
Dao, M. C., Everard, A., Aron-Wisnewsky, J., Sokolovska, N., Prifti, E., Verger, E. O., Kayser, B. D., Levenez, F., Chilloux, J., Hoyles, L., et al. (2016) · Gut · doi:10.1136/gutjnl-2014-308778 · Cited by 1,931
Cardia: study design, recruitment, and some characteristics of the examined subjects
FRIEDMAN, G. D., Cutter, G., Donahue, R. P., Hughes, G. H., Hulley, S. B., Jacobs, D. R., Liu, K., & Savage, P. J. (1988) · Journal of Clinical Epidemiology · doi:10.1016/0895-4356(88)90080-7 · Cited by 1,689
Compositional dissimilarity as a robust measure of ecological distance
Faith, D. P., Minchin, P. R., & Belbin, L. (1987) · Plant Ecology · doi:10.1007/bf00038687 · Cited by 1,586
Cited by
Sorted by citations
Items 101–110 of 110
Liu, W., Liu, H., Wang, Y., Zhao, Z., Balasubramanian, B., & Jha, R. (2023) · Figshare · doi:10.6084/m9.figshare.24277131
Liu, W., Liu, H., Wang, Y., Zhao, Z., Balasubramanian, B., & Jha, R. (2024) · Figshare · doi:10.6084/m9.figshare.24277232
Gong, X., Chen, Y., Chen, Y., Chen, Z., & Zhang, X. (2026) · Food Reviews International · doi:10.1080/87559129.2026.2645924
Wang, Y., Ren, C., Dong, W., Li, Q., Deng, F., Zhao, F., Cheng, Y., Sun, P., Li, H., & Wang, Y. (2026) · Chinese Medicine · doi:10.1186/s13020-026-01436-7
Gut microbiota and brain health: Disease-specific pathways and emerging therapeutic strategies
Oriquat, G., Rizaev, J., Abdulqader, A. F., Kadhim, A. A., Jamuna, K. V., Singhal, D. K., Bainsal, N., & Mansurova, N. (2026) · Multiple Sclerosis and Related Disorders · doi:10.1016/j.msard.2026.107407
Dietary factors and cognitive aging: Mapping epidemiological evidence and the role of gut microbiota
Chen, H., Shen, J., Liu, X., Ni, J., Rong, S., Zheng, J.-S., Xu, W., Huang, G., Luo, B., Zheng, Y., et al. (2026) · The Innovation Nutrition · doi:10.59717/j.xinn-nutri.2026.100030 · Cited by 1
Varpaei, H. A., Quan, S. F., Robbins, L. B., Mowbray, F., Reeves, M. J., Karve, M. M., Gao, L., & Deka, P. (2026) · Medicina · doi:10.3390/medicina62091643
Matcha (Japanese ground green tea) and cognitive function
Lange, K. W., & NAKAMURA, Y. (2026) · Journal of Food Bioactives · doi:10.26599/jfb.2026.95035451
Oral Microbiota Associated With Parkinson'S Disease: A Systematic Review
Abreu, M. D. S., de Morais, R. P. L., Pereira, T. F., Sales, P. H. D. H., Leão, J. C., & Carvalho, A. D. A. T. (2026) · Special Care in Dentistry · doi:10.1111/scd.70272
Metadata
- Authors
- Meyer, K., Lulla, A., Debroy, K., Shikany, J. M., Yaffe, K., Meirelles, O., & Launer, L. J.
- Affiliations
- University of North Carolina at Chapel Hill (US)
- National Institutes of Health (US)
- University of Alabama at Birmingham (US)
- University of California, San Francisco (US)
- Corresponding author
- Meyer, Katie
- Venue
- JAMA Network Open
- Publisher
- American Medical Association (AMA)
- Published
- 2022-02-08
- Volume
- 5
- Issue
- 2
- Pages
- e2143941
- ISSN
- 2574-3805 (ISSN-L)
- PMC
- PMC8826173
- OpenAlex
- W4210905338
- Cited by
- 110
- References
- 43
- Citations by year
- 2026: 15 · 2025: 22 · 2024: 35 · 2023: 25 · 2022: 13
- FWCI
- 7.75
- Type
- journal article
- Language
- en
- Open access
- gold
- doi.org
- Licence
- cc-by
- Locations
- JAMA Network Open (publishedVersion, cc-by)
- PubMed Central (publishedVersion, cc-by)
- PubMed (publishedVersion)
- Funders
- National Institute on Aging (R01AG063887, R35AG071916)
- National Heart, Lung, and Blood Institute (K01HL127159)
- Topics
- Life Sciences › Biochemistry, Genetics and Molecular Biology › Molecular Biology › Gut microbiota and health
- Health Sciences › Medicine › Psychiatry and Mental health › Dementia and Cognitive Impairment Research
- Health Sciences › Medicine › Public Health, Environmental and Occupational Health › Nutritional Studies and Diet
- Keywords
- gut microbiota, cognitive function, middle-aged adults, beta diversity, alpha diversity, Barnesiella, Prevotella, executive function, memory, CARDIA cohort, health behavior, sociodemographic factors, racial and ethnic differences, sex differences, physical activity, diet, smoking, body mass index, diabetes mellitus, hypertension
- MeSH terms
- Gastrointestinal Microbiome, Race Factors, Age Factors, Aging, Alabama, Black or African American, California, Chicago, Cognition, Cross-Sectional Studies, Female, Humans, Longitudinal Studies, Male, Middle Aged, Minnesota, Prospective Studies, Risk Factors, Socioeconomic Factors, Cohort Studies, White People
About these checks
Registry, retraction, Cites and statistics results are computed, not judged, with one exception: a printed reference that no index lists is read once by a model before it counts as a citation error. Claims are extracted by a model and kept only when their quote appears verbatim in the text; each cited source is then checked, with a model’s help, for whether it says what the claim relies on. Those verdicts can be wrong — read the claim’s quote and the cited source before relying on one.
Statistics and arithmetic are recomputed, not judged.
Confidence bands are shown only for fields calibrated on our annotated test set. None is calibrated yet, so no band is shown.
What counts as a claim ›How we measure confidence ›How we check this ›
Are you an author, or do you see a problem with this page? Request a review
