

The DOI matches its Crossref record; 44 of the 45 references it cites were found in a registry or an index.
Stable Decoding from a Speech BCI Enables Control for an Individual with ALS without Recalibration for 3 Months
Open accessAbstract
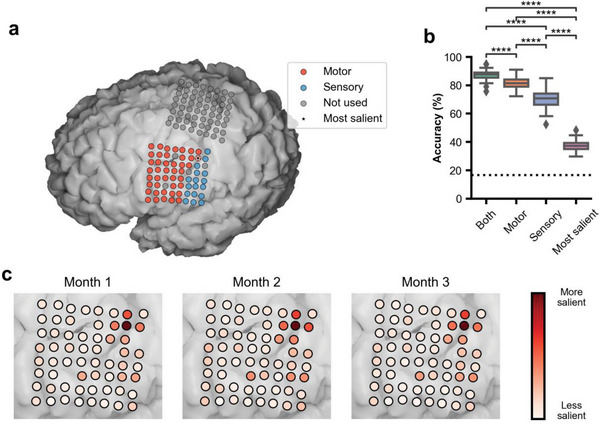
Brain‐computer interfaces (BCIs) can be used to control assistive devices by patients with neurological disorders like amyotrophic lateral sclerosis (ALS) that limit speech and movement. For assistive control, it is desirable for BCI systems to be accurate and reliable, preferably with minimal setup time. In this study, a participant with severe dysarthria due to ALS operates computer applications with six intuitive speech commands via a chronic electrocorticographic (ECoG) implant over the ventral sensorimotor cortex. Speech commands are accurately detected and decoded (median accuracy: 90.59%) throughout a 3‐month study period without model retraining or recalibration. Use of the BCI does not require exogenous timing cues, enabling the participant to issue self‐paced commands at will. These results demonstrate that a chronically implanted ECoG‐based speech BCI can reliably control assistive devices over long time periods with only initial model training and calibration, supporting the feasibility of unassisted home use.
Overview
The claims and statistics of this paper haven’t been checked yet.
Free: it reads the open-access text and checks the first 5 claims that cite a source we can check. Create a free account to check every claim.
Integrity signals
Registry
Cites
Statistics
Figures



Verification
Claims the paper makes
The claims and statistics of this paper haven’t been checked yet.
Free: it reads the open-access text and checks the first 5 claims that cite a source we can check. Create a free account to check every claim.
Claims other papers make about this one
Each is checked against this paper’s own text: does it say what the citing paper says it does?
The source backs part of the claim, not all of it — or backs it for a different population, condition or comparison.
In the citing paper
“Given that most early studies in individuals with vocal-tract paralysis involve only single participants12–16,64,95,120, great care is needed when comparing results, as the broad spectrum of disease presentations is not sampled”
From The speech neuroprosthesis (2024) · cites this paper as [95]
Experimental — accuracy not yet measuredThe cited source says what the claim attributes to it.
In the citing paper
“Despite this, durable stability has enabled ECoG-based neuroprostheses without the need for daily calibration by the user12,14,94,95.”
From The speech neuroprosthesis (2024) · cites this paper as [95]
The cited source says what the claim attributes to it.
In the citing paper
“Several groups have performed real-time braincomputer interface studies to restore lost speech using implanted electrocorticography (ECoG) 17-20 , including a report published in the Journal 17 , or intracortical multielectrode arrays 21 .”
From An Accurate and Rapidly Calibrating Speech Neuroprosthesis (2024) · cites this paper as [20]
Self-check
Percentages, sums and reported differences re-computed from the paper’s own numbers.
The self-check needs the paper’s full text.
Citations
Cites
Adam: A Method for Stochastic Optimization
Kingma, D. P., & Ba, J. (2014) · arXiv · doi:10.48550/arxiv.1412.6980 · Cited by 98,946
Fischl, B. (2012) · NeuroImage · doi:10.1016/j.neuroimage.2012.01.021 · Cited by 9,526
Brain–computer interfaces for communication and control
Wolpaw, J. R., Birbaumer, N., McFarland, D. J., Pfurtscheller, G., & Vaughan, T. M. (2002) · Clinical Neurophysiology · doi:10.1016/s1388-2457(02)00057-3 · Cited by 7,927
The origin of extracellular fields and currents — EEG, ECoG, LFP and spikes
Buzsáki, G., Anastassiou, C. A., & Koch, C. (2012) · Nature Reviews Neuroscience · doi:10.1038/nrn3241 · Cited by 4,225
BCI2000: A General-Purpose Brain-Computer Interface (BCI) System
Schalk, G., McFarland, D. J., Hinterberger, T., Birbaumer, N., & Wolpaw, J. R. (2004) · IEEE Transactions on Biomedical Engineering · doi:10.1109/tbme.2004.827072 · Cited by 3,024
Inceptiontime: finding alexnet for time series classification
Ismail Fawaz, H., Lucas, B., Forestier, G., Pelletier, C., Schmidt, D. F., Weber, J., Webb, G. I., Idoumghar, L., Muller, P.-A., & Petitjean, F. (2020) · Data Mining and Knowledge Discovery · doi:10.1007/s10618-020-00710-y · Cited by 1,788
Crone, N. (1998) · Brain · doi:10.1093/brain/121.12.2301 · Cited by 1,044
Self-citationHigh-performance brain-to-text communication via handwriting
Willett, F. R., Avansino, D. T., Hochberg, L. R., Henderson, J. M., & Shenoy, K. V. (2021) · Nature · doi:10.1038/s41586-021-03506-2 · Cited by 1,024
Speech synthesis from neural decoding of spoken sentences
Anumanchipalli, G. K., Chartier, J., & Chang, E. F. (2019) · Nature · doi:10.1038/s41586-019-1119-1 · Cited by 883
Ray, S., Crone, N. E., Niebur, E., Franaszczuk, P. J., & Hsiao, S. S. (2008) · The Journal of Neuroscience · doi:10.1523/jneurosci.2848-08.2008 · Cited by 722
Self-citation
Research works printed but not linked: 5
- Herff C., 2015, Front. Neurosci., 8, 217
- K.Simonyan A.Vedaldi A.Zisserman presented atProc. of the Int. Conf. on Learning Representations (ICLR) Banff Canada April2014.
- Chao Z., 2010, Front. Neuroeng., 3, 3
- C.Szegedy W.Liu Y.Jia P.Sermanet S.Reed D.Anguelov D.Erhan V.Vanhoucke A.Rabinovich presented atIEEE Conf. on Computer Vision and Pattern Recognition (CVPR) Boston Massachusetts USA June2015.
- P.Hintjens O'Reilly Media Inc. Sebastopol CA 2013.
Cited by
An Accurate and Rapidly Calibrating Speech Neuroprosthesis
Card, N. S., Wairagkar, M., Iacobacci, C., Hou, X., Singer-Clark, T., Willett, F. R., Kunz, E. M., Fan, C., Vahdati Nia, M., Deo, D. R., et al. (2024) · New England Journal of Medicine · doi:10.1056/nejmoa2314132 · Cited by 268
Brain–computer interfaces: the innovative key to unlocking neurological conditions
Zhang, H., Jiao, L., Yang, S., Li, H., Jiang, X., Feng, J., Zou, S., Xu, Q., Gu, J., Wang, X., et al. (2024) · International Journal of Surgery · doi:10.1097/js9.0000000000002022 · Cited by 169
The state of clinical trials of implantable brain–computer interfaces
Patrick-Krueger, K. M., Burkhart, I., & Contreras-Vidal, J. L. (2024) · Nature Reviews Bioengineering · doi:10.1038/s44222-024-00239-5 · Cited by 125
Silva, A. B., Littlejohn, K. T., Liu, J. R., Moses, D. A., & Chang, E. F. (2024) · Nature Reviews Neuroscience · doi:10.1038/s41583-024-00819-9 · Cited by 103
“Despite this, durable stability has enabled ECoG-based neuroprostheses without the need for daily calibration by the user 12,14,94,95 .”
Angrick, M., Luo, S., Rabbani, Q., Candrea, D. N., Shah, S., Milsap, G., Anderson, W. S., Gordon, C. R., Rosenblatt, K. R., Clawson, L., et al. (2024) · Scientific Reports · doi:10.1038/s41598-024-60277-2 · Cited by 115
Self-citation
Metadata
- Authors
- Luo, S., Angrick, M., Coogan, C., Candrea, D. N., Wyse‐Sookoo, K., Shah, S., Rabbani, Q., Milsap, G. W., Weiss, A. R., Anderson, W. S., Tippett, D. C., Maragakis, N. J., Clawson, L. L., Vansteensel, M. J., Wester, B. A., Tenore, F. V., Hermansky, H., Fifer, M. S., Ramsey, N. F., & Crone, N. E.
- Affiliations
- Johns Hopkins University (US)
- University Medical Center Utrecht (NL)
- Department of Electrical and Computer Engineering Johns Hopkins University Baltimore MD 21218 USA
- Corresponding author
- Crone, Nathan E.
- ORCID
- Luo, Shiyu
- Angrick, Miguel
- Coogan, Christopher
- Candrea, Daniel N.
- Wyse‐Sookoo, Kimberley
- Shah, Samyak
- Rabbani, Qinwan
- Milsap, Griffin W.
- Weiss, Alexander R.
- Anderson, William S.
- Tippett, Donna C.
- Maragakis, Nicholas J.
- Clawson, Lora L.
- Vansteensel, Mariska J.
- Wester, Brock A.
- Tenore, Francesco V.
- Fifer, Matthew S.
- Ramsey, Nick F.
- Crone, Nathan E.
- Venue
- Advanced Science
- Publisher
- Wiley
- Published
- 2023-10-24
- Volume
- 10
- Issue
- 35
- Pages
- e2304853-e2304853
- ISSN
- 2198-3844 (ISSN-L)
- PMC
- PMC10724434
- OpenAlex
- W4387897958
- Cited by
- 90
- References
- 45
- Citations by year
- 2026: 23 · 2025: 44 · 2024: 22 · 2023: 1
- FWCI
- 13.48
- Type
- journal article
- Language
- en
- Open access
- gold
- doi.org
- Licence
- Locations
- Advanced Science (publishedVersion, cc-by)
- PubMed Central (publishedVersion, cc-by)
- PubMed (publishedVersion)
- DOAJ (DOAJ: Directory of Open Access Journals) (submittedVersion, cc-by-sa)
- Utrecht University Repository (Utrecht University) (submittedVersion, other-oa)
- Funders
- National Institute on Deafness and Other Communication Disorders (U01DC016686)
- National Institute of Neurological Disorders and Stroke (UH3NS114439)
- Topics
- Life Sciences › Neuroscience › Cognitive Neuroscience › EEG and Brain-Computer Interfaces
- Life Sciences › Neuroscience › Cellular and Molecular Neuroscience › Neuroscience and Neural Engineering
- Physical Sciences › Computer Science › Human-Computer Interaction › Gaze Tracking and Assistive Technology
- Keywords
- amyotrophic lateral sclerosis, electrocorticography, assistive technology, model recalibration, dysarthria
- MeSH terms
- Electrocorticography, Amyotrophic Lateral Sclerosis, Humans, Speech, Brain-Computer Interfaces
About these checks
Registry, retraction, Cites and statistics results are computed, not judged, with one exception: a printed reference that no index lists is read once by a model before it counts as a citation error. Claims are extracted by a model and kept only when their quote appears verbatim in the text; each cited source is then checked, with a model’s help, for whether it says what the claim relies on. Those verdicts can be wrong — read the claim’s quote and the cited source before relying on one.
Statistics and arithmetic are recomputed, not judged.
Confidence bands are shown only for fields calibrated on our annotated test set. None is calibrated yet, so no band is shown.
What counts as a claim ›How we measure confidence ›How we check this ›
Are you an author, or do you see a problem with this page? Request a review
How to cite
Cite CoChat for the checks on this page, and the paper for its own findings.
- This page
- CoChat. (2026). Citation check: Stable Decoding from a Speech BCI Enables Control for an Individual with ALS without Recalibration for 3 Months. https://app.cochat.ai/papers/10.1002/advs.202304853
- The paper
- Luo, S., Angrick, M., Coogan, C., Candrea, D. N., Wyse‐Sookoo, K., Shah, S., Rabbani, Q., Milsap, G. W., Weiss, A. R., Anderson, W. S., Tippett, D. C., Maragakis, N. J., Clawson, L. L., Vansteensel, M. J., Wester, B. A., Tenore, F. V., Hermansky, H., Fifer, M. S., Ramsey, N. F., & Crone, N. E. (2023). Stable Decoding from a Speech BCI Enables Control for an Individual with ALS without Recalibration for 3 Months. Advanced Science. https://doi.org/10.1002/advs.202304853
Data sources
Bibliographic data: Semantic Scholar, OpenAlex, Crossref.
Contains information from the Semantic Scholar Academic Graph Datasets, made available under the ODC Attribution License (ODC-BY 1.0).
Semantic Scholar’s data is described in: Kinney, R., et al. (2023). The Semantic Scholar Open Data Platform. arXiv:2301.10140.
