

The DOI matches its Crossref record; 93 of the 94 references it cites were found in a registry or an index.
Missing data: A statistical framework for practice
Open accessAbstract
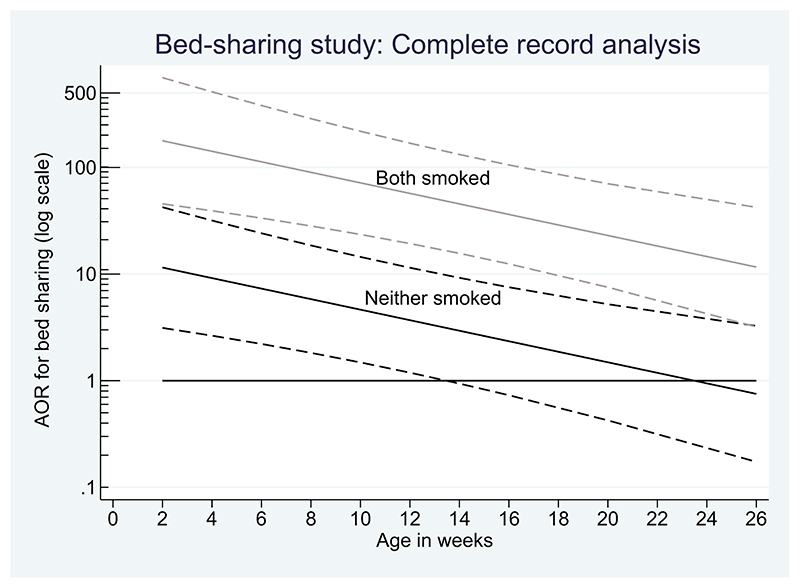
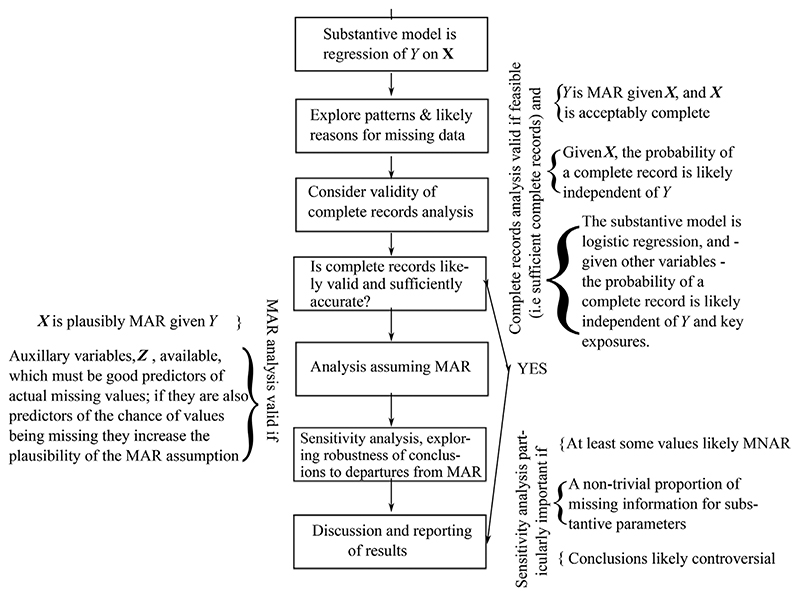
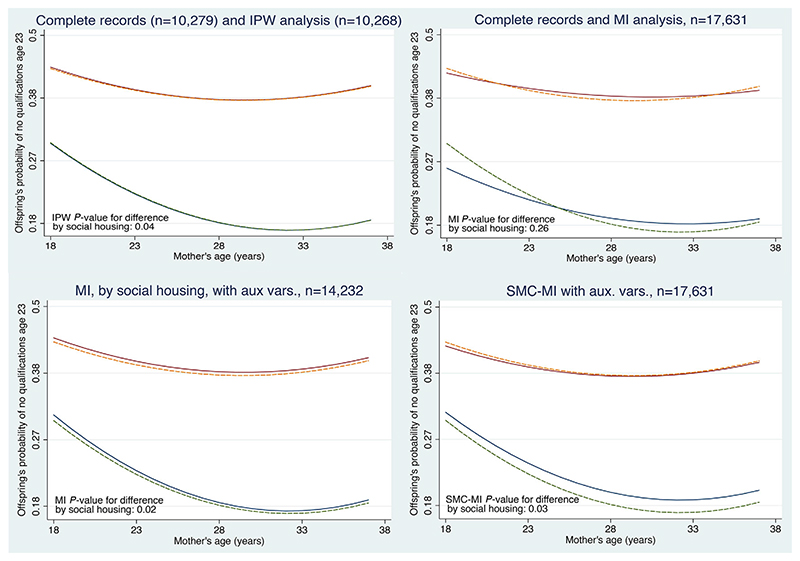
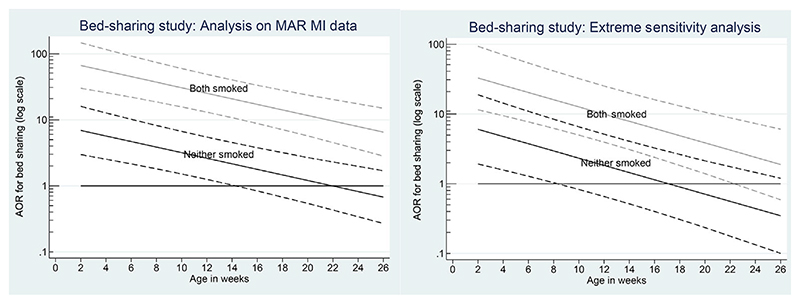
Missing data are ubiquitous in medical research, yet there is still uncertainty over when restricting to the complete records is likely to be acceptable, when more complex methods (e.g. maximum likelihood, multiple imputation and Bayesian methods) should be used, how they relate to each other and the role of sensitivity analysis. This article seeks to address both applied practitioners and researchers interested in a more formal explanation of some of the results. For practitioners, the framework, illustrative examples and code should equip them with a practical approach to address the issues raised by missing data (particularly using multiple imputation), alongside an overview of how the various approaches in the literature relate. In particular, we describe how multiple imputation can be readily used for sensitivity analyses, which are still infrequently performed. For those interested in more formal derivations, we give outline arguments for key results, use simple examples to show how methods relate, and references for full details. The ideas are illustrated with a cohort study, a multi‐centre case control study and a randomised clinical trial.
Overview
The claims and statistics of this paper haven’t been checked yet.
Run the check — free, no account needed. It reads the open-access text and checks the sources it cites.
Integrity signals
Registry
Cites
Statistics
Figures
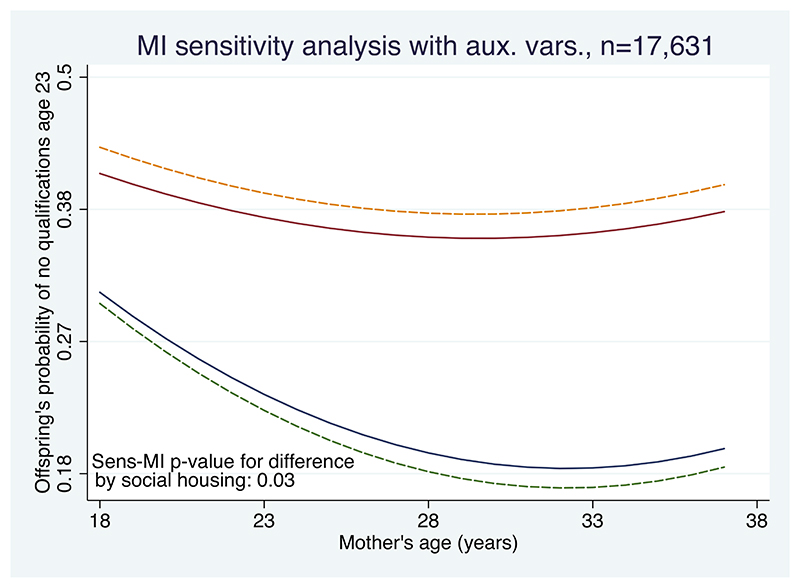
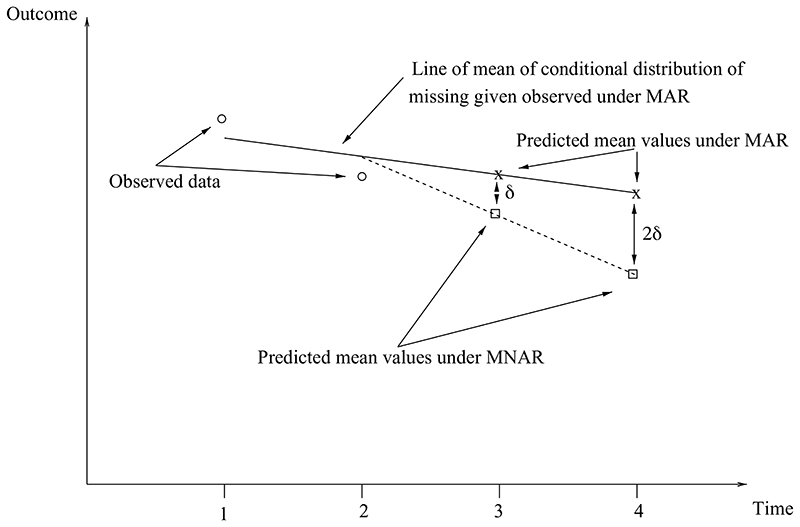
Verification
Claims the paper makes
The claims and statistics of this paper haven’t been checked yet.
Run the check — free, no account needed. It reads the open-access text and checks the sources it cites.
Claims other papers make about this one
Each is checked against this paper’s own text: does it say what the citing paper says it does?
The source backs part of the claim, not all of it — or backs it for a different population, condition or comparison.
In the citing paper
“MI assumes data are missing at random (MAR), but missingness in loneliness and anxiety/depression was likely due to participants experiencing these conditions, making MI unreliable [111].”
From The prospective association of adolescent loneliness and low resilience with anxiety and depression in young adulthood: The HUNT study (2025) · cites this paper as [111]
Experimental — accuracy not yet measuredThe source backs part of the claim, not all of it — or backs it for a different population, condition or comparison.
In the citing paper
“Weighting does not fully remove bias when missingness relates to the outcome [111].”
From The prospective association of adolescent loneliness and low resilience with anxiety and depression in young adulthood: The HUNT study (2025) · cites this paper as [111]
Experimental — accuracy not yet measured
Self-check
Percentages, sums and reported differences re-computed from the paper’s own numbers.
The self-check needs the paper’s full text.
Citations
Cites
Maximum Likelihood from Incomplete Data Via the EM Algorithm
Dempster, A. P., Laird, N. M., & Rubin, D. B. (1977) · Journal of the Royal Statistical Society Series B: Statistical Methodology · doi:10.1111/j.2517-6161.1977.tb01600.x · Cited by 50,444
Multiple Imputation for Nonresponse in Surveys
Rubin, D. B. (1987) · Wiley Series in Probability and Statistics · doi:10.1002/9780470316696 · Cited by 20,701
Statistical Analysis With Missing Data
Lahiff, M., Little, R. J. A., & Rubin, D. B. (1989) · Journal of the American Statistical Association · doi:10.2307/2289883 · Cited by 17,385
CONSORT 2010 Statement: updated guidelines for reporting parallel group randomised trials
the CONSORT Group, Schulz, K. F., Altman, D. G., & Moher, D. (2010) · BMC Medicine · doi:10.1186/1741-7015-8-18 · Cited by 13,371
RUBIN, D. B. (1976) · Biometrika · doi:10.1093/biomet/63.3.581 · Cited by 9,925
CONSORT 2010 Statement: updated guidelines for reporting parallel group randomised trials
Schulz, K. F., Altman, D. G., Moher, D., & for the CONSORT Group (2010) · BMJ · doi:10.1136/bmj.c332 · Cited by 9,329
Statistical Analysis with Missing Data
Little, R. J. A., & Rubin, D. B. (2002) · Wiley Series in Probability and Statistics · doi:10.1002/9781119013563 · Cited by 8,473
Sterne, J. A. C., White, I. R., Carlin, J. B., Spratt, M., Royston, P., Kenward, M. G., Wood, A. M., & Carpenter, J. R. (2009) · BMJ · doi:10.1136/bmj.b2393 · Cited by 7,299
Self-citationAnalysis of Incomplete Multivariate Data
Schafer, J. L. (1997) · doi:10.1201/9781439821862 · Cited by 6,012
Analysis of Incomplete Multivariate Data
Booth, D. E., & Schafer, J. L. (2000) · Technometrics · doi:10.2307/1271466 · Cited by 5,627
A generalization of sampling without replacement from a finite universe
Horvitz, D. G., & Thompson, D. J. (1952) · Journal of the American Statistical Association · doi:10.1080/01621459.1952.10483446 · Cited by 4,293
Multiple imputation of discrete and continuous data by fully conditional specification
van Buuren, S. (2007) · Statistical Methods in Medical Research · doi:10.1177/0962280206074463 · Cited by 2,827
A comparison of inclusive and restrictive strategies in modern missing data procedures.
Collins, L. M., Schafer, J. L., & Kam, C.-M. (2001) · Psychological Methods · doi:10.1037/1082-989x.6.4.330 · Cited by 2,389
Flexible Imputation of Missing Data, Second Edition
van Buuren, S. (2018) · doi:10.1201/9780429492259 · Cited by 2,273
Finding the Observed Information Matrix When Using the EM Algorithm
Louis, T. A. (1982) · Journal of the Royal Statistical Society Series B (Statistical Methodology) · doi:10.1111/j.2517-6161.1982.tb01203.x · Cited by 2,234
Statistical Analysis with Missing Data, Third Edition
Little, R. J. A., & Rubin, D. B. (2019) · Wiley series in probability and statistics · doi:10.1002/9781119482260 · Cited by 2,089
A multivariate technique for multiply imputing missing values using a sequence of regression models
Raghunathan, T. E., Lepkowski, J. M., Hoewyk, J. V., & Solenberger, P. W. (2001) · Survey methodology · Cited by 1,981
The prevention and treatment of missing data in clinical trials
Little, R. J., D'Agostino, R., Cohen, M. L., Dickersin, K., Emerson, S. S., Farrar, J. T., Frangakis, C., Hogan, J. W., Molenberghs, G., Murphy, S. A., et al. (2012) · New England Journal of Medicine · doi:10.1056/nejmsr1203730 · Cited by 1,884
Analysis of Semiparametric Regression Models for Repeated Outcomes in the Presence of Missing Data
Robins, J. M., Rotnitzky, A. G., & Zhao, L. P. (1995) · Journal of the American Statistical Association · doi:10.1080/01621459.1995.10476493 · Cited by 1,597
Principal Stratification in Causal Inference
Frangakis, C., & Rubin, D. B. (2002) · Biometrics · doi:10.1111/j.0006-341x.2002.00021.x · Cited by 1,543
Applications of Mathematics to Medical Problems
M'kendrick, A. G. (1925) · Proceedings of the Edinburgh Mathematical Society · doi:10.1017/s0013091500034428 · Cited by 1,191
Adjusting for Nonignorable Drop-Out Using Semiparametric Nonresponse Models
Scharfstein, D. O., Rotnitzky, A. G., & Robins, J. M. (1999) · Journal of the American Statistical Association · doi:10.1080/01621459.1999.10473862 · Cited by 1,049
Multiple Imputation and its Application
Carpenter, J. R., & Kenward, M. G. (2013) · doi:10.1002/9781119942283 · Cited by 913
Self-citationShah, A. D., Bartlett, J. W., Carpenter, J. R., Nicholas, O., & Hemingway, H. (2014) · American Journal of Epidemiology · doi:10.1093/aje/kwt312 · Cited by 856
Self-citationGeneralized Multilevel Structural Equation Modeling
Rabe‐Hesketh, S., Skrondal, A., & Pickles, A. R. (2004) · Psychometrika · doi:10.1007/bf02295939 · Cited by 833
Multiple-Imputation Inferences with Uncongenial Sources of Input
Meng, X. (1994) · Statistical Science · doi:10.1214/ss/1177010269 · Cited by 761
Wood, A., White, I. R., & Thompson, S. G. (2004) · Clinical Trials · doi:10.1191/1740774504cn032oa · Cited by 559
Bayesian inference for causal effects in randomized experiments with noncompliance
Imbens, G. W., & Rubin, D. B. (1997) · The Annals of Statistics · doi:10.1214/aos/1034276631 · Cited by 538
Bartlett, J. W., Seaman, S. R., White, I. R., Carpenter, J. R., & Initiative, A. D. N. (2014) · Statistical Methods in Medical Research · doi:10.1177/0962280214521348 · Cited by 508
Self-citationEpidemiology and reporting of randomised trials published in PubMed journals
Chan, A.-W., & Altman, D. G. (2005) · The Lancet · doi:10.1016/s0140-6736(05)71879-1 · Cited by 474
The Prevention and Treatment of Missing Data in Clinical Trials
National Research Council (2010) · National Academies Press eBooks · doi:10.17226/12955 · Cited by 456
A MISSING INFORMATION PRINCIPLE: THEORY AND APPLICATIONS
Orchard, T., & Woodbury, M. A. (1972) · University of California Press eBooks · doi:10.1525/9780520325883-036 · Cited by 451
Lee, K. J., Tilling, K. M., Cornish, R., Little, R. J. A., Bell, M. L., Goetghebeur, E. J. T., Hogan, J. W., & Carpenter, J. R. (2021) · Journal of Clinical Epidemiology · doi:10.1016/j.jclinepi.2021.01.008 · Cited by 408
Self-citationREALCOM-IMPUTESoftware for Multilevel Multiple Imputation with Mixed Response Types
Carpenter, J. R., Goldstein, H., & Kenward, M. G. (2011) · Journal of Statistical Software · doi:10.18637/jss.v045.i05 · Cited by 406
Self-citationHandling missing data in RCTs; a review of the top medical journals
Bell, M. L., Fiero, M., Horton, N. J., & Hsu, C.-H. (2014) · BMC Medical Research Methodology · doi:10.1186/1471-2288-14-118 · Cited by 395
Strategies for multiple imputation in longitudinal studies.
Spratt, M., Carpenter, J., Sterne, J., Carlin, J., Heron, J., Henderson, J., & Tilling, K. (2010) · American Journal of Epidemiology · doi:10.1093/aje/kwq137 · Cited by 395
Self-citationHOW TO IMPUTE INTERACTIONS, SQUARES, AND OTHER TRANSFORMED VARIABLES
von Hippel, P. V. (2009) · Sociological Methodology · doi:10.1111/j.1467-9531.2009.01215.x · Cited by 383
Intent-to-Treat Analysis for Longitudinal Studies with Drop-Outs
Little, R. J. A., & Yau, L. (1996) · Biometrics · doi:10.2307/2532847 · Cited by 380
Performing likelihood ratio tests with multiply-imputed data sets
Meng, X., & Rubin, D. B. (1992) · Biometrika · doi:10.1093/biomet/79.1.103 · Cited by 357
Handbook of Missing Data Methodology
Molenberghs, G., Fitzmaurice, G. M., Kenward, M. G., Tsiatis, A. A., & Verbeke, G. N. (2014) · Chapman & Hall/CRC eBooks · doi:10.1201/b17622 · Cited by 354
Combining Multiple Imputation and Inverse‐Probability Weighting
Seaman, S. R., White, I. R., Copas, A. J., & Li, L. (2011) · Biometrics · doi:10.1111/j.1541-0420.2011.01666.x · Cited by 308
Carpenter, J. R., Roger, J. H., & Kenward, M. G. (2013) · Journal of Biopharmaceutical Statistics · doi:10.1080/10543406.2013.834911 · Cited by 286
Self-citationLeyrat, C., Seaman, S. R., White, I. R., Douglas, I., Smeeth, L. L., Kim, J., Resche‐Rigon, M., Carpenter, J. R., & Williamson, E. (2017) · Statistical Methods in Medical Research · doi:10.1177/0962280217713032 · Cited by 271
Self-citationCarpenter, R. G., McGarvey, C., Mitchell, E. A., Tappin, D. M., Vennemann, M. M., Smuk, M., & Carpenter, J. R. (2013) · BMJ Open · doi:10.1136/bmjopen-2012-002299 · Cited by 268
Self-citationLi, K. H., Raghunathan, T. E., & Rubin, D. B. (1991) · Journal of the American Statistical Association · doi:10.1080/01621459.1991.10475152 · Cited by 246
The Multiple Adaptations of Multiple Imputation
Reiter, J. P., & Raghunathan, T. E. (2007) · Journal of the American Statistical Association · doi:10.1198/016214507000000932 · Cited by 245
Significance levels from repeated p-values with multiply imputed data
Li, K. H., Meng, X., Raghunathan, T. E., & Rubin, D. B. (1991) · Statistica Sinica · Cited by 241
A Comparison of Multiple Imputation and Doubly Robust Estimation for Analyses with Missing Data
Carpenter, J. R., Kenward, M. G., & Vansteelandt, S. (2006) · Journal of the Royal Statistical Society Series A (Statistics in Society) · doi:10.1111/j.1467-985x.2006.00407.x · Cited by 240
Self-citationUse of Multiple Imputation in the Epidemiologic Literature
Klebanoff, M. A., & Cole, S. R. (2008) · American Journal of Epidemiology · doi:10.1093/aje/kwn071 · Cited by 238
Avoiding bias due to perfect prediction in multiple imputation of incomplete categorical variables
White, I., Daniel, R., & Royston, P. (2010) · Computational Statistics & Data Analysis · doi:10.1016/j.csda.2010.04.005 · Cited by 223
Cro, S., Morris, T. P., Kenward, M. G., & Carpenter, J. R. (2020) · Statistics in Medicine · doi:10.1002/sim.8569 · Cited by 203
Self-citationMultilevel models with multivariate mixed response types
Goldstein, H., Carpenter, J. R., Kenward, M. G., & Levin, K. A. (2009) · Statistical Modelling · doi:10.1177/1471082x0800900301 · Cited by 201
Self-citationLi, K. H., Raghunathan, T. E., & Rubin, D. B. (1991) · Journal of the American Statistical Association · doi:10.2307/2290525 · Cited by 186
Busse, W. W., Chervinsky, P., Condemi, J. J., Lumry, W. R., Petty, T. L., Rennard, S. I., & Townley, R. G. (1998) · Journal of Allergy and Clinical Immunology · doi:10.1016/s0091-6749(98)70353-7 · Cited by 184
Seaman, S. R., Bartlett, J. W., & White, I. R. (2012) · BMC Medical Research Methodology · doi:10.1186/1471-2288-12-46 · Cited by 177
Asymptotically Unbiased Estimation of Exposure Odds Ratios in Complete Records Logistic Regression
Bartlett, J. W., Harel, O., & Carpenter, J. R. (2015) · American Journal of Epidemiology · doi:10.1093/aje/kwv114 · Cited by 161
Self-citationjomo: A Flexible Package for Two-level Joint Modelling Multiple Imputation
Quartagno, M., Grund, S., & Carpenter, J. R. (2019) · The R Journal · doi:10.32614/rj-2019-028 · Cited by 142
Self-citationOn the Bias of the Multiple-Imputation Variance Estimator in Survey Sampling
Kim, J. K., Brick, J. M., Fuller, W. A., & Kalton, G. (2006) · Journal of the Royal Statistical Society Series B (Statistical Methodology) · doi:10.1111/j.1467-9868.2006.00546.x · Cited by 130
Goldstein, H., Carpenter, J. R., & Browne, W. J. (2013) · Journal of the Royal Statistical Society Series A (Statistics in Society) · doi:10.1111/rssa.12022 · Cited by 121
Self-citationQuartagno, M., & Carpenter, J. R. (2015) · Statistics in Medicine · doi:10.1002/sim.6837 · Cited by 119
Self-citationSchafer, J. L. (2001) · American Psychological Association eBooks · doi:10.1037/10409-012 · Cited by 112
Multiple Imputation of Covariates by Substantive-model Compatible Fully Conditional Specification
Bartlett, J., & Morris, T. (2015) · The Stata Journal Promoting communications on statistics and Stata · doi:10.1177/1536867x1501500206 · Cited by 104
Appropriate inclusion of interactions was needed to avoid bias in multiple imputation
Tilling, K. M., Williamson, E., Spratt, M., Sterne, J. A. C., & Carpenter, J. R. (2016) · Journal of Clinical Epidemiology · doi:10.1016/j.jclinepi.2016.07.004 · Cited by 99
Self-citationNevalainen, J., Kenward, M. G., & Virtanen, S. (2009) · Statistics in Medicine · doi:10.1002/sim.3731 · Cited by 93
Joint modelling rationale for chained equations
Hughes, R. A., White, I. R., Seaman, S. R., Carpenter, J. R., Tilling, K. M., & Sterne, J. A. C. (2014) · BMC Medical Research Methodology · doi:10.1186/1471-2288-14-28 · Cited by 91
Self-citationAnalysis of Incomplete Data Using Inverse Probability Weighting and Doubly Robust Estimators
Vansteelandt, S., Carpenter, J. R., & Kenward, M. G. (2010) · Methodology · doi:10.1027/1614-2241/a000005 · Cited by 85
Self-citationReiter, J. P. (2007) · Biometrika · doi:10.1093/biomet/asm028 · Cited by 79
Analysis of Longitudinal Binary Data from Multiphase Sampling
Clayton, D. G., Spiegelhalter, D. J., Dunn, G., & Pickles, A. R. (1998) · Journal of the Royal Statistical Society Series B (Statistical Methodology) · doi:10.1111/1467-9868.00109 · Cited by 76
Random covariances and mixed-effects models for imputing multivariate multilevel continuous data
Yucel, R. M. (2011) · Statistical Modelling · doi:10.1177/1471082x1001100404 · Cited by 72
Subsample Ignorable Likelihood for Regression Analysis with Missing Data
Little, R. J. A., & Zhang, N. (2011) · Journal of the Royal Statistical Society Series C (Applied Statistics) · doi:10.1111/j.1467-9876.2011.00763.x · Cited by 69
On the use of the not‐at‐random fully conditional specification (NARFCS) procedure in practice
Tompsett, D., Leacy, F. P., Moreno‐Betancur, M., Heron, J., & White, I. R. (2018) · Statistics in Medicine · doi:10.1002/sim.7643 · Cited by 64
Multiple Imputation with Survey Weights: A Multilevel Approach
Quartagno, M., Carpenter, J. R., & Goldstein, H. (2019) · Journal of Survey Statistics and Methodology · doi:10.1093/jssam/smz036 · Cited by 64
Self-citationWelch, C., Petersen, I., Bartlett, J., White, I., Marston, L., Morris, R., Nazareth, I., Walters, K., & Carpenter, J. (2014) · Statistics in Medicine · doi:10.1002/sim.6184 · Cited by 60
Self-citationMultiple imputation for discrete data: Evaluation of the joint latent normal model
Quartagno, M., & Carpenter, J. R. (2019) · Biometrical Journal · doi:10.1002/bimj.201800222 · Cited by 51
Self-citationInformation-Anchored Sensitivity Analysis: Theory and Application
Cro, S., Carpenter, J. R., & Kenward, M. G. (2018) · Journal of the Royal Statistical Society Series A (Statistics in Society) · doi:10.1111/rssa.12423 · Cited by 47
Self-citationMason, A. J., Gomes, M., Grieve, R., Ulug, P., Powell, J. T., & Carpenter, J. R. (2017) · Clinical Trials · doi:10.1177/1740774517711442 · Cited by 45
Self-citationMultiple imputation in Cox regression when there are time‐varying effects of covariates
Keogh, R. H., & Morris, T. P. (2018) · Statistics in Medicine · doi:10.1002/sim.7842 · Cited by 42
Kalaycıoğlu, O., Copas, A. J., King, M., & Omar, R. (2015) · Journal of the Royal Statistical Society Series A (Statistics in Society) · doi:10.1111/rssa.12140 · Cited by 41
Common Methods for Handling Missing Data in Marginal Structural Models: What Works and Why
Leyrat, C., Carpenter, J. R., Bailly, S., & Williamson, E. (2020) · American Journal of Epidemiology · doi:10.1093/aje/kwaa225 · Cited by 39
Self-citationComparison of imputation variance estimators
Hughes, R. A., Sterne, J. A. C., & Tilling, K. M. (2014) · Statistical Methods in Medical Research · doi:10.1177/0962280214526216 · Cited by 38
Reference‐based sensitivity analysis for time‐to‐event data
Atkinson, A., Kenward, M. G., Clayton, T. C., & Carpenter, J. R. (2019) · Pharmaceutical Statistics · doi:10.1002/pst.1954 · Cited by 33
Self-citationMissing covariates in competing risks analysis
Bartlett, J. W., & Taylor, J. M. G. (2016) · Biostatistics · doi:10.1093/biostatistics/kxw019 · Cited by 31
Multiple imputation for an incomplete covariate that is a ratio
Morris, T. P., White, I. R., Royston, P. J., Seaman, S. R., & Wood, A. (2013) · Statistics in Medicine · doi:10.1002/sim.5935 · Cited by 30
Smuk, M., Carpenter, J. R., & Morris, T. P. (2017) · BMC Medical Research Methodology · doi:10.1186/s12874-017-0301-0 · Cited by 22
Self-citationA method for increasing the robustness of multiple imputation
Daniel, R., & Kenward, M. G. (2011) · Computational Statistics & Data Analysis · doi:10.1016/j.csda.2011.10.006 · Cited by 21
Analysing Longitudinal Studies with Non-response: Issues and Statistical Methods
Carpenter, J. R., & Plewis, I. (2014) · SAGE Publications Ltd eBooks · doi:10.4135/9781446268261.n28 · Cited by 20
Self-citationA framework for extending trial design to facilitate missing data sensitivity analyses
Mason, A. J., Grieve, R., Richards‐Belle, A., Mouncey, P., Harrison, D. A., & Carpenter, J. R. (2020) · BMC Medical Research Methodology · doi:10.1186/s12874-020-00930-2 · Cited by 10
Self-citationLee, K. J., Tilling, K. M., Cornish, R., & Carpenter, J. R. (2021) · International Journal of Epidemiology · doi:10.1093/ije/dyab168.371 · Cited by 7
Self-citationHeitjan, D. F. (2017) · Clinical Trials · doi:10.1177/1740774517711443 · Cited by 6
Sensitivity Analysis with Multiple Imputation
Carpenter, M. P., & Kenward, M. (2014) · CRC Press eBooks · doi:10.1201/9781439854624-25 · Cited by 5
Missing Data Methodology: Sensitivity analysis after multiple imputation
Smuk, M. (2015) · LSHTM Research Online (London School of Hygiene and Tropical Medicine) · doi:10.17037/pubs.02212896 · Cited by 4
Self-citationMultiple Imputation‐Based Sensitivity Analysis
Carpenter, J. R. (2019) · Wiley StatsRef: Statistics Reference Online · doi:10.1002/9781118445112.stat07852 · Cited by 2
Self-citationMultiple imputation of missing blood pressure covariates in survival analysis
van Buuren, S., Boshuizen, H. C., & Knook, D. L. (1999) · Statistics in Medicine · doi:10.1002/(sici)1097-0258(19990330)18:6
Research works printed but not linked: 2
- Carpenter J. R., 2015, Handbook of missing data methodology, 23
- 10.1177/1740774517711442 · DOI
Cited by
Sorted by citations
Guo, B., Guo, Y., Nima, Q., Feng, Y., Wang, Z., Lu, R., Baimayangji, Ma, Y., Zhou, J., Xu, H. Y., et al. (2021) · Journal of Hepatology · doi:10.1016/j.jhep.2021.10.016 · Cited by 238
Little, R. J. A., Carpenter, J. R., & Lee, K. J. (2022) · Sociological Methods & Research · doi:10.1177/00491241221113873 · Cited by 116
Self-citationTreating gaps and biases in biodiversity data as a missing data problem
Bowler, D. E., Boyd, R. J., Callaghan, C. T., Robinson, R. A., Isaac, N. J. B., & Pocock, M. J. O. (2024) · Biological reviews/Biological reviews of the Cambridge Philosophical Society · doi:10.1111/brv.13127 · Cited by 102
Hou, W., Lin, C., Yu, L., Qin, J., Yu, R., & Wang, L. (2023) · IEEE Transactions on Medical Imaging · doi:10.1109/tmi.2023.3253760 · Cited by 74
Explainable Machine Learning Model for Chronic Kidney Disease Prediction
Arif, M. S., Rehman, A. U., & Asif, D. (2024) · Algorithms · doi:10.3390/a17100443 · Cited by 56
Metadata
- Authors
- Carpenter, J. R., & Smuk, M.
- Affiliations
- London School of Hygiene & Tropical Medicine (GB)
- Corresponding author
- Carpenter, James R.
- Venue
- Biometrical Journal
- Publisher
- Wiley
- Published
- 2021-02-24
- Volume
- 63
- Issue
- 5
- Pages
- 915-947
- ISSN
- 0323-3847 (ISSN-L)
- 1521-4036
- PMC
- PMC7615108
- OpenAlex
- W3130968222
- Cited by
- 198
- References
- 94
- Citations by year
- 2026: 38 · 2025: 54 · 2024: 36 · 2023: 32 · 2022: 31 · 2021: 7
- FWCI
- 4.92
- Type
- journal article
- Language
- en
- Open access
- hybrid
- doi.org
- Licence
- Locations
- Biometrical Journal (publishedVersion, cc-by-nc)
- PubMed (publishedVersion)
- PubMed Central (acceptedVersion, cc-by-nc)
- LSHTM Research Online (London School of Hygiene and Tropical Medicine) (acceptedVersion)
- Funders
- Medical Research Council (MC_UU_12023/21, MC_UU_12023/29, MC_UU_00004/07)
- Topics
- Physical Sciences › Mathematics › Statistics and Probability › Statistical Methods and Bayesian Inference
- Physical Sciences › Mathematics › Statistics and Probability › Advanced Causal Inference Techniques
- Physical Sciences › Mathematics › Statistics and Probability › Statistical Methods in Clinical Trials
- Keywords
- missing data, multiple imputation, sensitivity analysis, maximum likelihood estimation, Bayesian analysis, missing data mechanisms, cohort studies, case-control study, randomized controlled trials
- MeSH terms
- Bayes Theorem, Data Interpretation, Statistical, Humans, Cohort Studies, Case-Control Studies, Uncertainty
About these checks
Registry, retraction, Cites and statistics results are computed, not judged, with one exception: a printed reference that no index lists is read once by a model before it counts as a citation error. Claims are extracted by a model and kept only when their quote appears verbatim in the text; each cited source is then checked, with a model’s help, for whether it says what the claim relies on. Those verdicts can be wrong — read the claim’s quote and the cited source before relying on one.
Statistics and arithmetic are recomputed, not judged.
Confidence bands are shown only for fields calibrated on our annotated test set. None is calibrated yet, so no band is shown.
What counts as a claim ›How we measure confidence ›How we check this ›
Are you an author, or do you see a problem with this page? Request a review
