

The DOI matches its Crossref record; 61 of the 61 references it cites were found in a registry or an index.
Brain microvessel cross‐presentation is a hallmark of experimental cerebral malaria
Open accessAbstract
Cerebral malaria is a devastating complication of Plasmodium falciparum infection. Its pathogenesis is complex, involving both parasite‐ and immune‐mediated events. CD8 + T cells play an effector role in murine experimental cerebral malaria (ECM) induced by Plasmodium berghei ANKA (PbA) infection. We have identified a highly immunogenic CD8 epitope in glideosome‐associated protein 50 that is conserved across rodent malaria species. Epitope‐specific CD8 + T cells are induced during PbA infection, migrating to the brain just before neurological signs manifest. They are functional, cytotoxic and can damage the blood–brain barrier in vivo . Such CD8 + T cells are also found in the brain during infection with parasite strains/species that do not induce neuropathology. We demonstrate here that PbA infection causes brain microvessels to cross‐present parasite antigen, while non‐ECM‐causing parasites do not. Further, treatment with fast‐acting anti‐malarial drugs before the onset of ECM reduces parasite load and thus antigen presentation in the brain, preventing ECM death. Thus our data suggest that combined therapies targeting both the parasite and host antigen‐presenting cells may improve the outcome of CM patients.
Overview
The claims and statistics of this paper haven’t been checked yet.
Run the check — free, no account needed. It reads the open-access text and checks the sources it cites.
Integrity signals
Registry
Cites
Statistics
Figures
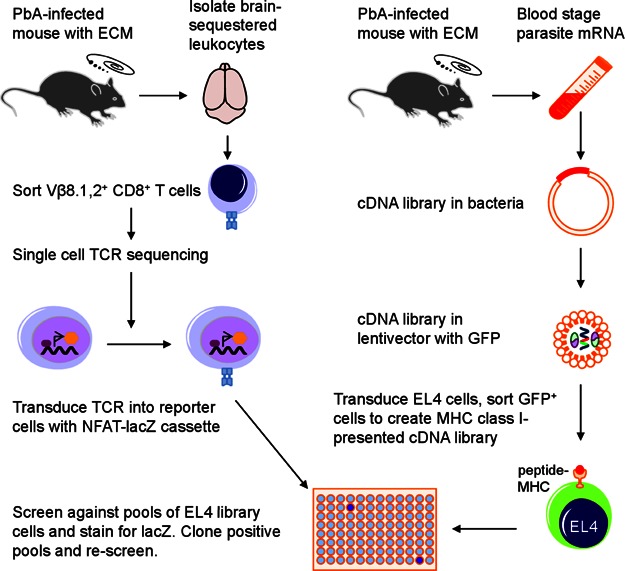
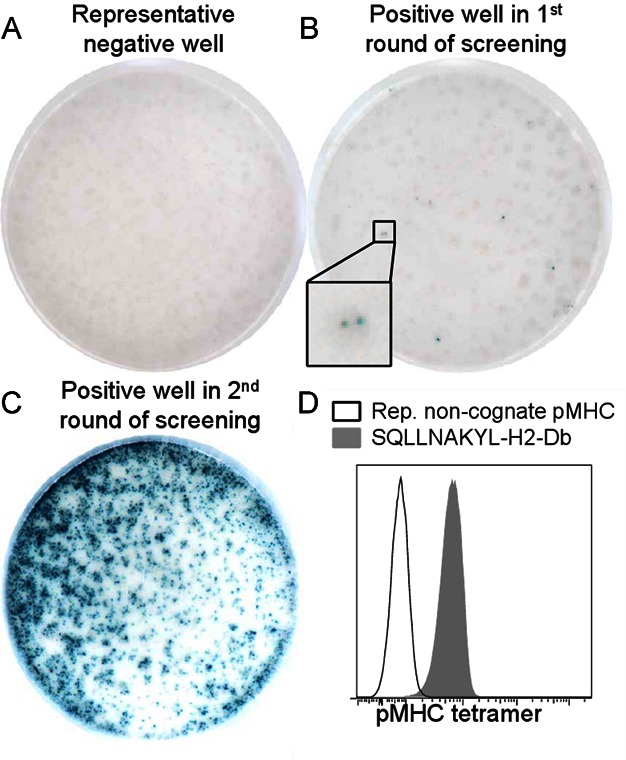
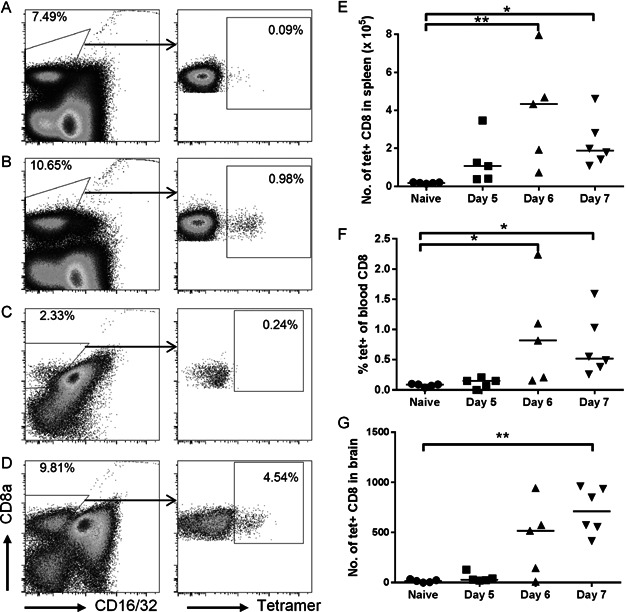
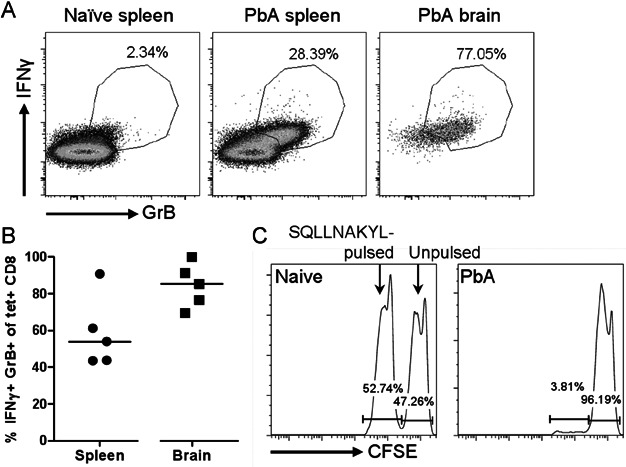
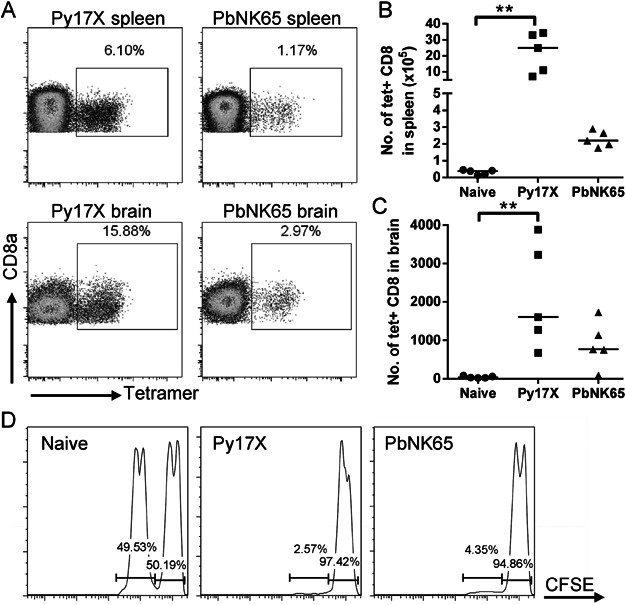
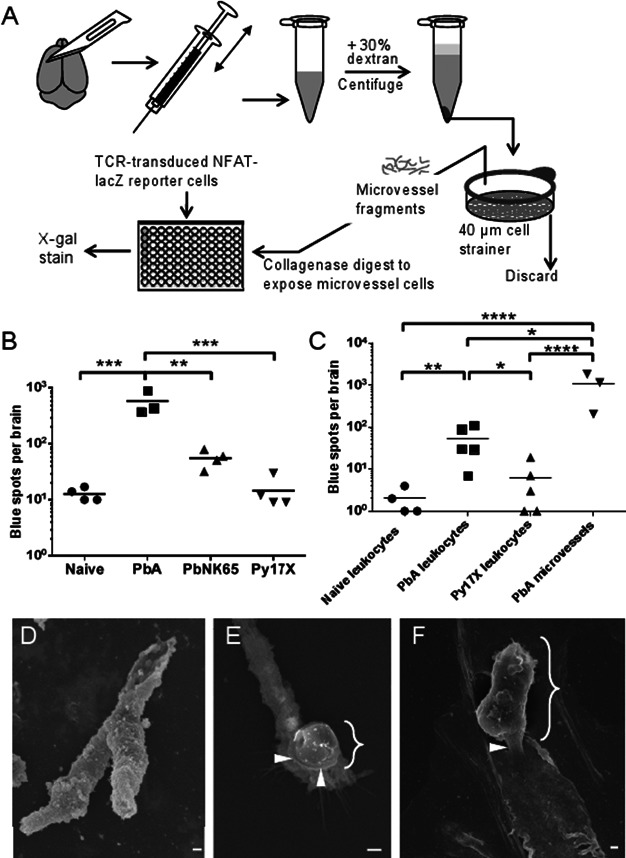
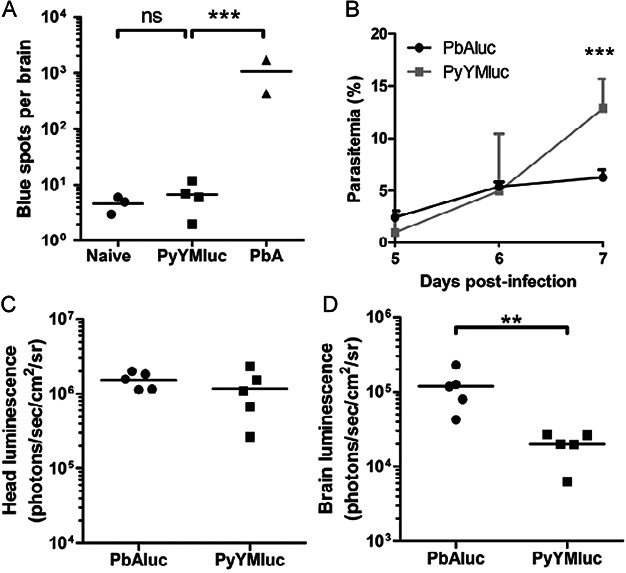
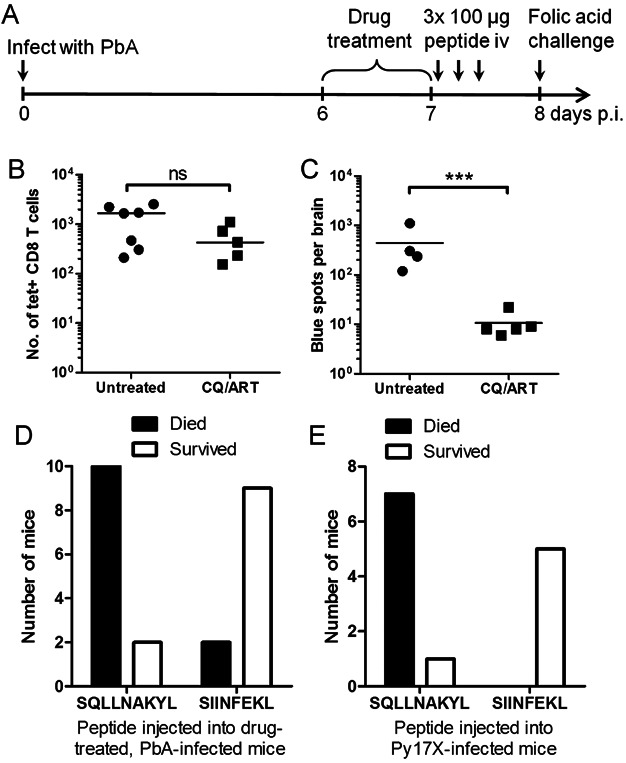
Verification
Claims the paper makes
The claims and statistics of this paper haven’t been checked yet.
Run the check — free, no account needed. It reads the open-access text and checks the sources it cites.
Claims other papers make about this one
Each is checked against this paper’s own text: does it say what the citing paper says it does?
In the citing paper
“In rodents, it was revealed that BBB breakdown and fatal edema are caused by parasite-specific CD8+ T cell engagement of cerebrovascular endothelial cells that cross-present parasite antigen (157, 158).”
From The anatomy and immunology of vasculature in the central nervous system (2019) · cites this paper as [158]
Self-check
Percentages, sums and reported differences re-computed from the paper’s own numbers.
The self-check needs the paper’s full text.
Citations
Cites
Brochet, X., Lefranc, M., & Giudicelli, V. (2008) · Nucleic Acids Research · doi:10.1093/nar/gkn316 · Cited by 1,220
Limmer, A., Ohl, J., Kurts, C., Ljunggren, H.-G., Reiss, Y., Groettrup, M., Momburg, F., Arnold, B., & Knolle, P. A. (2000) · Nature Medicine · doi:10.1038/82161 · Cited by 758 · cited 1×
“Endothelial cells from a number of organs have been shown to be capable of cross-presentation, including the liver, pancreas, aorta and lymph node (Bagai et al, 2005; Limmer et al, 2000; Lund et al, 2012; Savinov et al, 2003).”
Carlton, J. M., Angiuoli, S. V., Suh, B. B., Kooij, T. W. A., Pertea, M., da Silva, J. C. F., Ermolaeva, M. D., Allen, J., Selengut, J., Koo, H. L., et al. (2002) · Nature · doi:10.1038/nature01099 · Cited by 734
Cross-priming in health and disease
Kurts, C., Robinson, B. W. S., & Knolle, P. A. (2010) · Nature reviews. Immunology · doi:10.1038/nri2780 · Cited by 452
Neurological sequelae of cerebral malaria in children
Brewster, D., Kwiatkowski, D. P., & White, N. J. (1990) · The Lancet · doi:10.1016/0140-6736(90)92498-7 · Cited by 407
LacZ inducible, antigen/MHC-specific T cell hybrids
Sanderson, S., & Shastri, N. (1994) · International Immunology · doi:10.1093/intimm/6.3.369 · Cited by 377
Self-citationLund, A. W., Durães, F. V., Hirosue, S., Raghavan, V. R., Nembrini, C., Thomas, S. N., Issa, A., Hugues, S., & Swartz, M. A. (2012) · Cell Reports · doi:10.1016/j.celrep.2012.01.005 · Cited by 355
Design and use of conditional MHC class I ligands
Toebes, M., Coccoris, M., Bins, A. D., Rodenko, B., Gomez, R., Nieuwkoop, N. J., van de Kasteele, W., Rimmelzwaan, G. F., Haanen, J. B. A. G., Ovaa, H., et al. (2006) · Nature Medicine · doi:10.1038/nm1360 · Cited by 348
On the Pathogenic Role of Brain-Sequestered αβ CD8+ T Cells in Experimental Cerebral Malaria
Belnoue, E., Kayibanda, M., Vigário, A. M., Deschemin, J., van Rooijen, N., Viguier, M., Snounou, G., & Rénia, L. (2002) · The Journal of Immunology · doi:10.4049/jimmunol.169.11.6369 · Cited by 341
Self-citationFranke-Fayard, B. M. D., Janse, C. J., Cunha‐Rodrigues, M., Ramesar, J., Büscher, P., Que, I., Löwik, C. W. G. M., Voshol, P. J., den Boer, M. A. M., van Duinen, S. G., et al. (2005) · Proceedings of the National Academy of Sciences · doi:10.1073/pnas.0503386102 · Cited by 331
Research works printed but not linked: 2
- Engwerda C, Belnoue E, Gruner AC, Renia L (2005) Experimental models of cerebral malaria. Curr Top Microbiol Immunol 297: 103-143
- Song L, Pachter JS (2003) Culture of murine brain microvascular endothelial cells that maintain expression and cytoskeletal association of tight junction‐associated proteins. In Vitro Cell Dev Biol Anim 39: 313-320 · DOI
Cited by
Sorted by citations
The anatomy and immunology of vasculature in the central nervous system
Mastorakos, P., & McGavern, D. (2019) · Science Immunology · doi:10.1126/sciimmunol.aav0492 · Cited by 333
Crompton, P. D., Moebius, J., Portugal, S., Waisberg, M., Hart, G. T., Garver, L. S., Miller, L. H., Barillas-Mury, C. V., & Pierce, S. K. (2014) · Annual Review of Immunology · doi:10.1146/annurev-immunol-032713-120220 · Cited by 341
PD-1 Dependent Exhaustion of CD8+ T Cells Drives Chronic Malaria
Horne‐Debets, J. M., Faleiro, R. J., Karunarathne, D. S., Liu, X. Q., Lineburg, K. E., Poh, C. M., Grotenbreg, G. M., Hill, G. R., MacDonald, K. P. A., Good, M. F., et al. (2013) · Cell Reports · doi:10.1016/j.celrep.2013.11.002 · Cited by 148
Self-citationThe immunological balance between host and parasite in malaria
Deroost, K., Pham, T., Opdenakker, G., & den Steen, P. E. V. (2015) · FEMS Microbiology Reviews · doi:10.1093/femsre/fuv046 · Cited by 155
Groß, C. C., Meyer, C., Bhatia, U., Yshii, L., Kleffner, I., Bauer, J., Tröscher, A. R., Schulte‐Mecklenbeck, A., Herich, S., Schneider‐Hohendorf, T., et al. (2019) · Nature Communications · doi:10.1038/s41467-019-13593-5 · Cited by 158
Interferon-γ: The Jekyll and Hyde of Malaria
King, T., & Lamb, T. J. (2015) · PLoS Pathogens · doi:10.1371/journal.ppat.1005118 · Cited by 141
CD8+ T cells target cerebrovasculature in children with cerebral malaria
Riggle, B. A., Manglani, M., Maric, D., Johnson, K. R., Lee, M., Neto, O. L. A., Taylor, T. E., Seydel, K. B., Nath, A., Miller, L. H., et al. (2019) · Journal of Clinical Investigation · doi:10.1172/jci133474 · Cited by 127
Swanson, P. A., Hart, G. T., Russo, M. V., Nayak, D., Yazew, T., Peña, M., Khan, S. M., Janse, C. J., Pierce, S. K., & McGavern, D. B. (2016) · PLOS Pathogens · doi:10.1371/journal.ppat.1006022 · Cited by 125
Activated Brain Endothelial Cells Cross-Present Malaria Antigen
Howland, S. W., Poh, C. M., & Rénia, L. (2015) · PLoS Pathogens · doi:10.1371/journal.ppat.1004963 · Cited by 110
Self-citationTissue-specific immunopathology during malaria infection
Coban, C., Lee, M. S. J., & Ishii, K. J. (2018) · Nature reviews. Immunology · doi:10.1038/nri.2017.138 · Cited by 111
Karunarathne, D. S., Horne‐Debets, J. M., Huang, J. X., Faleiro, R. J., Leow, C. Y., Amante, F. H., Watkins, T. S., Miles, J. J., Dwyer, P., Stacey, K. J., et al. (2016) · Immunity · doi:10.1016/j.immuni.2016.07.017 · Cited by 104
Self-citationExperimental Cerebral Malaria Pathogenesis—Hemodynamics at the Blood Brain Barrier
Nacer, A., Movilă, A., Sohet, F., Girgis, N. M., Gundra, U. M., Loke, P., Daneman, R., & Frevert, U. (2014) · PLoS Pathogens · doi:10.1371/journal.ppat.1004528 · Cited by 98
Sierro, F., & Grau, G. E. (2019) · Frontiers in Immunology · doi:10.3389/fimmu.2019.00830 · Cited by 108
Song, X., Wei, W., Cheng, W., Zhu, H., Wang, W., Dong, H., & Li, J. (2022) · Frontiers in Cellular and Infection Microbiology · doi:10.3389/fcimb.2022.939532 · Cited by 95
Pathogenic CD8+ T cells in experimental cerebral malaria
Howland, S. W., Claser, C., Poh, C. M., Gun, S. Y., & Rénia, L. (2015) · Seminars in Immunopathology · doi:10.1007/s00281-015-0476-6 · Cited by 99
Self-citationA quantitative brain map of experimental cerebral malaria pathology
Strangward, P., Haley, M., Shaw, T. N., Schwartz, J., Greig, R., Mironov, A., de Souza, J. B., Cruickshank, S. M., Craig, A. G., Milner, D. A., et al. (2017) · PLoS Pathogens · doi:10.1371/journal.ppat.1006267 · Cited by 89
Polimeni, M., & Prato, M. (2014) · Fluids and Barriers of the CNS · doi:10.1186/2045-8118-11-1 · Cited by 87
Targeting glutamine metabolism rescues mice from late-stage cerebral malaria
Gordon, E. B., Hart, G. T., Tran, T. M., Waisberg, M., Akkaya, M., Kim, A. S., Hamilton, S. E., Peña, M., Yazew, T., Qi, C., et al. (2015) · Proceedings of the National Academy of Sciences · doi:10.1073/pnas.1516544112 · Cited by 80
Burrack, K. S., Huggins, M. A., Taras, E., Dougherty, P., Henzler, C. M., Yang, R., Alter, S., Jeng, E. K., Wong, H. C., Felices, M., et al. (2018) · Immunity · doi:10.1016/j.immuni.2018.03.012 · Cited by 80
Kam, Y., Lee, C. Y., Teo, T., Howland, S. W., Amrun, S. N., Lum, F., See, P., Kng, N. Q.-R., Huber, R. G., Xu, M., et al. (2017) · JCI Insight · doi:10.1172/jci.insight.92428 · Cited by 75
Self-citationPerivascular Arrest of CD8+ T Cells Is a Signature of Experimental Cerebral Malaria
Shaw, T. N., Stewart-Hutchinson, P. J., Strangward, P., Dandamudi, D. B., Coles, J. A., Villegas-Méndez, A., Gallego‐Delgado, J., van Rooijen, N., Zindy, E., Rodrı́guez, A., et al. (2015) · PLoS Pathogens · doi:10.1371/journal.ppat.1005210 · Cited by 79
Pai, S., Qin, J., Cavanagh, L. L., Mitchell, A. J., El‐Assaad, F., Jain, R., Combes, V., Hunt, N. H., Grau, G. E., & Weninger, W. (2014) · PLoS Pathogens · doi:10.1371/journal.ppat.1004236 · Cited by 76
Repeated clinical malaria episodes are associated with modification of the immune system in children
Bediako, Y., Adams, R., Reid, A. J., Valletta, J. J., Ndungu, F. M., Sodenkamp, J., Mwacharo, J. K., Ngoi, J. M., Kimani, D., Kai, O. K., et al. (2019) · BMC Medicine · doi:10.1186/s12916-019-1292-y · Cited by 73
Kurup, S. P., Anthony, S. M., Hancox, L. S., Vijay, R., Pewe, L. L., Moioffer, S. J., Sompallae, R. R., Janse, C. J., Khan, S. M., & Harty, J. T. (2019) · Cell Host & Microbe · doi:10.1016/j.chom.2019.02.014 · Cited by 71
Pal, P., Daniels, B. P., Oskman, A., Diamond, M., Klein, R. S., & Goldberg, D. E. (2016) · mBio · doi:10.1128/mbio.00617-16 · Cited by 73
Sorensen, E. W., Lian, J., Ozga, A. J., Miyabe, Y., Ji, S., Bromley, S. K., Mempel, T. R., & Luster, A. D. (2018) · JCI Insight · doi:10.1172/jci.insight.98911 · Cited by 71
Claser, C., Nguee, S. Y. T., Balachander, A., Howland, S. W., Becht, É., Gunasegaran, B., Hartimath, S. V., Lee, A. W. Q., Ho, J. T. T., Ong, C. B., et al. (2019) · Nature Communications · doi:10.1038/s41467-019-12017-8 · Cited by 69
Self-citationHirako, I. C., Ataide, M. A., Faustino, L., de Assis, P. A., Sorensen, E. W., Ueta, H., Araújo, N. M., Menezes, G. B., Luster, A. D., & Gazzinelli, R. T. (2016) · Nature Communications · doi:10.1038/ncomms13277 · Cited by 70
Immunological defense of CNS barriers against infections
Ampie, L., & McGavern, D. B. (2022) · Immunity · doi:10.1016/j.immuni.2022.04.012 · Cited by 63
Cerebral malaria: gamma-interferon redux
Hunt, N. H., Ball, H. J., Hansen, A. M., Khaw, L. T., Guo, J. T., Bakmiwewa, S. M., Mitchell, A. J., Combes, V., & Grau, G. E. (2014) · Frontiers in Cellular and Infection Microbiology · doi:10.3389/fcimb.2014.00113 · Cited by 62
Safeukui, I., Gómez, N. D., Adelani, A. A., Burté, F., Afolabi, N. K., Akondy, R. S., Velázquez, P., Holder, A. A., Tewari, R., Buffet, P. A., et al. (2015) · mBio · doi:10.1128/mbio.02493-14 · Cited by 61
Huggins, M. A., Johnson, H. L., Jin, F., N’Songo, A., Hanson, L., LaFrance, S. J., Butler, N. S., Harty, J. T., & Johnson, A. J. (2017) · Infection and Immunity · doi:10.1128/iai.00985-16 · Cited by 60
Olfactory Plays a Key Role in Spatiotemporal Pathogenesis of Cerebral Malaria
Zhao, H., Aoshi, T., Kawai, S., Mori, Y., Konishi, A., Özkan, M., Fujita, Y., Haseda, Y., Shimizu, M., Kohyama, M., et al. (2014) · Cell Host & Microbe · doi:10.1016/j.chom.2014.04.008 · Cited by 59
Inhibiting the Mammalian Target of Rapamycin Blocks the Development of Experimental Cerebral Malaria
Gordon, E. B., Hart, G. T., Tran, T. M., Waisberg, M., Akkaya, M., Skinner, J., Zinöcker, S., Peña, M., Yazew, T., Qi, C., et al. (2015) · mBio · doi:10.1128/mbio.00725-15 · Cited by 49
The C-Type Lectin Receptor DCIR Is Crucial for the Development of Experimental Cerebral Malaria
Maglinao, M., Klopfleisch, R., Seeberger, P. H., & Lepenies, B. (2013) · The Journal of Immunology · doi:10.4049/jimmunol.1203451 · Cited by 52
Brain Endothelium: The “Innate Immunity Response Hypothesis” in Cerebral Malaria Pathogenesis
Pais, T. F., & Penha‐Gonçalves, C. (2019) · Frontiers in Immunology · doi:10.3389/fimmu.2018.03100 · Cited by 43
Butler, N. S., Harris, T. H., & Blader, I. J. (2013) · Trends in Parasitology · doi:10.1016/j.pt.2013.10.002 · Cited by 42
Feng, G., Li, J. L. Y., Claser, C., Balachander, A., Tan, Y., Goh, C. C., Kwok, I., Rénia, L., Tang, B. Z., Ng, L. G., et al. (2017) · Biomaterials · doi:10.1016/j.biomaterials.2017.10.031 · Cited by 41
Self-citationPoh, C. M., Howland, S. W., Grotenbreg, G. M., & Rénia, L. (2014) · Infection and Immunity · doi:10.1128/iai.02180-14 · Cited by 40
Self-citationDraheim, M., Wlodarczyk, M. F., Crozat, K., Saliou, J., Alayi, T. D., Tomavo, S., Hassan, A., Salvioni, A., Demarta‐Gatsi, C., Sidney, J., et al. (2017) · EMBO Molecular Medicine · doi:10.15252/emmm.201708123 · Cited by 40
Interferons and Interferon Regulatory Factors in Malaria
Gun, S. Y., Claser, C., Tan, K. S. W., & Rénia, L. (2014) · Mediators of Inflammation · doi:10.1155/2014/243713 · Cited by 38
Self-citationCaccuri, F., Bugatti, A., Zani, A., Palma, A. D., Silvestre, D. D., Manocha, E., Filippini, F., Messali, S., Chiodelli, P., Campisi, G., et al. (2021) · Microorganisms · doi:10.3390/microorganisms9071438 · Cited by 38
Discriminating Protective from Nonprotective Plasmodium-Specific CD8+ T Cell Responses
Doll, K. L., Pewe, L. L., Kurup, S. P., & Harty, J. T. (2016) · The Journal of Immunology · doi:10.4049/jimmunol.1600155 · Cited by 39
EphA2 contributes to disruption of the blood-brain barrier in cerebral malaria
Darling, T. K., Mimche, P. N., Bray, C., Umaru, B. A., Brady, L. M., Stone, C., Moukoko, C. E. E., Lane, T. E., Ayong, L. S., & Lamb, T. J. (2020) · PLoS Pathogens · doi:10.1371/journal.ppat.1008261 · Cited by 35
Hopp, C. S., Bennett, B. L., Mishra, S., Lehmann, C., Hanson, K. K., Lin, J., Rousseau, K. E., Carvalho, F. A., van der Linden, W. A., Santos, N. C., et al. (2017) · PLoS Pathogens · doi:10.1371/journal.ppat.1006586 · Cited by 33
Teo, T., Howland, S. W., Claser, C., Gun, S. Y., Poh, C. M., Lee, W. W. L., Lum, F., Ng, L. F. P., & Rénia, L. (2017) · EMBO Molecular Medicine · doi:10.15252/emmm.201707885 · Cited by 33
Self-citationCD8+ T cells and human cerebral malaria: a shifting episteme
Rénia, L., Grau, G. E., & Wassmer, S. C. (2020) · Journal of Clinical Investigation · doi:10.1172/jci135510 · Cited by 34
Self-citationPathogenetic mechanisms and treatment targets in cerebral malaria
Hadjilaou, A., Brandi, J., Riehn, M., Friese, M. A., & Jacobs, T. (2023) · Nature Reviews Neurology · doi:10.1038/s41582-023-00881-4 · Cited by 36
Schmidt, K. E., Kuehlwein, J. M., Schumak, B., Alferink, J., Hofmann, A., Howland, S. W., Rénia, L., Limmer, A., Specht, S., & Hoerauf, A. M. (2018) · PLoS ONE · doi:10.1371/journal.pone.0192717 · Cited by 32
Self-citationMechanism of splenic cell death and host mortality in a Plasmodium yoelii malaria model
Lacerda‐Queiroz, N., Riteau, N., Eastman, R. T., Bock, K. W., Orandle, M. S., Moore, I. N., Sher, A., Long, C. A., Jankovic, D. L., & Su, X. (2017) · Scientific Reports · doi:10.1038/s41598-017-10776-2 · Cited by 31
Ueno, N., & Lodoen, M. B. (2015) · Current Opinion in Microbiology · doi:10.1016/j.mib.2015.05.006 · Cited by 30
A T Cell Receptor Locus Harbors a Malaria-Specific Immune Response Gene
Budimir, N., Gras, S., Ladell, K., Josephs, T. M., Pewe, L. L., Urban, S. L., Miners, K. L., Farenc, C., Price, D. A., Rossjohn, J., et al. (2017) · Immunity · doi:10.1016/j.immuni.2017.10.013 · Cited by 29
The kynurenine pathway and parasitic infections that affect CNS function.
Hunt, N., Too, L. K., Khaw, L., Guo, J.-T., Hee, L., Mitchell, A., Grau, G., & Ball, H. (2017) · Neuropharmacology · doi:10.1016/j.neuropharm.2016.02.029 · Cited by 29
Dendritic cell function and antigen presentation in malaria.
Cockburn, I., & Zavala, F. (2016) · Current Opinion in Immunology · doi:10.1016/j.coi.2016.01.010 · Cited by 28
Harit, K., Bhattacharjee, R., Matuschewski, K., Becker, J. S., Kalinke, U., Schlüter, D., & Nishanth, G. (2023) · Cell Death and Disease · doi:10.1038/s41419-023-06014-5 · Cited by 28
Unravelling mysteries at the perivascular space: a new rationale for cerebral malaria pathogenesis
Wassmer, S. C., de Koning‐Ward, T. F., Grau, G. E., & Pai, S. (2023) · Trends in Parasitology · doi:10.1016/j.pt.2023.11.005 · Cited by 27
Horne‐Debets, J. M., Karunarathne, D. S., Faleiro, R. J., Poh, C. M., Rénia, L., & Wykes, M. (2016) · Scientific Reports · doi:10.1038/srep26210 · Cited by 27
Self-citationEdwards, C. L., Best, S. E., Gun, S. Y., Claser, C., James, K. R., de, M. M., Sebina, I., Rivera, F. D. L., Amante, F. H., Hertzog, P. J., et al. (2014) · European Journal of Immunology · doi:10.1002/eji.201444824 · Cited by 24
Self-citationMeasuring antigen presentation in mouse brain endothelial cells ex vivo and in vitro
Howland, S., Gun, S., Claser, C., Poh, C., & Rénia, L. (2015) · Nature Protocols · doi:10.1038/nprot.2015.129 · Cited by 26
Self-citationSchmid, U., Stenzel, W., Koschel, J., Raptaki, M., Wang, X., Naumann, M., Matuschewski, K., Schlüter, D., & Nishanth, G. (2017) · Frontiers in Immunology · doi:10.3389/fimmu.2017.00027 · Cited by 25
Pal, P., Balaban, A. E., Diamond, M., Sinnis, P., Klein, R. S., & Goldberg, D. E. (2017) · PLoS ONE · doi:10.1371/journal.pone.0177142 · Cited by 24
Mouse Models for Unravelling Immunology of Blood Stage Malaria
Olatunde, A., Cornwall, D. H., Roedel, M., & Lamb, T. J. (2022) · Vaccines · doi:10.3390/vaccines10091525 · Cited by 21
Claser, C., de Souza, J. B., Thorburn, S. G., Grau, G. E., Riley, E. M., Rénia, L., & Hafalla, J. C. R. (2017) · Infection and Immunity · doi:10.1128/iai.00941-16 · Cited by 23
Self-citationQin, J., Lovelace, M. D., Mitchell, A. J., de Koning‐Ward, T. F., Grau, G. E., & Pai, S. (2021) · Clinical & Translational Immunology · doi:10.1002/cti2.1273 · Cited by 22
Oelschlegel, A. M., Bhattacharjee, R., Wenk, P., Harit, K., Rothkötter, H.-J., Koch, S., Boehm‐Sturm, P., Matuschewski, K., Budinger, E., Schlüter, D., et al. (2024) · Nature Communications · doi:10.1038/s41467-024-46617-w · Cited by 22
Endothelial type I interferon response and brain diseases: identifying STING as a therapeutic target
Duarte, N., Shafi, A. M., Penha‐Gonçalves, C., & Pais, T. F. (2023) · Frontiers in Cell and Developmental Biology · doi:10.3389/fcell.2023.1249235 · Cited by 22
Wang, J., Li, Y., Shen, Y., Liang, J., Li, Y., Huang, Y., Liu, X., Jiang, D., Yang, S., Zhao, Y., et al. (2019) · Frontiers in Immunology · doi:10.3389/fimmu.2018.03157 · Cited by 20
Sato, Y., Ries, S., Stenzel, W., Fillatreau, S., & Matuschewski, K. (2019) · Frontiers in Immunology · doi:10.3389/fimmu.2019.02554 · Cited by 20
Chemical Attenuation of Plasmodium in the Liver Modulates Severe Malaria Disease Progression
Lewis, M. D., Behrends, J., Cunha, C. S. E., Mendes, A. M., Lasitschka, F., Sattler, J. M., Heiß, K., Kooij, T. W. A., Prudêncio, M., Bringmann, G., et al. (2015) · The Journal of Immunology · doi:10.4049/jimmunol.1400863 · Cited by 19
Nakamae, S., Kimura, D., Miyakoda, M., Sukhbaatar, O., Inoue, S., & Yui, K. (2019) · Parasitology International · doi:10.1016/j.parint.2019.01.003 · Cited by 19
The immunomodulatory effect of microglia on ECM neuroinflammation via the PD‐1/PD‐L1 pathway
Shen, Y., Li, Y., Zhu, Q., Wang, J., Huang, Y., Liang, J., Wu, X., & Zhao, Y. (2021) · CNS Neuroscience & Therapeutics · doi:10.1111/cns.13760 · Cited by 17
Cross-presentation by the others
Mauvais, F., & Endert, P. V. (2023) · Seminars in Immunology · doi:10.1016/j.smim.2023.101764 · Cited by 17
Lin, J., Shaw, T. N., Annoura, T., Aurélie, F., Bouchier, P., Chevalley, S., Kroeze, H., Franke-Fayard, B. M. D., Janse, C. J., Couper, K. N., et al. (2014) · Infection and Immunity · doi:10.1128/iai.01940-14 · Cited by 18
Ersching, J., Vasconcelos, J. R., Ferreira, C. P., Caetano, B. C., Machado, A. V., Bruna–Romero, O., Baron, M. A., Ferreira, L. R. P., Cunha-Neto, E., Rock, K. L., et al. (2016) · PLOS Pathogens · doi:10.1371/journal.ppat.1005593 · Cited by 18
Piatti, L., Batzilla, A., Nakaki, F., Fleckenstein, H., Korbmacher, F., Long, R. K. M., Schraivogel, D., Hawkins, J. A., Romero-Uruñuela, T., López-Gutiérrez, B., et al. (2025) · Nature Communications · doi:10.1038/s41467-025-62514-2 · Cited by 17
Enders, M. H., Bayarsaikhan, G., Ghilas, S., Yu, C.-C., May, R., de Menezes, M. N., Ge, Z.-Y., Tan, P., Cozijnsen, A., Mollard, V., et al. (2021) · Current Research in Immunology · doi:10.1016/j.crimmu.2021.06.002 · Cited by 14
Gun, S. Y., Claser, C., Teo, T. H., Howland, S. W., Poh, C. M., Chye, R. R. Y., Ng, L. F. P., & Rénia, L. (2017) · Cellular Microbiology · doi:10.1111/cmi.12819 · Cited by 17
Self-citationBakmiwewa, S. M., Weiser, S., Grey, M., Heng, B., Guillemin, G. J., Ball, H. J., & Hunt, N. H. (2015) · Cytokine · doi:10.1016/j.cyto.2015.11.024 · Cited by 16
Fain, C. E., Zheng, J., Jin, F., Ayasoufi, K., Wu, Y., Lilley, M. T., Dropik, A. R., Wolf, D. M., Rodriguez, R. C., Aibaidula, A., et al. (2023) · Brain · doi:10.1093/brain/awad319 · Cited by 21
Chen, J., Bai, Y., He, X., Xiao, W. L., Chen, L., Wong, Y., Wang, C., Gao, P., Cheng, G., Xu, L., et al. (2025) · Nature Communications · doi:10.1038/s41467-024-52223-7 · Cited by 19
HVEM and CD160: Regulators of Immunopathology During Malaria Blood-Stage
Muscate, F., Stetter, N., Schramm, C., Wiesch, J. S. Z., Bosurgi, L., & Jacobs, T. (2018) · Frontiers in Immunology · doi:10.3389/fimmu.2018.02611 · Cited by 15
Brandi, J., Riehn, M., Hadjilaou, A., & Jacobs, T. (2022) · Frontiers in Immunology · doi:10.3389/fimmu.2022.878320 · Cited by 14
ELISPOT Assay to Measure Peptide-specific IFN-γ Production
Wykes, M., & Rénia, L. (2017) · BIO-PROTOCOL · doi:10.21769/bioprotoc.2302 · Cited by 14
Self-citationBCG Provides Short-Term Protection from Experimental Cerebral Malaria in Mice
Witschkowski, J., Behrends, J., Frank, R., Eggers, L. F., von Borstel, L., Hertz, D., Mueller, A., & Schneider, B. E. (2020) · Vaccines · doi:10.3390/vaccines8040745 · Cited by 14
Silva‐Filho, J. L., Caruso‐Neves, C., & Pinheiro, A. A. S. (2017) · Frontiers in Cellular and Infection Microbiology · doi:10.3389/fcimb.2017.00042 · Cited by 14
Shafi, A. M., Végvári, Á., Howland, S. W., Zubarev, R. A., Rénia, L., & Penha‐Gonçalves, C. (2023) · Frontiers in Immunology · doi:10.3389/fimmu.2023.1149107 · Cited by 13
Self-citationYui, K. (2013) · EMBO Molecular Medicine · doi:10.1002/emmm.201302849 · Cited by 13
Evidence of cross‐stage CD 8+ T cell epitopes in malaria pre‐erythrocytic and blood stage infections
Müller, K., Gibbins, M. P., Matuschewski, K., & Hafalla, J. C. R. (2017) · Parasite Immunology · doi:10.1111/pim.12434 · Cited by 13
Villegas-Méndez, A., Stafford, N., Haley, M., Pravitasari, N. E., Baudoin, F., Ali, A., Asih, P. B. S., Siregar, J. E., Baena, E., Syafruddin, D., et al. (2021) · Malaria Journal · doi:10.1186/s12936-021-03832-w · Cited by 12
Phosphatidylinositol 3-Kinase γ Is Required for the Development of Experimental Cerebral Malaria
Lacerda‐Queiroz, N., Brant, F., Rodrigues, D. H., Vago, J. P., Rachid, M. A., Sousa, L. P., Teixeira, M. M., & Teixeira, A. L. (2015) · PLoS ONE · doi:10.1371/journal.pone.0119633 · Cited by 12
A Plasmodium Cross-Stage Antigen Contributes to the Development of Experimental Cerebral Malaria
Fernandes, P., Howland, S. W., Heiß, K., Hoffmann, A., Hernández-Castañeda, M. A., Obrová, K., Frank, R., Wiedemann, P., Bendzus, M., Rénia, L., et al. (2018) · Frontiers in Immunology · doi:10.3389/fimmu.2018.01875 · Cited by 11
Self-citationKuehlwein, J. M., Borsche, M., Korir, P. J., Risch, F., Mueller, A., Hübner, M. P., Hildner, K. M., Hoerauf, A. M., Dunay, I. R., & Schumak, B. (2019) · Immunology · doi:10.1111/imm.13137 · Cited by 11
Freire-Antunes, L., Ornellas-Garcia, U., Rangel-Ferreira, M. V., Ribeiro-Almeida, M. L., de Sousa, C. H. G., Carvalho, L. J. M., Daniel‐Ribeiro, C. T., & Ribeiro-Gomes, F. L. (2023) · International Journal of Molecular Sciences · doi:10.3390/ijms241411332 · Cited by 10
Blank, J., Behrends, J., Jacobs, T., & Schneider, B. E. (2015) · Infection and Immunity · doi:10.1128/iai.01290-15 · Cited by 10
Imai, T., Suzue, K., Ngo-Thanh, H., Suguri, O., Orita, W., Suzuki, H., Shimokawa, C., Olia, A., Obi, S., Taniguchi, T., et al. (2019) · Frontiers in Immunology · doi:10.3389/fimmu.2019.02207 · Cited by 10
Suppression of Plasmodium MIF‐CD74 signaling protects against severe malaria
Garcia, A. B., Siu, E., Du, X., Leng, L., Franke-Fayard, B. M. D., Janse, C. J., Howland, S. W., Rénia, L., Lolis, E., & Bucala, R. (2021) · The FASEB Journal · doi:10.1096/fj.202101072r · Cited by 10
Self-citationPais, T. F., & Penha‐Gonçalves, C. (2023) · Parasitology Research · doi:10.1007/s00436-023-07782-x · Cited by 9
Exploring immunological mechanisms of the whole sporozoite vaccination against P. falciparum malaria
Mo, A. X. Y., Pesce, J. T., & Hall, B. (2015) · Vaccine · doi:10.1016/j.vaccine.2015.04.056 · Cited by 9
Billman, Z. P., Kas, A., Stone, B. C., & Murphy, S. C. (2016) · Malaria Journal · doi:10.1186/s12936-016-1295-5 · Cited by 9
Guo, J. T., McQuillan, J. A., Yau, B., Tullo, G., Long, C. A., Bertolino, P., Roediger, B., Weninger, W., Taylor, G. A., Hunt, N. H., et al. (2015) · Infection and Immunity · doi:10.1128/iai.02701-14 · Cited by 9
Metadata
- Authors
- Howland, S. W., Poh, C. M., Gun, S. Y., Claser, C., Malleret, B., Shastri, N., Ginhoux, F., Grotenbreg, G. M., & Rénia, L.
- Affiliations
- Agency for Science, Technology and Research (SG)
- University of California, Berkeley (US)
- National University of Singapore (SG)
- Corresponding author
- Rénia, Laurent
- ORCID
- Venue
- EMBO Molecular Medicine
- Published
- 2013-05-16
- Volume
- 5
- Issue
- 7
- Pages
- 984-99
- ISSN
- 1757-4676 (ISSN-L)
- 1757-4684
- PMC
- PMC3721469
- OpenAlex
- W2114900483
- Cited by
- 150
- References
- 61
- Citations by year
- 2026: 3 · 2025: 11 · 2024: 9 · 2023: 13 · 2022: 5 · 2021: 11 · 2020: 5 · 2019: 16 · 2018: 10 · 2017: 21 · 2016: 12 · 2015: 17 · 2014: 13 · 2013: 4
- FWCI
- 15.64
- Type
- journal article
- Language
- en
- Open access
- gold
- doi.org
- Locations
- EMBO Molecular Medicine (publishedVersion, cc-by)
- Europe PMC (PubMed Central) (publishedVersion, cc-by)
- PubMed Central (publishedVersion, cc-by)
- PubMed (publishedVersion)
- National University of Singapore (submittedVersion)
- DOAJ (DOAJ: Directory of Open Access Journals) (submittedVersion)
- eScholarship (California Digital Library) (submittedVersion)
- eScholarship (California Digital Library) (submittedVersion, cc-by)
- Funders
- Wellcome Trust
- National Research Foundation
- Agency for Science, Technology and Research
- National University of Singapore
- National Research Foundation Singapore (NRF2007NRF-RF001-226)
- National Institute of Allergy and Infectious Diseases (R37AI060040)
- Topics
- Health Sciences › Medicine › Public Health, Environmental and Occupational Health › Malaria Research and Control
- Life Sciences › Immunology and Microbiology › Microbiology › Bacterial Infections and Vaccines
- Life Sciences › Neuroscience › Neurology › Neuroinflammation and Neurodegeneration Mechanisms
- Keywords
- experimental cerebral malaria, Plasmodium falciparum, Plasmodium berghei ANKA, CD8+ T cells, cross-presentation, cerebral microvasculature, blood-brain barrier disruption, infection intensity, neuropathology
- MeSH terms
- Amino Acid Sequence, Animals, Antigens, Protozoan, Antimalarials, Blood-Brain Barrier, Brain, Female, Humans, Mice, Inbred C57BL, Molecular Sequence Data, Plasmodium berghei, Receptors, Antigen, T-Cell, alpha-beta, Malaria, Cerebral, CD8-Positive T-Lymphocytes, Cross-Priming, Mice, Microvessels, Parasite Load
About these checks
Registry, retraction, Cites and statistics results are computed, not judged, with one exception: a printed reference that no index lists is read once by a model before it counts as a citation error. Claims are extracted by a model and kept only when their quote appears verbatim in the text; each cited source is then checked, with a model’s help, for whether it says what the claim relies on. Those verdicts can be wrong — read the claim’s quote and the cited source before relying on one.
Statistics and arithmetic are recomputed, not judged.
Confidence bands are shown only for fields calibrated on our annotated test set. None is calibrated yet, so no band is shown.
What counts as a claim ›How we measure confidence ›How we check this ›
Are you an author, or do you see a problem with this page? Request a review
