

The DOI matches its Crossref record; 51 of the 51 references it cites were found in a registry or an index; none of the 45 sources its claims cite is checked for support yet.
Regular Strength and Sprint Training Counteracts Bone Aging: A 10‐Year Follow‐Up in Male Masters Athletes
Open accessAbstract
Cross‐sectional and interventional studies suggest that high‐intensity strength and impact‐type training provide a powerful osteogenic stimulus even in old age. However, longitudinal evidence on the ability of high‐intensity training to attenuate age‐related bone deterioration is currently lacking. This follow‐up study assessed the role of continued strength and sprint training on bone aging in 40‐ to 85‐year‐old male sprinters ( n = 69) with a long‐term training background. Peripheral quantitative computed tomography (pQCT)‐derived bone structural, strength, and densitometric parameters of the distal tibia and tibia midshaft were assessed at baseline and 10 years later. The groups of well‐trained (actively competing, sprint training including strength training ≥2 times/week; n = 36) and less‐trained (<2 times/week, no strength training, switched to endurance training; n = 33) athletes were formed according to self‐reports at follow‐up. Longitudinal changes in bone traits in the two groups were examined using linear mixed models. Over the 10‐year period, group‐by‐time interactions were found for distal tibia total bone mineral content (BMC), trabecular volumetric bone mineral density (vBMD), and compressive strength index, and for mid‐tibia cortical cross‐sectional area, medullary area, total BMC, and BMC at the anterior and posterior sites (polar mass distribution analysis) ( p < 0.05). These interactions reflected maintained (distal tibia) or improved (mid‐tibia) bone properties in the well‐trained and decreased bone properties in the less‐trained athletes over the 10‐year period. Depending on the bone variable, the difference in change in favor of the well‐trained group ranged from 2% to 5%. The greatest differences were found in distal tibia trabecular vBMD and mid‐tibia posterior BMC, which remained significant ( p < 0.05) after adjustment for multiple testing. In conclusion, our longitudinal findings indicate that continued strength and sprint training is associated with maintained or even improved tibial properties in middle‐aged and older male sprint athletes, suggesting that regular, intensive exercise counteracts bone aging. © 2021 The Authors. JBMR Plus published by Wiley Periodicals LLC on behalf of American Society for Bone and Mineral Research.
Overview
CoChat Summary
TL;DR
In this 10-year follow-up of 69 male masters sprinters, continued regular strength and sprint training was associated with maintained or improved tibial bone properties, whereas less-trained athletes showed declines. The authors conclude that regular intensive exercise counteracts bone aging, though the observational design limits causal inference.
Key findings
- Over 10 years, group × time interactions (raw p < 0.05) were found for distal tibia total BMC, trabecular vBMD, and compressive strength index, and for mid-tibia cortical CSA, medullary CSA, total BMC, and anterior/posterior BMC; these reflected maintained or improved bone properties in well-trained athletes and decreased properties in less-trained athletes.
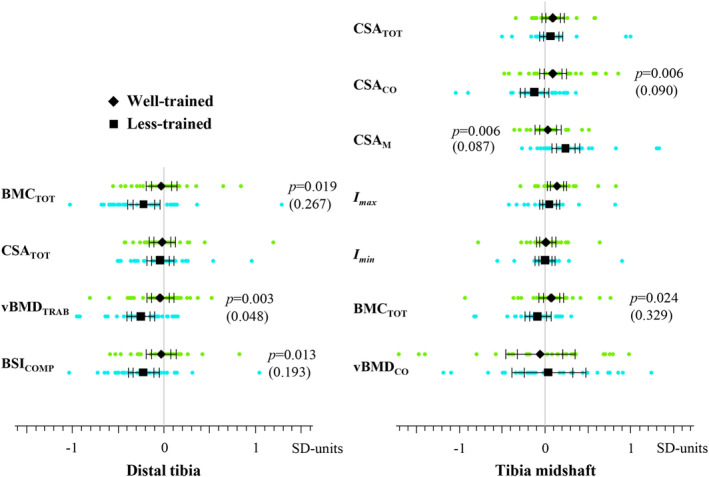
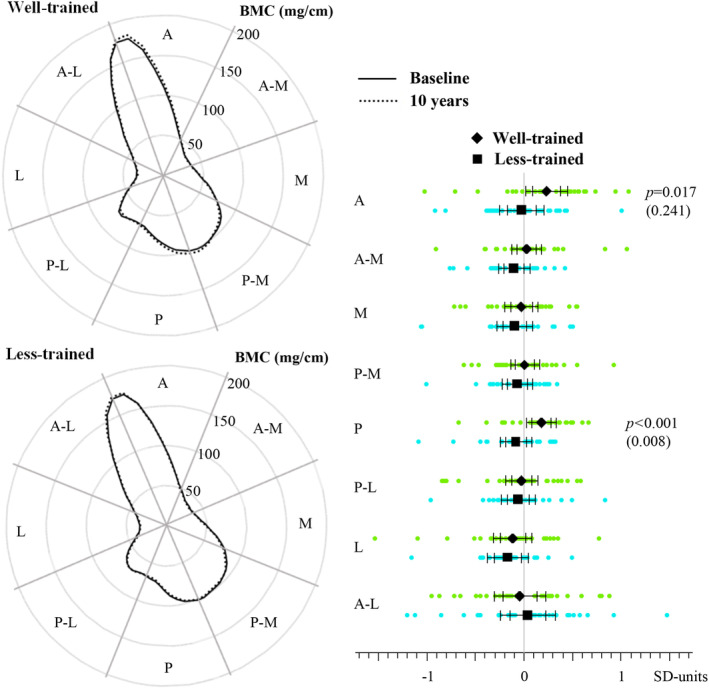
- Depending on the bone variable, the difference in change favoring the well-trained group ranged from 2% to 5%. The greatest differences were distal tibia trabecular vBMD (2.8% difference; maintained in well-trained vs −3.2% in less-trained; adjusted p = 0.048) and mid-tibia posterior BMC (5.1% difference; adjusted p = 0.008).
- Other distal tibia changes: total BMC and compressive strength index were maintained in well-trained athletes but decreased by 3.5% and 5.9% in less-trained athletes, with differences of 3.1% and 5.2% favoring the well-trained group. Mid-tibia changes: cortical CSA increased +1.1% in well-trained vs −1.4% in less-trained, total BMC +0.8% vs −0.9%, and medullary CSA was maintained vs +4.9% in less-trained, with differences of 2.5%, 1.8%, and 4.2%, respectively; these were not significant after multiple-testing adjustment.
- In exploratory age-group analyses, 40–64-year-olds showed differences favoring well-trained athletes of 3.2% for distal total BMC, 3.5% for trabecular vBMD, and 5.9% for compressive strength index; 65–85-year-olds showed differences of 4.1% for mid-tibia cortical CSA, 5.3% for medullary CSA, and 6.2% for posterior BMC.
Methods
- Design: 10-year longitudinal follow-up of male masters sprinters aged 40–85 years with a long-term training background. Baseline n = 83; follow-up n = 69 (83%). At follow-up, athletes were categorized by self-reported training/competition status into well-trained (actively competing, sprint training including strength training ≥2 times/week; n = 36) and less-trained (<2 times/week, no strength training, switched to endurance training; n = 33).
- Measurements: peripheral quantitative computed tomography (pQCT) of the distal tibia (5% site) and tibial midshaft (50% site) at baseline and follow-up, including structural, strength, densitometric, and polar mass distribution parameters; muscle CSA, anthropometry, health/training questionnaires, and 60-m sprint time were also assessed. Mean follow-up was 9.8 ± 0.2 years.
- Analysis: linear mixed models with group × time interaction adjusted for age; multiple-testing correction used an effective number of 16 comparisons from 19 outcomes, giving a Meff-Šidák-adjusted alpha of 0.00317. Sensitivity analyses examined age groups 40–64 and 65–85 years and compared longitudinal changes with cross-sectional predictions.
Limitations
- Stated: the study is observational, so only associations rather than causal relationships can be reported; possible influences of genetics or diseases cannot be fully excluded; group allocation was based on self-reported physical activity, though recall bias was considered less likely in this athlete population; there were no sedentary controls, so direct comparisons with non-exercisers cannot be made; age-group analyses were exploratory/hypothesis-generating, and the sample size was not sufficient for more fine-grained age-group analyses; many bone variables were analyzed, so results are presented both raw and multiple-testing corrected.
- Stated: 15 participants could not attend the main follow-up visit; their pQCT data were later obtained during a bone examination in the same laboratory at the World Masters Indoor Championships.
- Evident from the text: follow-up grouping depended on training status at follow-up rather than at baseline, so reverse causation or selection effects cannot be excluded; for some participants, follow-up pQCT scans occurred at a different time/event than the main follow-up visit, which may introduce timing differences.
Model-written summary. Check it against the paper before relying on it.
Integrity signals
Registry
Cites
Statistics
Figures
Verification
Claims the paper makes
0 Valid · 1 Not valid · 31 Not checked · 75 Own results and interpretations
A result the paper states — it cites no source for it, so there is none to check. The quote shows it is in the paper.
In the paper
“The adaptations at the mid‐tibia site were manifested as increased direction‐specific bone mass, which reflects the site‐specific nature of the observed increase in BMCTOT and cortical area.”
§ Regular Strength and Sprint Training Counteracts Bone Aging: A 10‐Year Follow‐Up in Male Masters Athletes > Discussion
plainstates an association- Asserted: passes — The authors put it forward as true.
- Checkable: passes — It can be checked against evidence.
- Load-bearing: passes — The paper’s conclusions depend on it.
- Based: passes — The paper gives a reason why it holds.
A result the paper states — it cites no source for it, so there is none to check. The quote shows it is in the paper.
In the paper
“In contrast to the changes at the distal site, we observed more pronounced structural improvements at the mid‐tibia site in the 65‐ to 85‐year‐olds,”
§ Regular Strength and Sprint Training Counteracts Bone Aging: A 10‐Year Follow‐Up in Male Masters Athletes > Discussion
plain- Asserted: passes — The authors put it forward as true.
- Checkable: passes — It can be checked against evidence.
- Load-bearing: passes — The paper’s conclusions depend on it.
- Based: passes — The paper gives a reason why it holds.
A result the paper reports from its own data — it cites no other source for it, so there is none to check. The quote shows it is in the paper.
In the paper
“At follow‐up, the mean difference in the change in vBMDTRAB in favor of the well‐trained was 2.8% (Fig. 1).”
§ Regular Strength and Sprint Training Counteracts Bone Aging: A 10‐Year Follow‐Up in Male Masters Athletes > Results > Bone traits
plain- Asserted: passes — The authors put it forward as true.
- Checkable: passes — It can be checked against evidence.
- Load-bearing: passes — The paper’s conclusions depend on it.
- Based: passes — The paper gives a reason why it holds.
A result the paper reports from its own data — it cites no other source for it, so there is none to check. The quote shows it is in the paper.
In the paper
“Depending on the bone variable, the difference in change in favor of the well‐trained group ranged from 2% to 5%.”
§ Regular Strength and Sprint Training Counteracts Bone Aging: A 10‐Year Follow‐Up in Male Masters Athletes > Abstract
plainstates an association- Asserted: passes — The authors put it forward as true.
- Checkable: passes — It can be checked against evidence.
- Load-bearing: passes — The paper’s conclusions depend on it.
- Based: passes — The paper gives a reason why it holds.
A result the paper reports from its own data — it cites no other source for it, so there is none to check. The quote shows it is in the paper.
In the paper
“The polar mass distribution of the tibial shaft showed a significant group × time interaction at the anterior and the posterior sites (Table 4 and Fig. 2).”
§ Regular Strength and Sprint Training Counteracts Bone Aging: A 10‐Year Follow‐Up in Male Masters Athletes > Results > Bone traits
plainstates an association- Asserted: passes — The authors put it forward as true.
- Checkable: passes — It can be checked against evidence.
- Load-bearing: passes — The paper’s conclusions depend on it.
- Based: passes — The paper gives a reason why it holds.
29 more claims
Create a free account to see all 107 claims and to verify the 44 references still open.
- It may state two separate claims as one. 54
- The quote only partly states this claim. 5
- Probably not a substantial claim. 30
Self-check
Percentages, sums and reported differences re-computed from the paper’s own numbers.
Each contradiction between two passages listed here was confirmed by an independent check.
Rated major: it would touch a result — a value a result rests on, reported and recomputed p-values on opposite sides of the significance level, two passages that conflict with no sign which is right, or a cited work retracted before this paper was published.
In the paper
“| CSATOT (mm2) | WT | 518 | 6.0 | 0.6 | 11.5 | 0.724 | −3.0 | 15.0 | 1.000 |”
§ Regular Strength and Sprint Training Counteracts Bone Aging: A 10‐Year Follow‐Up in Male Masters Athletes > Results > Bone traits
Reported 518 · recomputed 621
Rated minor: it would not touch a result — a value no result rests on, a p-value that stays on the same side of the significance level, or a conflict that is clerical, resolved elsewhere in the paper, or outside its own findings.
In the paper
§ Regular Strength and Sprint Training Counteracts Bone Aging: A 10‐Year Follow‐Up in Male Masters Athletes > Results > Bone traits
“A significant group × time interaction was found for CSACO (p = 0.006, raw value) and BMCTOT (p = 0.019, raw value).”
§ Regular Strength and Sprint Training Counteracts Bone Aging: A 10‐Year Follow‐Up in Male Masters Athletes > Results > Bone traits
“| BMCTOT (mg/mm) | WT | 508 | 4.3 | −1.1 | 9.6 | 0.024 | −4.6 | 13.1 | 0.329 |”
Rated minor: it would not touch a result — a value no result rests on, a p-value that stays on the same side of the significance level, or a conflict that is clerical, resolved elsewhere in the paper, or outside its own findings.
In the paper
§ Regular Strength and Sprint Training Counteracts Bone Aging: A 10‐Year Follow‐Up in Male Masters Athletes > Results > Physical and training characteristics
“| CSAM (mm2) | 177 (43) | 183 (44) | 178 (47) | 195 (45) e |”
§ Regular Strength and Sprint Training Counteracts Bone Aging: A 10‐Year Follow‐Up in Male Masters Athletes > Results > Bone traits
“| CSAM (mm2) | WT | 205 | 1.5 | −2.8 | 5.8 | 0.006 | −5.6 | 8.5 | 0.087 |”
Citations
Cites
Nyholt, D. R. (2004) · The American Journal of Human Genetics · doi:10.1086/383251 · Cited by 1,699
Tanaka, H., & Seals, D. R. (2008) · The Journal of Physiology · doi:10.1113/jphysiol.2007.141879 · Cited by 554
Muscle, Bone, and Fat Crosstalk: The Biological Role of Myokines, Osteokines, and Adipokines
Kirk, B., Feehan, J., Lombardi, G., & Duque, G. (2020) · Current Osteoporosis Reports · doi:10.1007/s11914-020-00599-y · Cited by 510
Haapasalo, H., Kontulainen, S., Sievänen, H., Kannus, P., Järvinen, M., & Vuori, I. (2000) · Bone · doi:10.1016/s8756-3282(00)00331-8 · Cited by 502
Nikander, R., Sievänen, H., Heinonen, A., Daly, R. M., Uusi-Rasi, K., & Kannus, P. (2010) · BMC Medicine · doi:10.1186/1741-7015-8-47 · Cited by 479
Self-citationA simple correction for multiple comparisons in interval mapping genome scans
Cheverud, J. M. (2001) · Heredity · doi:10.1046/j.1365-2540.2001.00901.x · Cited by 421
Aging, muscle fiber type, and contractile function in sprint-trained athletes
Korhonen, M. T., Cristea, A., Alén, M., Häkkinen, K., Sipilä, S., Mero, A., Viitasalo, J. T., Larsson, L., & Suominen, H. (2006) · Journal of Applied Physiology · doi:10.1152/japplphysiol.00299.2006 · Cited by 302
Self-citationUsing the Delta Method for Approximate Interval Estimation of Parameter Functions in SEM
Raykov, T., & Marcoulides, G. A. (2004) · Structural Equation Modeling A Multidisciplinary Journal · doi:10.1207/s15328007sem1104_7 · Cited by 250
Physical activity, aging, and physiological function
Harridge, S. D. R., & Lazarus, N. R. (2017) · Physiology · doi:10.1152/physiol.00029.2016 · Cited by 214
Muscle-bone interactions: From experimental models to the clinic? A critical update
Laurent, M. R., Dubois, V., Claessens, F., Verschueren, S., Vanderschueren, D., Gielen, E., & Jardí, F. (2015) · Molecular and Cellular Endocrinology · doi:10.1016/j.mce.2015.10.017 · Cited by 160
Cited by
Zhang, L., Guan, Q., Wang, Z., Feng, J., Zou, J., & Gao, B. (2023) · Aging and Disease · doi:10.14336/ad.2023.1115 · Cited by 79
Savikangas, T., Suominen, T. H., Alén, M., Rantalainen, T., & Sipilä, S. (2023) · Bone · doi:10.1016/j.bone.2023.116951 · Cited by 16
Self-citationEffect of external mechanical stimuli on human bone: a narrative review
Mancuso, M. E., Wilzman, A. R., Murdock, K. E., & Troy, K. L. (2021) · Progress in Biomedical Engineering · doi:10.1088/2516-1091/ac41bc · Cited by 16
Skeletal phenotypes and molecular mechanisms in aging mice
Guan, Q., 上海体育大学运动健康学院, 上. 2., Zhang, Y., Wang, Z., Liu, X.-H., Zou, J., & Zhang, L.-L. (2024) · 动物学研究 · doi:10.24272/j.issn.2095-8137.2023.397 · Cited by 13
A 10‐Year Longitudinal Study of Muscle Morphology and Performance in Masters Sprinters
Hendrickse, P. W., Hutz, B., Korhonen, M. T., & Degens, H. (2025) · Journal of Cachexia Sarcopenia and Muscle · doi:10.1002/jcsm.13822 · Cited by 8
Self-citation
Metadata
- Authors
- Suominen, T. H., Alén, M., Törmäkangas, T., Degens, H., Rittweger, J., Heinonen, A., Suominen, H., & Korhonen, M. T.
- Affiliations
- University of Jyväskylä (FI)
- Oulu University Hospital (FI)
- Manchester Metropolitan University (GB)
- University of Cologne (DE)
- Corresponding author
- Suominen, Tuuli H
- ORCID
- Venue
- JBMR Plus
- Publisher
- Oxford University Press (OUP)
- Published
- 2021-05-24
- Volume
- 5
- Issue
- 7
- Pages
- e10513-e10513
- ISSN
- 2473-4039 (ISSN-L)
- PMC
- PMC8260815
- OpenAlex
- W3160686498
- Semantic Scholar
- b9046a48ddca4a04b897925d07219b4483000e4d
- Cited by
- 17
- References
- 51
- Citations by year
- 2026: 2 · 2025: 5 · 2024: 4 · 2023: 2 · 2022: 2 · 2021: 1
- FWCI
- 2.11
- Type
- journal article
- Language
- en
- Open access
- gold
- doi.org
- Licence
- Locations
- JBMR Plus (publishedVersion, cc-by)
- PubMed (publishedVersion)
- Kölner Universitäts PublikationsServer (Universität zu Köln) (publishedVersion)
- PubMed Central (publishedVersion, cc-by)
- e-space (Manchester Metropolitan University) (acceptedVersion)
- Jyväskylä University Digital Archive (University of Jyväskylä) (submittedVersion, cc-by)
- DOAJ (DOAJ: Directory of Open Access Journals) (submittedVersion, cc-by-sa)
- Funders
- Academy of Finland (250683)
- Alfred Kordelin Foundation
- Ellen and Artturi Nyyssönen Foundation
- Juho Vainio Foundation
- Ministry of Education and Culture, Finland
- Päivikki and Sakari Sohlberg Foundation
- Suomen Kulttuurirahasto
- Yrjö Jahnsson Foundation
- Topics
- Health Sciences › Medicine › Orthopedics and Sports Medicine › Bone health and osteoporosis research
- Health Sciences › Medicine › Orthopedics and Sports Medicine › Sports Performance and Training
- Physical Sciences › Engineering › Biomedical Engineering › Lower Extremity Biomechanics and Pathologies
- Keywords
- bone aging, resistance training, sprint training, masters athletes, tibia, bone mineral density, trabecular bone, cortical bone, bone mineral content, exercise and bone health, endurance training, longitudinal bone changes
About these checks
Registry, retraction, Cites and statistics results are computed, not judged, with one exception: a printed reference that no index lists is read once by a model before it counts as a citation error. Claims are extracted by a model and kept only when their quote appears verbatim in the text; each cited source is then checked, with a model’s help, for whether it says what the claim relies on. Those verdicts can be wrong — read the claim’s quote and the cited source before relying on one.
A language model drew the claims from the paper on 2026-11-14, under version 3 of the claim definition (model deepseek-v4.1-flash, prompt extract-v3).
A second model labelled each claim on 2026-11-14 (model jev-1.13-20260917, definition revision gold-guideline-v0.2).
Statistics and arithmetic are recomputed, not judged.
Confidence bands are shown only for fields calibrated on our annotated test set. None is calibrated yet, so no band is shown.
What counts as a claim ›How we measure confidence ›How we check this ›
Are you an author, or do you see a problem with this page? Request a review
How to cite
Cite CoChat for the checks on this page, and the paper for its own findings.
- This page
- CoChat. (2026). Citation check: Regular Strength and Sprint Training Counteracts Bone Aging: A 10‐Year Follow‐Up in Male Masters Athletes. https://app.cochat.ai/papers/10.1002/jbm4.10513
- The paper
- Suominen, T. H., Alén, M., Törmäkangas, T., Degens, H., Rittweger, J., Heinonen, A., Suominen, H., & Korhonen, M. T. (2021). Regular Strength and Sprint Training Counteracts Bone Aging: A 10‐Year Follow‐Up in Male Masters Athletes. JBMR Plus. https://doi.org/10.1002/jbm4.10513
Data sources
Bibliographic data: Semantic Scholar, OpenAlex, Crossref.
Contains information from the Semantic Scholar Academic Graph Datasets, made available under the ODC Attribution License (ODC-BY 1.0).
Semantic Scholar’s data is described in: Kinney, R., et al. (2023). The Semantic Scholar Open Data Platform. arXiv:2301.10140.
