

The DOI matches its Crossref record; 50 of the 50 references it cites were found in a registry or an index.
PBPK Models for CYP3A4 and P‐gp DDI Prediction: A Modeling Network of Rifampicin, Itraconazole, Clarithromycin, Midazolam, Alfentanil, and Digoxin
Open accessAbstract
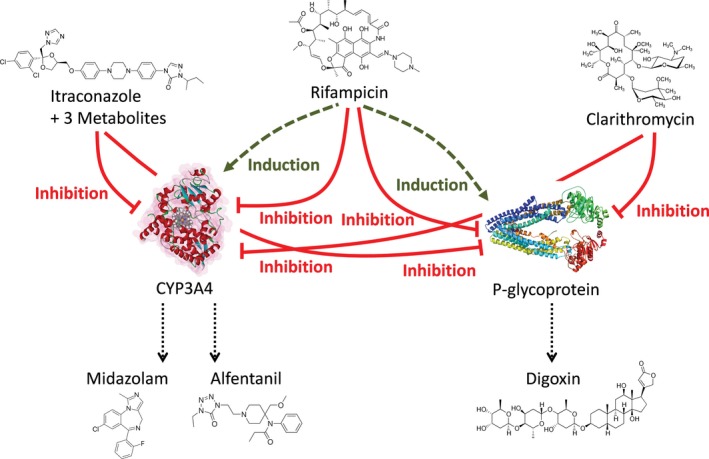
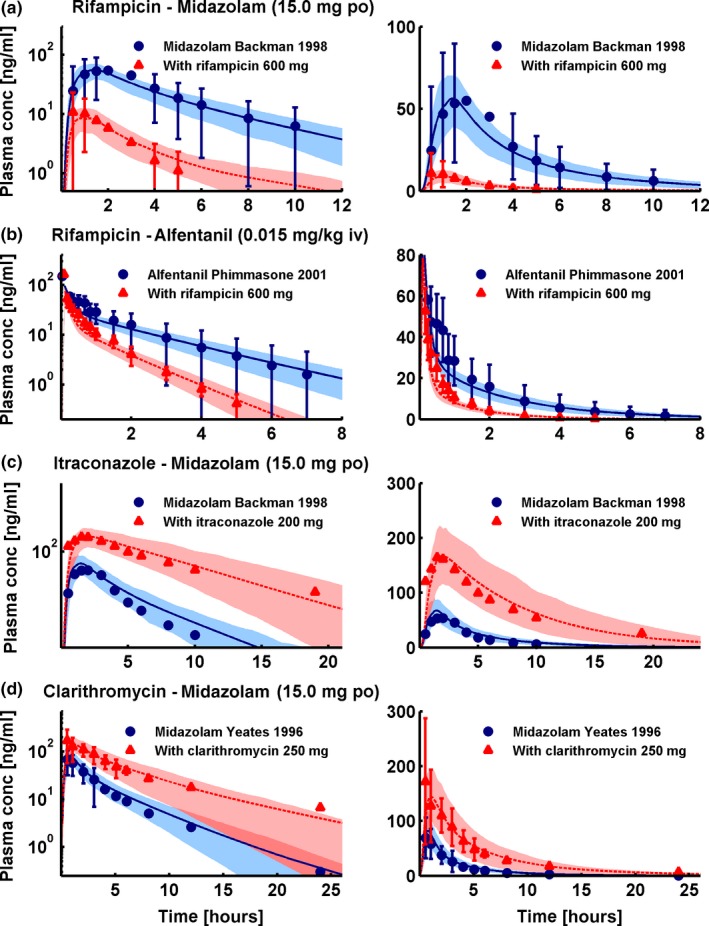
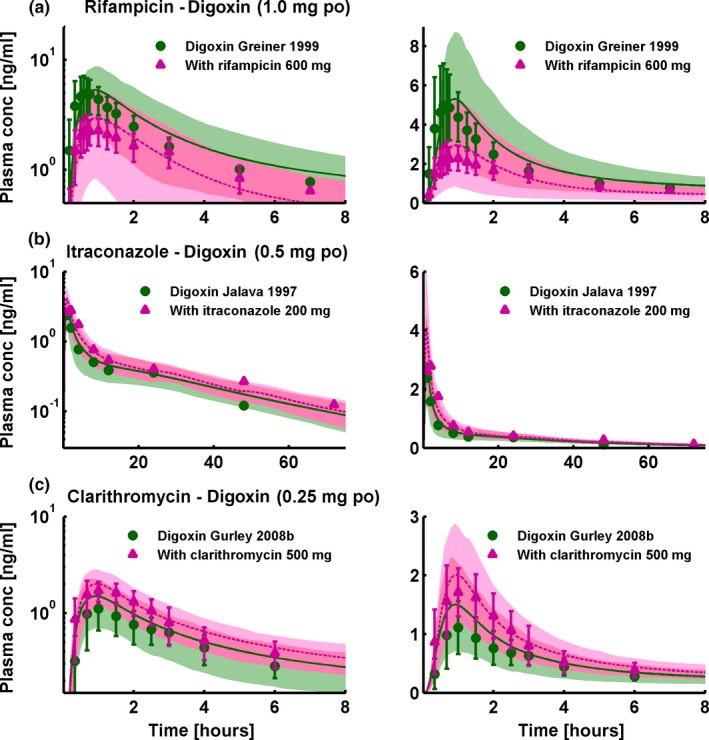
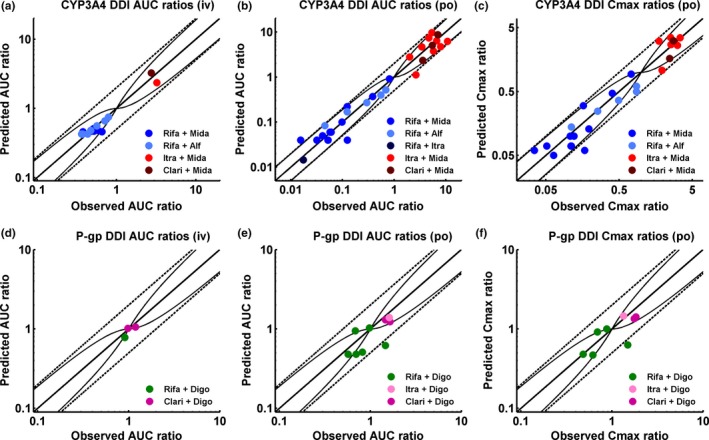
According to current US Food and Drug Administration ( FDA ) and European Medicines Agency ( EMA ) guidance documents, physiologically based pharmacokinetic ( PBPK ) modeling is a powerful tool to explore and quantitatively predict drug‐drug interactions ( DDI s) and may offer an alternative to dedicated clinical trials. This study provides whole‐body PBPK models of rifampicin, itraconazole, clarithromycin, midazolam, alfentanil, and digoxin within the Open Systems Pharmacology ( OSP ) Suite. All models were built independently, coupled using reported interaction parameters, and mutually evaluated to verify their predictive performance by simulating published clinical DDI studies. In total, 112 studies were used for model development and 57 studies for DDI prediction. 93% of the predicted area under the plasma concentration‐time curve ( AUC ) ratios and 94% of the peak plasma concentration (C max ) ratios are within twofold of the observed values. This study lays a cornerstone for the qualification of the OSP platform with regard to reliable PBPK predictions of enzyme‐mediated and transporter‐mediated DDI s during model‐informed drug development. All presented models are provided open‐source and transparently documented.
Overview
The claims and statistics of this paper haven’t been checked yet.
Run the check — free, no account needed. It reads the open-access text and checks the sources it cites.
Integrity signals
Registry
Cites
Statistics
Figures
Verification
Claims the paper makes
The claims and statistics of this paper haven’t been checked yet.
Run the check — free, no account needed. It reads the open-access text and checks the sources it cites.
Claims other papers make about this one
Each is checked against this paper’s own text: does it say what the citing paper says it does?
In the citing paper
“These findings overall were within the regulatory acceptance margin of error which is 20% to 50% for these types of DDI assessments.12”
From GLP-1RA-induced delays in gastrointestinal motility: Predicted effects on coadministered drug absorption by PBPK analysis (2025) · cites this paper as [12]
In the citing paper
“For reference, PBPK models generally achieve AUC ratio predictions within 20% to 50% error for well-characterized DDIs.12”
From GLP-1RA-induced delays in gastrointestinal motility: Predicted effects on coadministered drug absorption by PBPK analysis (2025) · cites this paper as [12]
Self-check
Percentages, sums and reported differences re-computed from the paper’s own numbers.
The self-check needs the paper’s full text.
Citations
Cites
Basic anatomical and physiological data for use in radiological protection: reference values
Valentin, J. (2002) · Annals of the ICRP · doi:10.1016/s0146-6453(03)00002-2 · Cited by 2,024
CYTOCHROME P-450 3A4: Regulation and Role in Drug Metabolism
Guengerich, F. P. (1999) · The Annual Review of Pharmacology and Toxicology · doi:10.1146/annurev.pharmtox.39.1.1 · Cited by 1,271
The role of intestinal P-glycoprotein in the interaction of digoxin and rifampin
Greiner, B., Eichelbaum, M. F., Fritz, P., Kreichgauer, H. P., von Richter, O., Zundler, J., & Kroemer, H. K. (1999) · Journal of Clinical Investigation · doi:10.1172/jci6663 · Cited by 917
Lown, K. S., Mayo, R. R., Leichtman, A. B., Hsiao, H.-L., Turgeon, D. K., Schmiedlin‐Ren, P., Brown, M. B., Guo, W.-S., Rossi, S. J., Benet, L. Z., et al. (1997) · Clinical Pharmacology & Therapeutics · doi:10.1016/s0009-9236(97)90027-8 · Cited by 679
Applied Concepts in PBPK Modeling: How to Build a PBPK/PD Model
Kuepfer, L., Niederalt, C., Wendl, T., Schlender, J., Willmann, S., Lippert, J., Block, M., Eissing, T., & Teutonico, D. (2016) · CPT: Pharmacometrics & Systems Pharmacology · doi:10.1002/psp4.12134 · Cited by 425
Self-citationOlkkola, K. T., Backman, J. T., & Neuvonen, P. J. (1994) · Clinical Pharmacology & Therapeutics · doi:10.1038/clpt.1994.60 · Cited by 413
Gorski, J. C., Jones, D. R., HAEHNERDANIELS, B., Hamman, M. A., O'Mara, E. M., & Hall, S. D. (1998) · Clinical Pharmacology & Therapeutics · doi:10.1016/s0009-9236(98)90146-1 · Cited by 409
Nishimura, M., YAGUTI, H., YOSHITSUGU, H., Naito, S., & Satoh, T. (2003) · YAKUGAKU ZASSHI · doi:10.1248/yakushi.123.369 · Cited by 313
ROLE OF ITRACONAZOLE METABOLITES IN CYP3A4 INHIBITION
Isoherranen, N., Kunze, K. L., Allen, K. E., Nelson, W. L., & Thummel, K. E. (2004) · Drug Metabolism and Disposition · doi:10.1124/dmd.104.000315 · Cited by 276
Research works printed but not linked: 2
- U.S. Food and Drug Administration, 2017, Clinical Drug Interaction Studies – Study Design, Data Analysis, and Clinical Implications
- European Medicines Agency, 2012, Guideline on the Investigation of Drug Interactions. CPMP/EWP/560/95/Rev. 1 Corr. 2**
Cited by
Sorted by citations
Items 101–169 of 169
Schaller, S., Michon, I. N., Baier, V., Martins, F. S., Nolain, P., & Taneja, A. (2024) · Drugs in R&D · doi:10.1007/s40268-024-00495-1 · Cited by 6
“Thus, the empirical uniform scaling of the K i values utilised in the CsA DDI assessment with RSV was further assessed with the P-gp substrate digoxin [39].”
Ru, Z., Wu, Y., Shao, J., Yin, J., Qian, L., & Miao, X. (2023) · Briefings in Bioinformatics · doi:10.1093/bib/bbad271 · Cited by 6
Du, P., Wang, A., Ma, Y., Jia, A., Li, Y., & Li, X. (2021) · Clinical Therapeutics · doi:10.1016/j.clinthera.2021.02.005 · Cited by 6
Lehmann, A., Geburek, I., Hessel‐Pras, S., Enge, A., Mielke, H., Müller‐Graf, C., Kloft, C., & Hethey, C. (2024) · Archives of Toxicology · doi:10.1007/s00204-024-03698-2 · Cited by 5
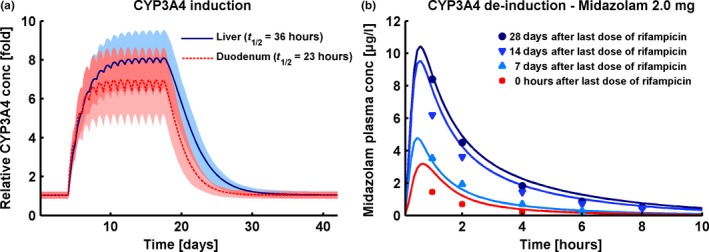
“This prediction is comparable to that of previously published rifampicin PBPK models with equivalent dosing regimens (8-and 7-fold in liver and duodenum, Hanke et al. (2018) and 5.5-and 6.5-fold in liver and jejunum, Baneyx et al. (2014)).”
InfluentialPerrier, J., Gualano, V., Helmer, E., Namour, F., Lukáčová, V., & Taneja, A. (2023) · Clinical and Translational Science · doi:10.1111/cts.13622 · Cited by 5
“25,26 They may be deployed to investigate potential clinical scenarios in cases where dedicated trials are not always possible, or help to optimize the design of clinical DDI studies 22 CYP3A4 was the major enzyme identified in vitro for the metabolism of ziritaxestat.”
BackgroundGao, D., Wang, G., Wu, H., & Ren, J. (2023) · Scientific Reports · doi:10.1038/s41598-023-43258-9 · Cited by 5
Shen, C., Yang, H., Shao, W., Zheng, L., Zhang, W., Xie, H., Jiang, X., & Wang, L. (2024) · Pharmaceutical Research · doi:10.1007/s11095-024-03680-8 · Cited by 7
“4 [25, 26]: S represents sensitivity, ∆PK indicates the change in AUC 0-t or C max , P denotes the original value, and ∆P signifies the change in the examined value.”
Huynh, C., Dingemanse, J., zu Schwabedissen, H. E. M., Fonseca, M., & Sidharta, P. N. (2024) · Clinical and Translational Science · doi:10.1111/cts.13883 · Cited by 5
“39, 40 Such a mechanistic tool can be utilized to make predictions that are physiologically driven, as for example it can account for enzyme abundance and function, blood flow, PK variability across patients, and other biological processes.”
MethodSchuck, E. L., Ferry, J., Gidal, B. E., & Hussein, Z. (2020) · Acta Neurologica Scandinavica · doi:10.1111/ane.13286 · Cited by 4
Next-generation experimental and computational strategies for drug-drug interaction prophecy
Kanukolanu, A., Nalla, L. V., & Gajula, S. N. R. (2025) · Drug Metabolism and Disposition · doi:10.1016/j.dmd.2025.100150 · Cited by 4
Chen, Y., Shao, W., Wang, X., Geng, K., Wang, W., Li, Y., Liu, Z., & Xie, H. (2024) · Pharmaceutical Research · doi:10.1007/s11095-024-03789-w · Cited by 4
Srinivasan, M., Hirani, R., Tsiu, M., Kabani, K., Chaturvedula, A., & Palasik, B. N. (2019) · Therapeutic Drug Monitoring · doi:10.1097/ftd.0000000000000704 · Cited by 4
Agyemang, A. A., Farrell, C. B., Moore, W., & Parkin, J. (2020) · CPT Pharmacometrics & Systems Pharmacology · doi:10.1002/psp4.12565 · Cited by 4
Alasmari, M. S., Alasmari, F. F., Alasmari, A. F., Alshamsan, A., Alsanea, S., Rasool, M. F., & Alqahtani, F. (2022) · Pharmaceutics · doi:10.3390/pharmaceutics14091795 · Cited by 4
“In addition, the effects of drug interactions on biological exposure can be predicted using the PBPK modeling, which leads to proper dosing adjustment and avoids the unwanted effects of such interactions [26,27].”
BackgroundNi, L., Zheng, L., Liu, Y., Xu, W., Zhao, Y., Wang, L., Zhang, Q., Hu, W. M., & Chen, X. (2023) · Advances in Therapy · doi:10.1007/s12325-023-02602-1 · Cited by 4
Darwish, M., Youakim, J. M., Darling, I. M., Lukáčová, V., Owen, J. S., & Bradley, H. (2024) · Clinical Therapeutics · doi:10.1016/j.clinthera.2023.12.007 · Cited by 4
Ni, L., Cao, Z., Jiang, J., Zhang, W., Hu, W. M., Zhang, Q., Shen, C., Chen, X., & Zheng, L. (2024) · Pharmaceuticals · doi:10.3390/ph17050640 · Cited by 4
“Fentanyl, sufentanil, and alfentanil PBPK models were supplied as OSP templates and already validated in previous studies [26,31].”
MethodSchaller, S., Martins, F. S., Balazki, P., Böhm, S., Baumgart, J., Hilger, R. A., Beelen, D. W., Hemmelmann, C., & Ring, A. (2021) · British Journal of Clinical Pharmacology · doi:10.1111/bcp.15081 · Cited by 4
Zhao, M., Chen, Y., Yang, D. L., Lyu, C., Bian, X., Li, X., Qiu, W., Huang, Z., Hu, Z., & Zhang, J. (2021) · CPT Pharmacometrics & Systems Pharmacology · doi:10.1002/psp4.12716 · Cited by 4
Cao, Z., Wang, Z., Zhang, Q., Zhang, W., Zheng, L., & Hu, W. M. (2025) · Pharmaceuticals · doi:10.3390/ph18030425 · Cited by 3
Zhu, S., Ding, Y., Wang, X., & Wang, X. (2024) · The Journal of Clinical Pharmacology · doi:10.1002/jcph.6111 · Cited by 3
Chen, Y., Liu, Z., Li, Y., Wang, W., Chen, T. K., Li, S., Wu, Y., & Xie, H. (2025) · Pharmacotherapy The Journal of Human Pharmacology and Drug Therapy · doi:10.1002/phar.70050 · Cited by 3
“The binding of DIG to the ATPase Na+/K+ transport subunit alpha 2 (ATP1A2) is critical, mechanistically explaining its large volume of distribution and long plasma half-life [41].”
Abdullah-Koolmees, H., van den Nieuwendijk, J. F., ten Hoope, S., de Leeuw, D. C., Franken, L. G. W., Said, M. M., Seefat, M. R., Swart, E. L., Hendrikse, N. H., & Bartelink, I. H. (2024) · European Journal of Drug Metabolism and Pharmacokinetics · doi:10.1007/s13318-024-00916-1 · Cited by 3
“2 [25–27].”
Chen, J., Li, J., Wu, J., Song, Y., Li, L., Zhang, J., & Dong, R. (2024) · Pharmacology Research & Perspectives · doi:10.1002/prp2.1252 · Cited by 2
“19,21 The AUC extrapolation for midazolam in this part was 25–29%, slightly higher than the ideal 20% extrapolation of AUC.”
BackgroundSilva, A., Mourão, J. I. D. B., & Vale, N. (2025) · International Journal of Molecular Sciences · doi:10.3390/ijms26041506 · Cited by 2
“On the other hand, the PBPK model results developed to predict pharmacokinetic interactions between lidocaine, propofol, paracetamol, and rocuronium provide a comprehensive view of potential drug–drug interactions during the perioperative period [76,77].”
Nakayama, K., Negoro, T., Takubo, H., Hayashi, A., Taniguchi, T., Nomura, Y., & Iwanaga, K. (2025) · Xenobiotica · doi:10.1080/00498254.2025.2518239 · Cited by 2
“According to previous reports, the fold induction of rifampicin at 600 mg was 7.8 (liver) and 6.7 (intestine) as CYP3A4 activity based on clinical PBPK model simulations (Hanke et al. 2018).”
InfluentialA Modeling Investigation of the CYP1A Drug Interactions of Riluzole
Malik, P. R. V., Mian, P., Andrews, J. A., Rosebraugh, M., & Ajroud‐Driss, S. (2025) · Clinical and Translational Science · doi:10.1111/cts.70358 · Cited by 2
“…of CYP1A1 in the intestinal mucosa was increased by a factor of 2 based on a review of data in the Human Protein Atlas (www. prote inatl as. org), and the expression of P-gp in intestinal mucosa was adjusted according to the standard from the PK-Sim DDI networks as described elsewhere [22].”
Zhang, Y., Liu, Y. T., He, H., & Hao, K. (2026) · Pharmaceutics · doi:10.3390/pharmaceutics18010112 · Cited by 2
“In addition, numerous drug–drug interactions (DDIs) mediated by P-gp have been studied [15,22,49,51,54], whereas the current model focuses solely on digoxin monotherapy rather than co-medications.”
Alasmari, M. S., Alqahtani, F., Alasmari, F. F., & Alsultan, A. (2024) · Pharmaceutics · doi:10.3390/pharmaceutics16121540 · Cited by 2
“In proportion to healthy”
Kanacher, T., Sjögren, E., Korell, J., Plan, E. L., Gómez‐Mantilla, J. D., & Ince, I. (2025) · Pharmaceutics · doi:10.3390/pharmaceutics17030314 · Cited by 2
“…of inhibition of CYP3A4 metabolism on BI 730357 pharmacokinetics as a victim drug when the itraconazole model template, including its 4 metabolites [29] and inhibition constants described in the literature, was applied as a perpetrator (Figure 6). metabolism on BI 730357 pharmacokinetics as a…”
Matsson, E. M., Desch, M., Nock, V., & Hanke, N. (2025) · CPT Pharmacometrics & Systems Pharmacology · doi:10.1002/psp4.70060 · Cited by 2
“Physiologically based pharmacokinetic (PBPK) models explore and predict the pharmacokinetics of drugs, including among others the risk for, and magnitude of, DDIs [21].”
Self-citationKong, J.-S., Seo, S., Kim, T. Y., Moon, H. R., Yoo, J., Kim, M., Yun, H., Hwang, S., Hwang, E. T., Jung, Y., et al. (2025) · Journal of Pharmaceutical Investigation · doi:10.1007/s40005-025-00767-1 · Cited by 2
Massaux, C., Dogné, J.-M., & Musuamba, F. T. (2026) · European Journal of Drug Metabolism and Pharmacokinetics · doi:10.1007/s13318-026-00988-1 · Cited by 2
Yan, X., Xiao, L., & Xie, W. (2025) · Journal of International Medical Research · doi:10.1177/03000605251346587 · Cited by 1
Predicting Systemic and Liver Bosentan Exposure Using Physiologically‐Based Pharmacokinetic Modeling
Huang, M., Macente, J., Heylen, S., Chen, N., Vos, K. D., Deferm, N., & Annaert, P. (2025) · CPT Pharmacometrics & Systems Pharmacology · doi:10.1002/psp4.70085 · Cited by 1
“We integrated published PBPK models of ketoconazole [18] and rifampicin [19] with our bosentan model to simulate drug interaction effects (Section S2.”
Zhang, X., Xue, H., Xu, J., Ren, K., Qian, F., Zhang, Y., Dou, J., Shen, K., Zhu, X., Xiang, X., et al. (2025) · Pediatric Diabetes · doi:10.1155/pedi/8857248 · Cited by 1
“In addition, global sensitivity analysis (GSA) was performed using Morris screening and extended Fourier amplitude sensitivity test (EFAST) methods to account for parameter uncertainty, nonlinearity, and potential interactions [43, 44].”
Xia, X., Chen, Y., & Sun, X. (2025) · Ecotoxicology and Environmental Safety · doi:10.1016/j.ecoenv.2025.119444 · Cited by 1
Physiologically-Based Pharmacokinetic Modeling of Atorvastatin and Amlodipine in Asian Populations
Park, J., & Bae, S. H. (2024) · Drug Targets and Therapeutics · doi:10.58502/dtt.24.0011 · Cited by 1
Pharmacological aspects of acute treatment glycoside intoxication
Sperling, M. I., Kruchinin, E. G., & Gogolevsky, A. S. (2021) · Bulletin of the Medical Institute REAVIZ (REHABILITATION DOCTOR AND HEALTH) · doi:10.20340/vmi-rvz.2021.4.clin.1
Numata, Y., Sasaki, S., Akutsu, N., Hirano, T., Wagatsuma, K., Kawakami, Y., Ishigami, K., & Nakase, H. (2021) · Kanzo · doi:10.2957/kanzo.62.578
CASE STUDY 5: DRUG–DRUG INTERACTION (INHIBITION)
Peters, S. A. (2021) · Wiley eBooks · doi:10.1002/9781119497813.oth5
CASE STUDY 6: DRUG–DRUG INTERACTION (INDUCTION)
Peters, S. A. (2021) · Wiley eBooks · doi:10.1002/9781119497813.oth6
Wen, H., He, Q., Jiao, Z., Xiang, X., & Yu, J. (2022) · Research Square · doi:10.21203/rs.3.rs-1430743/v1
Wen, H., He, Q., Jiao, Z., Xiang, X., & Yu, J. (2022) · Research Square · doi:10.21203/rs.3.rs-1430743/v2
Physiologically Based Pharmacokinetic (PBPK) Modeling: Applications in Drug Development
Ibarra, M., Schiavo, A., & Lesko, L. J. (2021) · Springer eBooks · doi:10.1007/978-3-030-51519-5_169-1
Wen, H., He, Q., Xiang, X., Jiao, Z., & Yu, J. (2022) · SSRN Electronic Journal · doi:10.2139/ssrn.4133622
Physiologically Based Pharmacokinetic (PBPK) Modeling: Applications in Drug Development
Ibarra, M., Schiavo, A., & Lesko, L. J. (2022) · Springer eBooks · doi:10.1007/978-3-030-84860-6_169
Rodrigues, D. (2022) · Research Publications (Maastricht University) · doi:10.26481/dis.20220713dr
Overview of data science and computational modeling concepts in pharmaceutical technology
Djuriš, J. (2023) · Elsevier eBooks · doi:10.1016/b978-0-443-18655-4.00005-4
Chen, X., Yu, G., Wang, G., & Li, G. (2025) · Journal of Pharmaceutical Sciences · doi:10.1016/j.xphs.2025.103707
Zhang, J., Wu, J., Li, J., Liu, M., Liu, S., He, R., & Dong, R. (2025) · BMC Pharmacology and Toxicology · doi:10.1186/s40360-025-00905-3
“For example, to predict the effects of a moderate to weak inhibitor/inducer on a drug (usually after knowing that the inhibitory agent or inducer can significantly affect the drug), the PBPK model should be fully validated with clinical DDI pharmacokinetic data for the inhibitor/inducer [30, 31].”
Wu, Y., Loer, H. L. H., Zhang, Y., Zhong, D., Jiang, Y., Hu, J., Fuhr, U., Lehr, T., & Diao, X. (2025) · CPT Pharmacometrics & Systems Pharmacology · doi:10.1002/psp4.70052
“The use of radiolabeled [ 14 C] furmonertinib ensured comprehensive detection of both parent drug and any covalently bound or trapped forms, minimizing underestimation of total drug movement.”
Self-citationXiao, G., Lin, J., Chen, Y., Skende, E., Hopkins, S. C., Koblan, K. S., & Galluppi, G. R. (2025) · Drug Metabolism and Bioanalysis Letters · doi:10.2174/0118723128376630250618102129
Gu, W., Shao, Q., & Jiang, L. (2025) · Pharmaceutics · doi:10.3390/pharmaceutics17111394
Chen, H., Zhu, S., Yang, A., Li, X., Wang, X., Zhao, W., Wang, X., & Ding, Y. (2025) · Cancer Chemotherapy and Pharmacology · doi:10.1007/s00280-025-04838-w
“The model was deemed acceptable when the ratio of predicted-to-observed PK parameters fell within a 2-fold range (MFE = 0.5 to 2.0) [ 15, 18, 19].”
InfluentialAlsmadi, M. M. (2026) · Drug Metabolism and Disposition · doi:10.1016/j.dmd.2026.100254
Jun, Y., Lee, S. J., Bae, S. K., & Bae, S. H. (2026) · Drug Targets and Therapeutics · doi:10.58502/dtt.26.0006
Shen, C., Wang, R., Yan, J., Zheng, L., Xie, H., Jiang, X., & Wang, L. (2026) · Drug Metabolism and Disposition · doi:10.1016/j.dmd.2026.100289
Impact de l’inflammation sur la pharmacocinétique des médicaments
Simon, F. (2020) · theses.fr (ABES) · doi:10.70675/342fb879zf2d6z40aez8854z0fa9732c9729
Huang, J., Lei, Y., Cai, W., Meng, Y., Xiao, L., Zhao, Y., Lin, W., He, Y., Huang, K., & Li, L. (2026) · Drug Design Development and Therapy · doi:10.2147/dddt.s597672
“39,40 This criterion was used in the current study.”
Garamani, D., Mihranyan, A., & Sjögren, E. (2026) · Research Square · doi:10.21203/rs.3.rs-9437579/v1
Kanacher, T., Pellowe, M., Kovar, C., Eriksson, J., Wu, J., Busse, D., Gómez‐Mantilla, J. D., Stopfer, P., Ince, I., & Huang, F. (2026) · Frontiers in Pharmacology · doi:10.3389/fphar.2026.1828033
“The models for probenecid, rifampicin, and rosuvastatin were originally developed through industry-academic partnerships in a broader context (Hanke et al., 2018, Hanke et al., 2020; Wiebe et al., 2020).”
Role of CYP3A4 in the metabolism of tyrosine kinase inhibitors in non–small cell lung cancer therapy
Sultana, S., Kamal, M., Chen, H., & Li, W. (2026) · Drug Metabolism and Disposition · doi:10.1016/j.dmd.2026.100394
Eriksson, A. L., Karsanji, D., Shi, A. H., PARKINSON, J. R., Heijer, M., Austin, E., Lindmark, B., Vedin, C., Hartleib‐Geschwindner, J., Leonsson‐Zachrisson, M., et al. (2026) · The Journal of Clinical Pharmacology · doi:10.1002/jcph.70282
Hauß, C., Feick, D., Selzer, D., Mármol, Á. L., Winter, F., Lehr, T., & Koziolek, M. (2026) · International Journal of Pharmaceutics · doi:10.1016/j.ijpharm.2026.127375
Self-citationZhou, J., Gao, M.-X., Zhou, D., Zhang, Z., Zhang, H., Sun, Y., & Zhou, H. (2026) · Research Square · doi:10.21203/rs.3.rs-10786220/v1
Thotakura, S., & Maharaj, A. R. (2026) · Clinical Pharmacokinetics · doi:10.1007/s40262-026-01703-8
Ren, J., Yiyao, L., Zheng, X., Shi, J., & Han, X. (2026) · European Journal of Pharmacology · doi:10.1016/j.ejphar.2026.179399
Metadata
- Authors
- Hanke, N., Frechen, S., Moj, D., Britz, H., Eissing, T., Wendl, T., & Lehr, T.
- Affiliations
- Saarland University (DE)
- Bayer (Germany) (DE)
- Corresponding author
- Lehr, Thorsten
- Venue
- CPT: Pharmacometrics & Systems Pharmacology
- Publisher
- Wiley
- Published
- 2018-09-07
- Volume
- 7
- Issue
- 10
- Pages
- 647-659
- ISSN
- 2163-8306 (ISSN-L)
- PMC
- PMC6202474
- OpenAlex
- W2885852526
- Cited by
- 169
- References
- 48
- Citations by year
- 2026: 14 · 2025: 23 · 2024: 22 · 2023: 24 · 2022: 29 · 2021: 27 · 2020: 18 · 2019: 12
- FWCI
- 15.68
- Type
- journal article
- Language
- en
- Open access
- gold
- doi.org
- Licence
- Locations
- CPT Pharmacometrics & Systems Pharmacology (publishedVersion, cc-by-nc)
- Europe PMC (PubMed Central) (publishedVersion, other-oa)
- PubMed Central (publishedVersion, cc-by-nc)
- PubMed (publishedVersion)
- Publications of the UdS (Saarland University)
- Funders
- Bayer
- Topics
- Life Sciences › Pharmacology, Toxicology and Pharmaceutics › Pharmacology › Pharmacogenetics and Drug Metabolism
- Health Sciences › Medicine › Pediatrics, Perinatology and Child Health › Pharmaceutical studies and practices
- Health Sciences › Medicine › Oncology › Drug Transport and Resistance Mechanisms
- Keywords
- physiologically based pharmacokinetic modeling, drug-drug interactions, CYP3A4, P-glycoprotein, rifampicin, itraconazole, clarithromycin, midazolam, alfentanil, digoxin, model-informed drug development
- MeSH terms
- Digoxin, Drug Interactions, Humans, Midazolam, Models, Biological, Rifampin, Alfentanil, Clarithromycin, Itraconazole, ATP Binding Cassette Transporter, Subfamily B, Member 1, Cytochrome P-450 CYP3A
About these checks
Registry, retraction, Cites and statistics results are computed, not judged, with one exception: a printed reference that no index lists is read once by a model before it counts as a citation error. Claims are extracted by a model and kept only when their quote appears verbatim in the text; each cited source is then checked, with a model’s help, for whether it says what the claim relies on. Those verdicts can be wrong — read the claim’s quote and the cited source before relying on one.
Statistics and arithmetic are recomputed, not judged.
Confidence bands are shown only for fields calibrated on our annotated test set. None is calibrated yet, so no band is shown.
What counts as a claim ›How we measure confidence ›How we check this ›
Are you an author, or do you see a problem with this page? Request a review
