

The DOI matches its Crossref record; 1 of the 1 references it cites were found in a registry or an index.
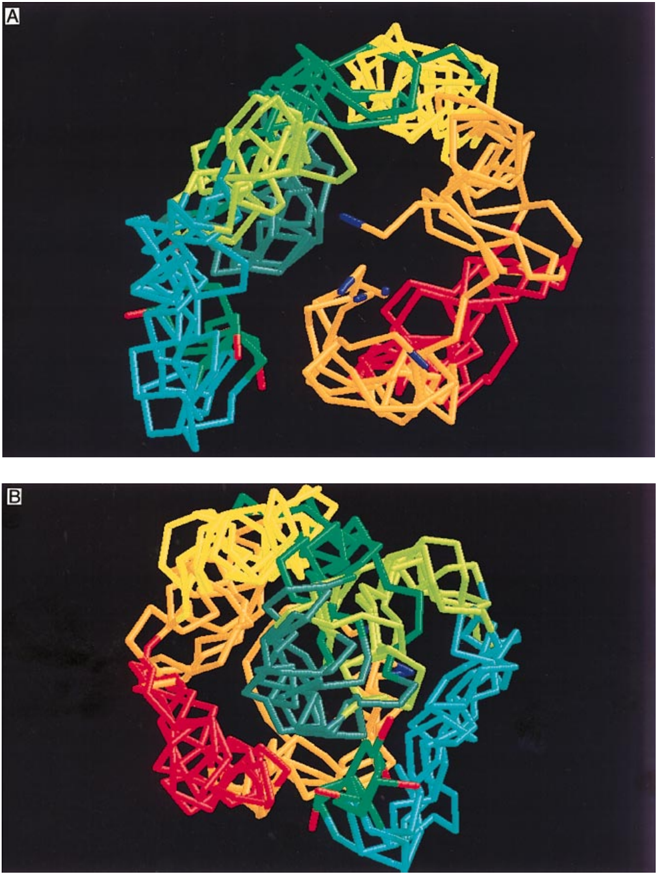
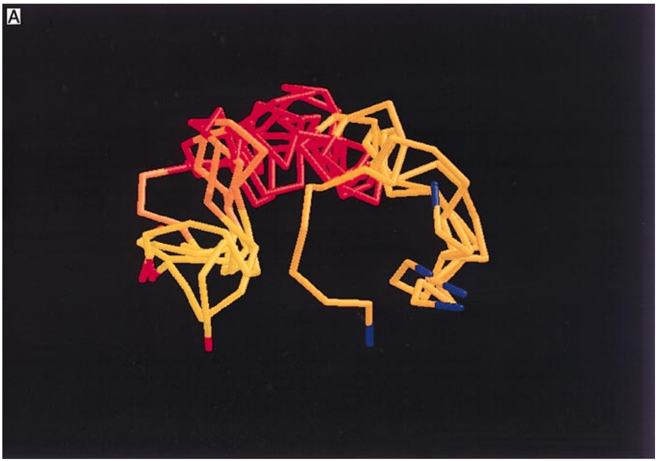
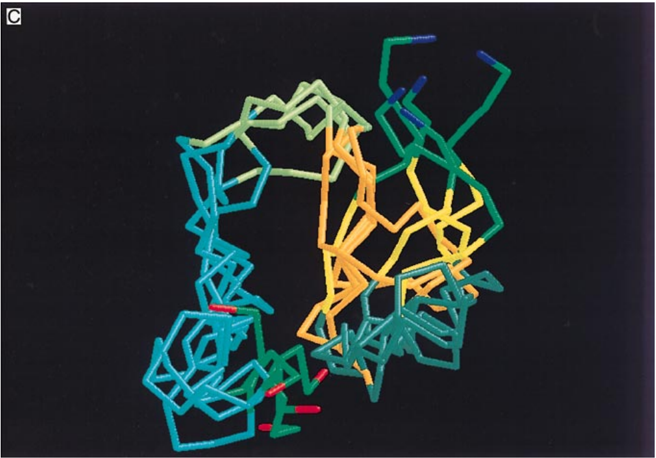
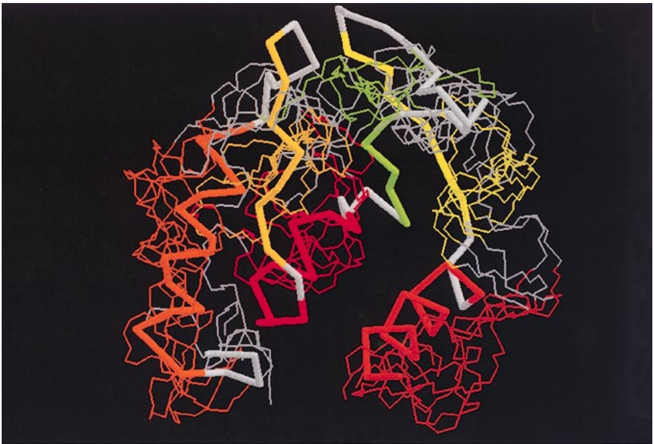
Characterization of long-range structure in the denatured state of staphylococcal nuclease. II. distance restraints from paramagnetic relaxation and calculation of an ensemble of structures
Overview
The claims and statistics of this paper haven’t been checked yet.
Run the check — free, no account needed. It reads the open-access text and checks the sources it cites.
Integrity signals
Registry
Cites
Statistics
Figures
Verification
Claims the paper makes
The claims and statistics of this paper haven’t been checked yet.
Run the check — free, no account needed. It reads the open-access text and checks the sources it cites.
Claims other papers make about this one
Each is checked against this paper’s own text: does it say what the citing paper says it does?
In the citing paper
“Paramagnetic centers in proteins strongly increase relaxation rates of nearby nuclei53 and thereby provide highly sensitive probes for both intramolecular and intermolecular interactions19, 54.”
From Liquid–liquid phase separation of the microtubule-binding repeats of the Alzheimer-related protein Tau (2017) · cites this paper as [53]
Self-check
Percentages, sums and reported differences re-computed from the paper’s own numbers.
The self-check needs the paper’s full text.
Citations
Cites
PROCHECK: a program to check the stereochemical quality of protein structures
Laskowski, R. A., MacArthur, M. W., Moss, D. S., & Thornton, J. M. (1993) · Journal of Applied Crystallography · doi:10.1107/s0021889892009944 · Cited by 24,581
Research works printed but not linked: 21
- Alexandrescu, 1994, Backbone dynamics of a highly disordered 131-residue fragment of staphylococcal nuclease, J. Mol. Biol., 242, 527, 10.1006/jmbi.1994.1598 · DOI
- Alexandrescu, 1994, Structure and dynamics of a denatured 131-residue fragment of staphylococcal nuclease, a heteronuclear NMR study, Biochemistry, 33, 1063, 10.1021/bi00171a004 · DOI
- Berendsen, 1984, Molecular dynamics with coupling to an external bath, J. Chem. Phys., 81, 3684, 10.1063/1.448118 · DOI · Paper page
- Dill, 1991, Denatured states of proteins, Annu. Rev. Biochem., 60, 795, 10.1146/annurev.bi.60.070191.004051 · DOI · Paper page
- Dobson, 1994, Solid evidence for molten globules, Curr. Opin. Struct. Biol., 4, 636
- Epstein, 1971, Folding of staphylococcal nuclease, J. Mol. Biol., 60, 499, 10.1016/0022-2836(71)90184-7 · DOI
- Ermacora, 1996, Mapping the structure of a non-native state of staphylococcal nuclease, Nature Struct. Biol., 3, 59, 10.1038/nsb0196-59 · DOI
- Gillespie, 1997, Characterization of long range structure in the denatured state of staphylococcal nuclease. I. Paramagnetic relaxation enhancement by nitroxide spin labels, J. Mol. Biol., 268, 158, 10.1006/jmbi.1997.0954 · DOI · Paper page
- Lee, 1971, The interpretation of protein structure, J. Mol. Biol., 55, 379, 10.1016/0022-2836(71)90324-X · DOI
- LeMaster, 1988, Protein dynamics and distance determination by NOE measurements, FEBS Letters, 236, 71, 10.1016/0014-5793(88)80287-4 · DOI
- Loll, 1989, The crystal structure of the ternary complex of staphylococcal nuclease, Ca2+ and the inhibitor pdTp, refined at 1.65 A, Proteins: Struct. Funct. Genet., 5, 183, 10.1002/prot.340050302 · DOI · Paper page
- Miranker, 1996, Collapse and cooperativity in protein folding, Curr. Opin. Struct. Biol., 6, 31, 10.1016/S0959-440X(96)80092-3 · DOI
- Mori, 1997, Measurement of water-amide proton exchange rates in the denatured state of staphylococcal nuclease by a magnetization transfer technique, Proteins: Struct. Funct. Genet., 10.1002/(SICI)1097-0134(199707)28:3<325::AID-PROT3>3.0.CO;2-B · DOI
- Nilges, 1988, Determination of three-dimensional structures of proteins from interproton distance data by hybrid distance geometry-dynamical simulated annealing calculations, FEBS Letters, 229, 317, 10.1016/0014-5793(88)81148-7 · DOI · Paper page
- Oshiro, 1991, Effects of limited input distance constraints upon the distance geometry algorithm, Biopolymers, 31, 1049, 10.1002/bip.360310905 · DOI
- Schmidt, 1984, Distance measurements in spin-labeled lysozyme, Biochemistry, 23, 4261, 10.1021/bi00313a038 · DOI
- Shortle, 1996, The denatured state (the other half of the folding equation) and its role in protein stability, FASEB J., 10, 27, 10.1096/fasebj.10.1.8566543 · DOI · Paper page
- Shortle, 1996, Protein folding for realists, a timeless phenomenon, Protein Sci., 5, 991, 10.1002/pro.5560050602 · DOI
- Wang, 1995, The equilibrium folding pathway of staphylococcal nuclease, Identification of the most stable chain-chain interactions by NMR and CD spectroscopy, Biochemistry, 34, 15895, 10.1021/bi00049a004 · DOI
- Wang, 1996, A dynamic bundle of four adjacent hydrophobic segments in the denatured state of staphylococcal nuclease, Protein Sci., 5, 1898, 10.1002/pro.5560050916 · DOI
- Zhang, 1997, Triple-resonance NOESY-based experiments with improved spectral resolution, J. Mol. Biol.
Cited by
Ambadipudi, S., Biernat, J., Riedel, D., Mandelkow, E., & Zweckstetter, M. (2017) · Nature Communications · doi:10.1038/s41467-017-00480-0 · Cited by 782
Cabrales Fontela, Y., Kadavath, H., Biernat, J., Riedel, D., Mandelkow, E., & Zweckstetter, M. (2017) · Nature Communications · doi:10.1038/s41467-017-02230-8 · Cited by 148
Chaperone-Bound Clients: The Importance of Being Dynamic
Hiller, S. (2019) · Trends in Biochemical Sciences · doi:10.1016/j.tibs.2018.12.005 · Cited by 54
Metadata
- Authors
- Gillespie, J. R., & Shortle, D.
- Venue
- Journal of Molecular Biology
- Publisher
- Elsevier BV
- Published
- 1997-04
- Volume
- 268
- Issue
- 1
- Pages
- 170-184
- ISSN
- 0022-2836
- Cited by
- 246
- References
- 1
- Language
- en
- Licence
- www.elsevier.com/tdm/userlicense/1.0/ (tdm)
- www.elsevier.com/legal/tdmrep-license (tdm)
- creativecommons.org/licenses/by-nc-nd/4.0/ (vor, 1880 d)
About these checks
Registry, retraction, Cites and statistics results are computed, not judged, with one exception: a printed reference that no index lists is read once by a model before it counts as a citation error. Claims are extracted by a model and kept only when their quote appears verbatim in the text; each cited source is then checked, with a model’s help, for whether it says what the claim relies on. Those verdicts can be wrong — read the claim’s quote and the cited source before relying on one.
Statistics and arithmetic are recomputed, not judged.
Confidence bands are shown only for fields calibrated on our annotated test set. None is calibrated yet, so no band is shown.
What counts as a claim ›How we measure confidence ›How we check this ›
Are you an author, or do you see a problem with this page? Request a review
Data sources
Bibliographic data: Semantic Scholar, OpenAlex, Crossref.
Contains information from the Semantic Scholar Academic Graph Datasets, made available under the ODC Attribution License (ODC-BY 1.0).
Semantic Scholar’s data is described in: Kinney, R., et al. (2023). The Semantic Scholar Open Data Platform. arXiv:2301.10140.
