

The DOI matches its Crossref record; 5 of the 5 references it cites were found in a registry or an index.
Evaluation of Reflective Measurement Models
Abstract
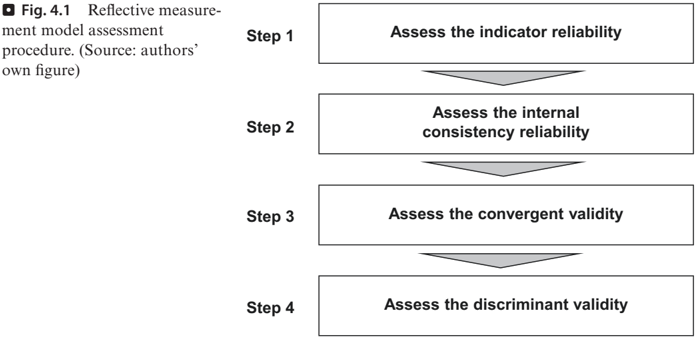
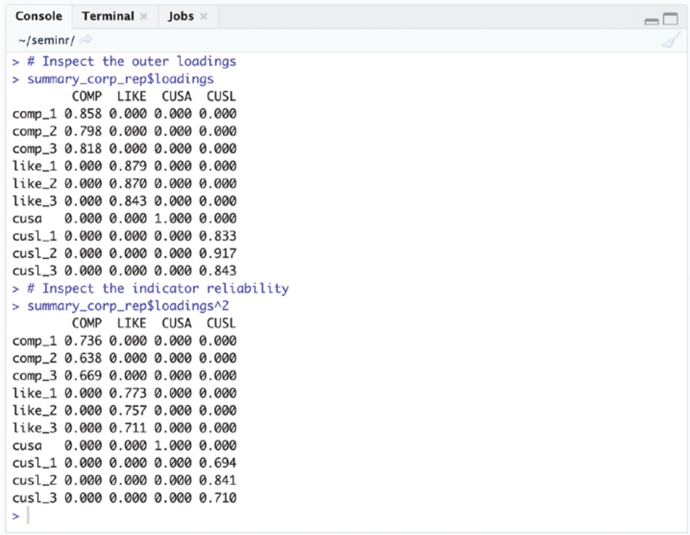
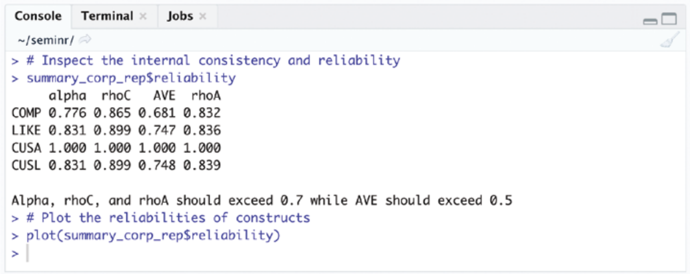
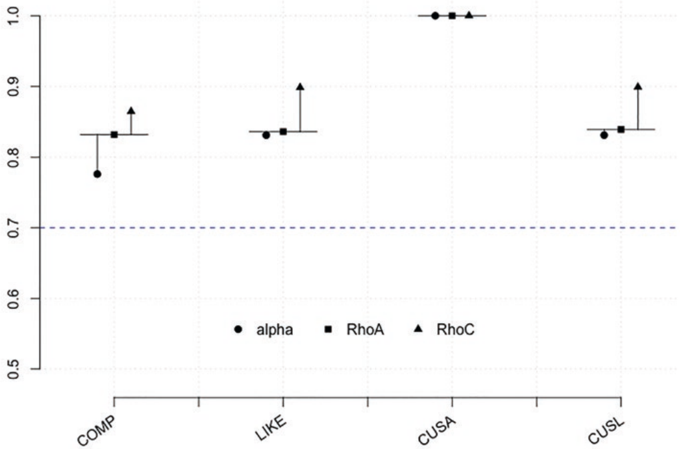
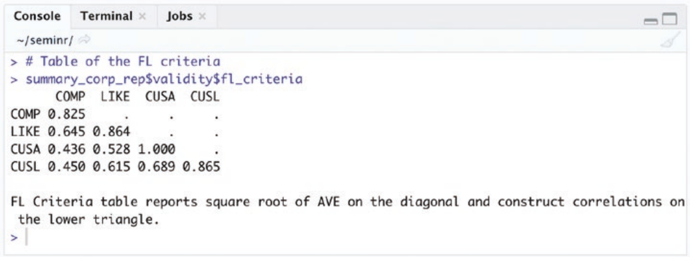
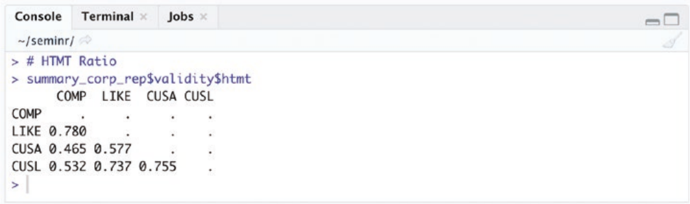
The goal of reflective measurement model assessment is to ensure the reliability and validity of the construct measures and therefore provides support for the suitability of their inclusion in the path model. This chapter introduces the key criteria that are relevant in reflective measurement model assessment: indicator reliability, internal consistency reliability (Cronbach’s alpha, reliability coefficient rho A , and composite reliability rho C ), convergent validity, and discriminant validity. We illustrate their use by means of the SEMinR package and a well-known model on corporate reputation.
Overview
The claims and statistics of this paper haven’t been checked yet.
Run the check — free, no account needed. It reads the open-access text and checks the sources it cites.
Integrity signals
Registry
Cites
Statistics
Figures
Verification
Claims the paper makes
The claims and statistics of this paper haven’t been checked yet.
Run the check — free, no account needed. It reads the open-access text and checks the sources it cites.
Claims other papers make about this one
Each is checked against this paper’s own text: does it say what the citing paper says it does?
The cited source says what the claim attributes to it.
In the citing paper
“Cronbach’s alpha, rho_A, composite reliability, and average variance extracted were evaluated according to conventional PLS-SEM criteria (Hair et al., 2021).”
From When loneliness amplifies the risk of problematic emotional dependence: perceived anthropomorphism and basic psychological need satisfaction in AI companion use (2026) · cites this paper as Hair et al., 2021
Self-check
Percentages, sums and reported differences re-computed from the paper’s own numbers.
The self-check needs the paper’s full text.
Citations
Cites
Evaluating Structural Equation Models with Unobservable Variables and Measurement Error
Fornell, C., & Larcker, D. F. (1981) · Journal of Marketing Research · doi:10.2307/3151312 · Cited by 109,314
Evaluating structural equation models with unobservable variables and measurement error
Fornell, C., & Larcker, D. F. (1981) · Journal of Marketing Research · doi:10.1177/002224378101800104 · Cited by 109,190
A new criterion for assessing discriminant validity in variance-based structural equation modeling
Henseler, J., Ringle, C. M., & Sarstedt, M. (2015) · Journal of the Academy of Marketing Science · doi:10.1007/s11747-014-0403-8 · Cited by 38,459
Self-citationSimultaneous Factor Analysis in Several Populations
Jöreskog, K. G. (1971) · Psychometrika · doi:10.1007/bf02291366 · Cited by 2,051
Bootstrapping and PLS-SEM: A step-by-step guide to get more out of your bootstrap results
Streukens, S., & Leroi-Werelds, S. (2016) · European Management Journal · doi:10.1016/j.emj.2016.06.003 · Cited by 1,120
Research works printed but not linked: 11
- Aguirre-Urreta, M. I., & Rönkkö, M. (2018). Statistical inference with PLSc using bootstrap confidence intervals. MIS Quarterly, 42(3), 1001–1020. · DOI
- Diamantopoulos, A., Sarstedt, M., Fuchs, C., Wilczynski, P., & Kaiser, S. (2012). Guidelines for choosing between multi-item and single-item scales for construct measurement: A predictive validity perspective. Journal of the Academy of Marketing Science, 40(3), 434–449. · DOI
- Dijkstra, T. K. (2010). Latent variables and indices: Herman Wold’s basic design and partial least squares. In V. Esposito Vinzi, W. W. Chin, J. Henseler, & H. Wang (Eds.), Handbook of partial least squares: Concepts, methods and applications Springer Handbooks of Computational Statistics Series (Vol. II, pp. 23–46). Berlin: Springer. · DOI
- Dijkstra, T. K. (2014). PLS’ Janus face–response to professor Rigdon’s ‘rethinking partial least squares modeling: In praise of simple methods. Long Range Planning, 47(3), 146–153. · DOI
- Dijkstra, T. K., & Henseler, J. (2015). Consistent partial least squares path modeling. MIS Quarterly, 39(2), 297–316. · DOI · Paper page
- Franke, G., & Sarstedt, M. (2019). Heuristics versus statistics in discriminant validity testing: A comparison of four procedures. Internet Research, 29(3), 430–447. · DOI
- Hair, J. F., Hult, T., Ringle, C. M., & Sarstedt, M. (2022). A primer on partial least squares structural equation modeling (PLS-SEM) (3rd ed.). Thousand Oaks: Sage.
- Hair, J. F., Risher, J. J., Sarstedt, M., & Ringle, C. M. (2019). When to use and how to report the results of PLS-SEM. European Business Review, 31(1), 2–24. · DOI · Paper page
- Hulland, J. (1999). Use of partial least squares (PLS) in strategic management research: A review of four recent studies. Strategic Management Journal, 20(2), 195–204. · DOI · Paper page
- Radomir, L., & Moisescu, O. I. (2019). Discriminant validity of the customer-based corporate reputation scale: Some causes for concern. Journal of Product & Brand Management, 29(4), 457–469. · DOI
- Trizano-Hermosilla, I., & Alvarado, J. M. (2016). Best alternatives to Cronbach’s alpha reliability in realistic conditions: Congeneric and asymmetrical measurements. Frontiers in Psychology, 7, 769. · DOI
Cited by
Sorted by citations
Financial technology adoption among small and medium enterprises in Ghana
Krah, R., Tetteh, L. A., Boateng, A., & Amankwa, R. F. (2024) · Cogent Business & Management · doi:10.1080/23311975.2024.2321786 · Cited by 36
“the examination of the Variable inflation factor (Vif) values is the first step in the structural model assessment (hair et al., 2022). the Vif values were less than 3 as shown in table 4, indicating that the data has no multicollinearity concerns (hair et al., 2022).”
Sudaryanto, S., Hanim, A., Rosediana Dewi, I., Kartikasari, A. D., & Rusdiyanto, R. (2025) · Cogent Business & Management · doi:10.1080/23311975.2025.2503093 · Cited by 21
Liu, T., Shih, R.-M., Luo, T., & Jin, S. (2026) · Frontiers in Psychology · doi:10.3389/fpsyg.2026.1900817
Metadata
- Authors
- Hair, J. F., Hult, G. T. M., Ringle, C. M., Sarstedt, M., Danks, N. P., & Ray, S.
- Venue
- Classroom Companion: Business
- Publisher
- Springer International Publishing
- Published
- 2021
- Pages
- 75-90
- ISSN
- 2662-2866
- 2662-2874
- Cited by
- 456
- References
- 5
- Language
- en
About these checks
Registry, retraction, Cites and statistics results are computed, not judged, with one exception: a printed reference that no index lists is read once by a model before it counts as a citation error. Claims are extracted by a model and kept only when their quote appears verbatim in the text; each cited source is then checked, with a model’s help, for whether it says what the claim relies on. Those verdicts can be wrong — read the claim’s quote and the cited source before relying on one.
Statistics and arithmetic are recomputed, not judged.
Confidence bands are shown only for fields calibrated on our annotated test set. None is calibrated yet, so no band is shown.
What counts as a claim ›How we measure confidence ›How we check this ›
Are you an author, or do you see a problem with this page? Request a review
