Cited by 34

The DOI matches its Crossref record; 1 of the 1 references it cites were found in a registry or an index.

Early steps of microglial activation are directly affected by neuroprotectant FK506 in both in vitro inflammation and in rat model of stroke

Zawadzka, Malgorzata, Dabrowski, Michal, Gozdz, Agata, Szadujkis, Barbara, Sliwa, Marcin, Lipko, Maciej, Kaminska, Bozena·2012·Journal of Molecular Medicine

Overview

The claims and statistics of this paper haven’t been checked yet.

Run the check — free, no account needed. It reads the open-access text and checks the sources it cites.

A few free checks a day · papers already verified open instantly · results are public

Integrity signals

Registry

Crossref · 10.1007/s00109-012-0925-9

Cites

1 of 1 references verified0 citation errors · 0 not checkable

Statistics

Figures

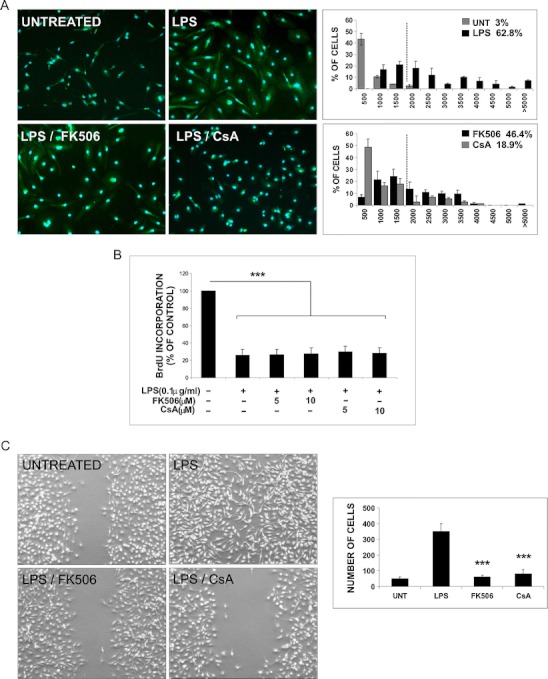
Fig. 1 FK506 and CsA attenuate LPS-induced transformation of microglia. a Primary microglial cultures were prepared as described and kept for 48 h after plating to silence microglia. Morphological alterations of microglia untreated or exposed to 100 ng/mL LPS alone or with immunosuppressants (at concentration of 5 μM) for 24 h were visualized by immunofluorescence. Cells were stained with FITC-conjugated isolectin B4 (green) to visualize cell morphology followed by staining with DAPI for nuclei visualization (blue); ×20 objective. Stained cells with a specified range of size and optical density above fixed threshold value were automatically recognized and counted. Cell body area of microglial cells was measured, and the percentage of cells with body area >2,000 μm2 (activated cells) was calculated. Left panel shows the histograms representing the distribution of microglial cells body area (square micrometers) for all analyzed experimental conditions. Data are expressed as means ± SD from ten fields for all treatments in three independent experiments. b FK506 and CsA do not inhibit LPS-induced growth arrest of microglial cells. Microglial proliferation was determined with BrdU incorporation assay 24 h after treatment. The results are means ± SEM of three independent experiments, each in triplicate. c Immunosuppressants affect migration of activated microglia. Confluent microglial cultures were scratched with a plastic 100-μL tip, washed with PBS, and incubated for 5 h under given conditions. Cells migrating to a cell-free area without the treatment, after addition of 100 ng/mL LPS alone or with immunosuppressants (5 μM), were visualized by phase-contrast microscopy (magnification ×4). Left panel shows quantitative evaluation of motility/migration of microglia treated with LPS alone or with immunosupressants at 6 h time point. Cells from five fields between scratch edges along the line were counted. Results represent means ± SD from two independent experiments each in triplicate
Fig. 1 FK506 and CsA attenuate LPS-induced transformation of microglia. a Primary microglial cultures were prepared as described and kept for 48 h after plating to silence microglia. Morphological alterations of microglia untreated or exposed to 100 ng/mL LPS alone or with immunosuppressants (at concentration of 5 μM) for 24 h were visualized by immunofluorescence. Cells were stained with FITC-conjugated isolectin B4 (green) to visualize cell morphology followed by staining with DAPI for nuclei visualization (blue); ×20 objective. Stained cells with a specified range of size and optical density above fixed threshold value were automatically recognized and counted. Cell body area of microglial cells was measured, and the percentage of cells with body area >2,000 μm2 (activated cells) was calculated. Left panel shows the histograms representing the distribution of microglial cells body area (square micrometers) for all analyzed experimental conditions. Data are expressed as means ± SD from ten fields for all treatments in three independent experiments. b FK506 and CsA do not inhibit LPS-induced growth arrest of microglial cells. Microglial proliferation was determined with BrdU incorporation assay 24 h after treatment. The results are means ± SEM of three independent experiments, each in triplicate. c Immunosuppressants affect migration of activated microglia. Confluent microglial cultures were scratched with a plastic 100-μL tip, washed with PBS, and incubated for 5 h under given conditions. Cells migrating to a cell-free area without the treatment, after addition of 100 ng/mL LPS alone or with immunosuppressants (5 μM), were visualized by phase-contrast microscopy (magnification ×4). Left panel shows quantitative evaluation of motility/migration of microglia treated with LPS alone or with immunosupressants at 6 h time point. Cells from five fields between scratch edges along the line were counted. Results represent means ± SD from two independent experiments each in triplicateCC BY · PubMed Central
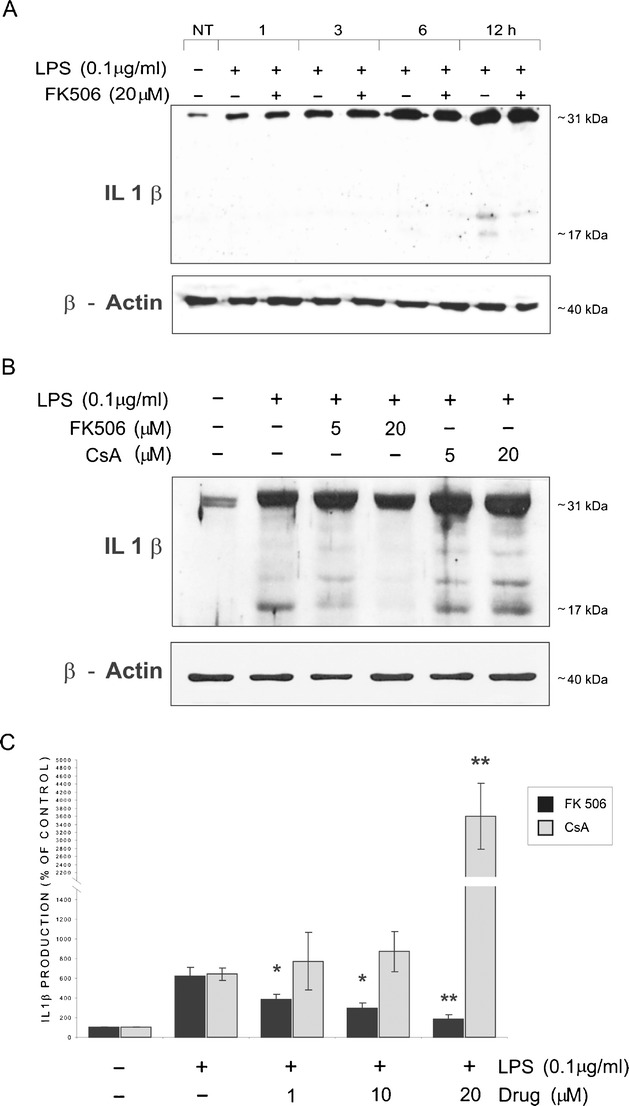
Fig. 2 FK506 reduces LPS-induced production of IL-1β by microglial cells. a Kinetics of LPS-induced production of IL-1β. Immunoblot shows the levels of pro-IL-1β (31 kDa) and mature IL-1β (17 kDa) protein in extracts from microglial cells at different times after treatment with 100 ng/mL LPS. β-Actin detection ensured an equal protein loading. Similar results were observed on three independently derived microglial cultures. b Attenuation of LPS-induced production of the mature form of IL-1β in cells exposed to 5 and 20 μM FK506 for 12 h. c Effects of immunosuppressants on IL-1β secretion by LPS-stimulated microglial cultures evaluated by ELISA assay at 12 h after treatment. Results are expressed as percentage of the IL-1β release obtained in untreated cells; means ± SEM from three experiments (each in triplicate) are presented
Fig. 2 FK506 reduces LPS-induced production of IL-1β by microglial cells. a Kinetics of LPS-induced production of IL-1β. Immunoblot shows the levels of pro-IL-1β (31 kDa) and mature IL-1β (17 kDa) protein in extracts from microglial cells at different times after treatment with 100 ng/mL LPS. β-Actin detection ensured an equal protein loading. Similar results were observed on three independently derived microglial cultures. b Attenuation of LPS-induced production of the mature form of IL-1β in cells exposed to 5 and 20 μM FK506 for 12 h. c Effects of immunosuppressants on IL-1β secretion by LPS-stimulated microglial cultures evaluated by ELISA assay at 12 h after treatment. Results are expressed as percentage of the IL-1β release obtained in untreated cells; means ± SEM from three experiments (each in triplicate) are presentedCC BY · PubMed Central
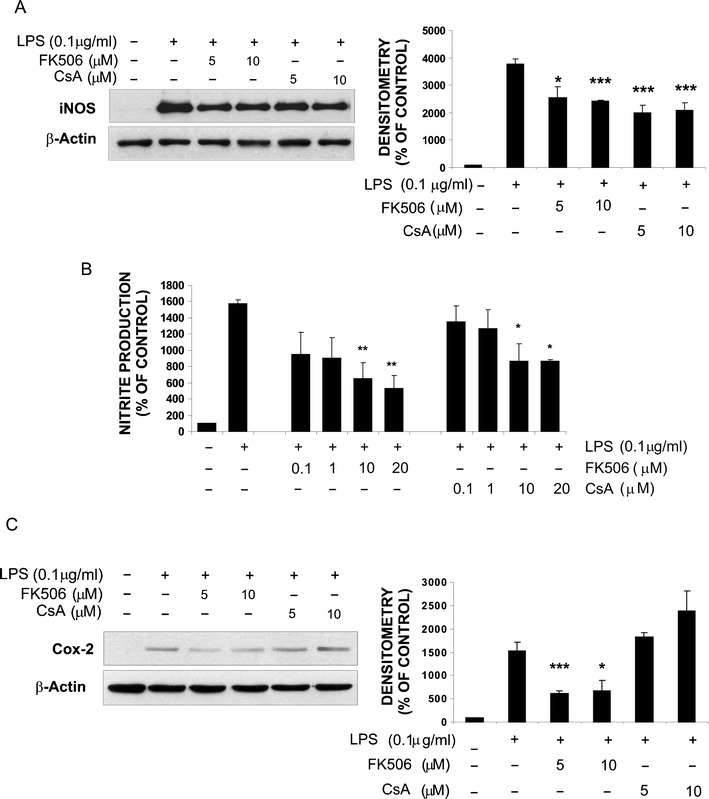
Fig.3 Immunosuppressants affect LPS-induced production of inflammatory mediators in rat microglial cultures. a Immunoblot shows that FK506 and CsA reduce the level of iNOS protein in microglial cells exposed for 24 h to 100 ng/mL LPS alone or together with FK506 or CsA (5 or 10 μM). Densitometry of immunoblots from three independent experiments was performed. The level of iNOS expression was normalized to β-actin content. All values are related to untreated controls and presented as the mean values ± SEM. b Nitric oxide production was determined as nitrite concentration in cell culture supernatants and expressed as percentage of the release by untreated cells. Results represent means ± SEM obtained from three independently derived cultures (each in triplicate). c FK506 (but not CsA) reduces LPS-induced expression of Cox-2 protein in microglial cultures. Densitometry of immunoblots from three independent experiments was performed. The level of Cox-2 expression was normalized to β-actin content, related to controls and presented as means ± SEM
Fig.3 Immunosuppressants affect LPS-induced production of inflammatory mediators in rat microglial cultures. a Immunoblot shows that FK506 and CsA reduce the level of iNOS protein in microglial cells exposed for 24 h to 100 ng/mL LPS alone or together with FK506 or CsA (5 or 10 μM). Densitometry of immunoblots from three independent experiments was performed. The level of iNOS expression was normalized to β-actin content. All values are related to untreated controls and presented as the mean values ± SEM. b Nitric oxide production was determined as nitrite concentration in cell culture supernatants and expressed as percentage of the release by untreated cells. Results represent means ± SEM obtained from three independently derived cultures (each in triplicate). c FK506 (but not CsA) reduces LPS-induced expression of Cox-2 protein in microglial cultures. Densitometry of immunoblots from three independent experiments was performed. The level of Cox-2 expression was normalized to β-actin content, related to controls and presented as means ± SEMCC BY · PubMed Central
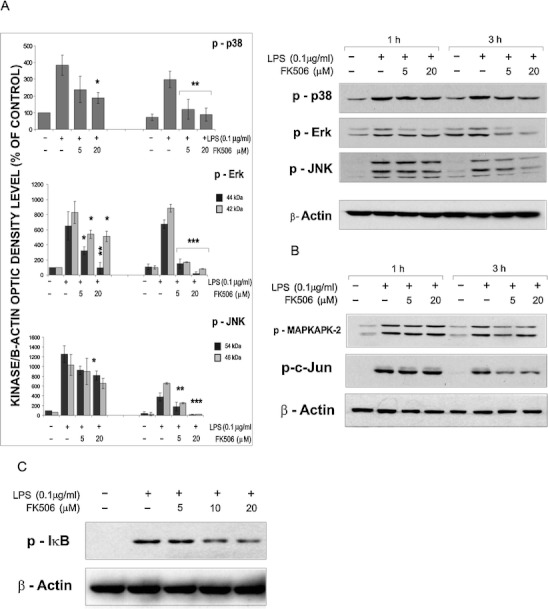
Fig.4 FK506 interferes with signal transduction triggered by LPS in microglial cultures. Immunoblots show the levels of phosphorylated forms of MAP kinases (a) their substrates, MAPKAPK2 and c-Jun (b) and IκB (c) Western blot analyses were performed with total extracts from microglial cultures treated with LPS alone or with FK506. Similar results were obtained in four independent experiments. The level of phosphorylated MAPK was quantified by densitometry, related to the β-actin level and then to values obtained for untreated microglia. Results are presented as means ± SEM from three independent experiments
Fig.4 FK506 interferes with signal transduction triggered by LPS in microglial cultures. Immunoblots show the levels of phosphorylated forms of MAP kinases (a) their substrates, MAPKAPK2 and c-Jun (b) and IκB (c) Western blot analyses were performed with total extracts from microglial cultures treated with LPS alone or with FK506. Similar results were obtained in four independent experiments. The level of phosphorylated MAPK was quantified by densitometry, related to the β-actin level and then to values obtained for untreated microglia. Results are presented as means ± SEM from three independent experimentsCC BY · PubMed Central
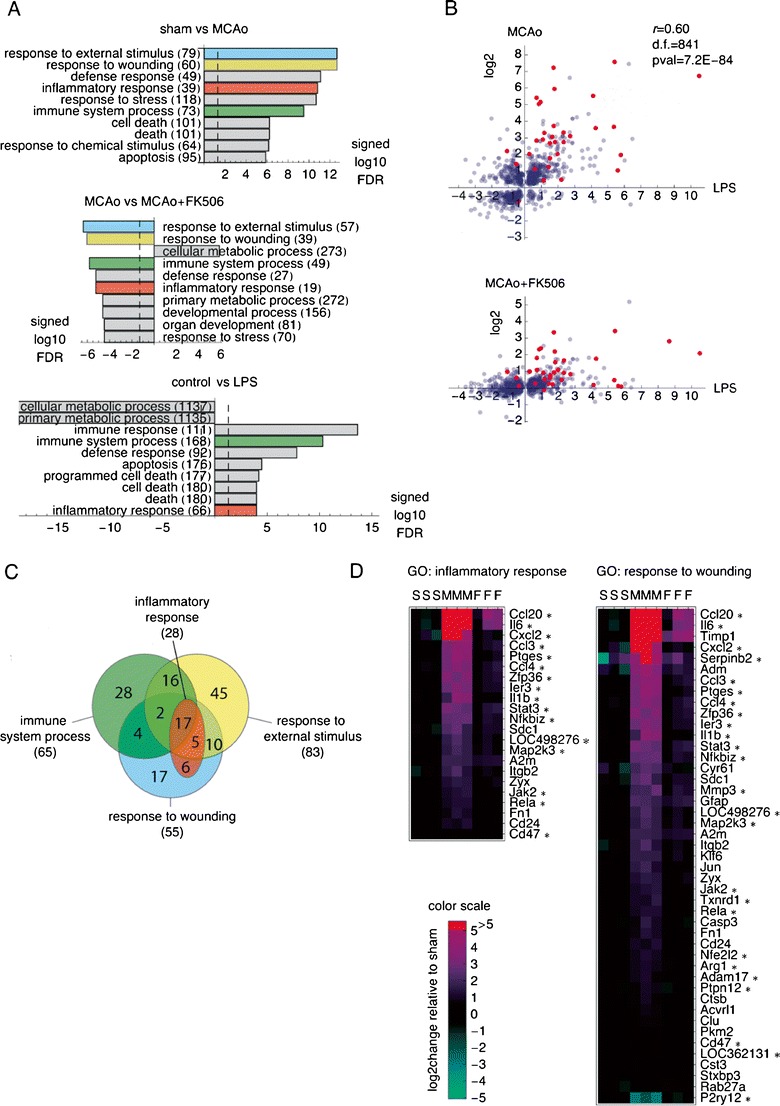
Fig.5 FK506 blocks upregulation of numerous inflammation-related genes in the ischemic cortex. a Gene Ontology “biological process” terms most significantly associated with the changes in gene expression induced by MCAo in the ischemic cortex, with or without FK506 treatment, and by LPS activation of microglia in vitro. Analysis was performed on the remote RankGOStat server, with ranked lists of log2 changes in expression of the genes with the respective t test p value < 0.05 used as the input files, and RGD selected as the target database. For the plot, the FDR-corrected association p values were log10-transformed and signed, i.e., multiplied by +1 or −1 to reflect association with increased or decreased expression, respectively. Numbers of genes in each GO category are given in parentheses. b Comparison of log2 changes in gene expression induced in microglia by LPS and after MCAo for the genes significantly regulated in both systems (top panel). The changes of the same genes as in the top panel are compared to the changes induced by MCAo in the animals that received FK506 (bottom panel). Red dots represent gene assigned to GO: inflammatory response. c. Venn diagram of the genes affected by FK506 treatment assigned to GO categories: “response to external stimulus,” “response to wounding,” “immune system process,” and “inflammatory response.” A newer local version of the GO database was used than by the RankGOStat server, resulting in larger numbers of genes assigned to the same GO terms than in (a). For details of the gene names and the expression data, see ESM Table 1. d Heat maps of expression profiles of the genes in GO catagories: “response to wounding” and “inflammatory response” that were regulated by FK506. The genes were sorted on the change in expression induced by MCAo (as compared to sham). The genes that were also significantly regulated during microglia activation with LPS are marked with an asterisk
Fig.5 FK506 blocks upregulation of numerous inflammation-related genes in the ischemic cortex. a Gene Ontology “biological process” terms most significantly associated with the changes in gene expression induced by MCAo in the ischemic cortex, with or without FK506 treatment, and by LPS activation of microglia in vitro. Analysis was performed on the remote RankGOStat server, with ranked lists of log2 changes in expression of the genes with the respective t test p value < 0.05 used as the input files, and RGD selected as the target database. For the plot, the FDR-corrected association p values were log10-transformed and signed, i.e., multiplied by +1 or −1 to reflect association with increased or decreased expression, respectively. Numbers of genes in each GO category are given in parentheses. b Comparison of log2 changes in gene expression induced in microglia by LPS and after MCAo for the genes significantly regulated in both systems (top panel). The changes of the same genes as in the top panel are compared to the changes induced by MCAo in the animals that received FK506 (bottom panel). Red dots represent gene assigned to GO: inflammatory response. c. Venn diagram of the genes affected by FK506 treatment assigned to GO categories: “response to external stimulus,” “response to wounding,” “immune system process,” and “inflammatory response.” A newer local version of the GO database was used than by the RankGOStat server, resulting in larger numbers of genes assigned to the same GO terms than in (a). For details of the gene names and the expression data, see ESM Table 1. d Heat maps of expression profiles of the genes in GO catagories: “response to wounding” and “inflammatory response” that were regulated by FK506. The genes were sorted on the change in expression induced by MCAo (as compared to sham). The genes that were also significantly regulated during microglia activation with LPS are marked with an asteriskCC BY · PubMed Central

Verification

Claims the paper makes

The claims and statistics of this paper haven’t been checked yet.

Run the check — free, no account needed. It reads the open-access text and checks the sources it cites.

A few free checks a day · papers already verified open instantly · results are public

Claims other papers make about this one

Each is checked against this paper’s own text: does it say what the citing paper says it does?

Self-check

Percentages, sums and reported differences re-computed from the paper’s own numbers.

The self-check needs the paper’s full text.

Citations

Cites

Show all 1 references

Research works printed but not linked: 34

  1. Hanisch UK, Kettenmann H (2007) Microglia: active sensor and versatile effector cells in the normal and pathologic brain. Nat Neurosci 10:1387–1394 · DOI · Paper page
  2. Aloisi F (2001) Immune function of microglia. Glia 36:165–179 · DOI
  3. Allan SM, Tyrrell PJ, Rothwell NJ (2005) Interleukin-1 and neuronal injury. Nat Rev Immunol 5:629–640 · DOI · Paper page
  4. Loddick SA, Rothwell NJ (1999) Mechanisms of tumor necrosis factor alpha action on neurodegeneration: interaction with insulin-like growth factor-1. Proc Natl Acad Sci U S A 96:9449–9451 · DOI
  5. Simi A, Tsakiri N, Wang P, Rothwell NJ (2007) Interleukin-1 and inflammatory neurodegeneration. Biochem Soc Trans 35:1122–1126 · DOI
  6. Kaminska B, Gaweda-Walerych K, Zawadzka M (2004) Molecular mechanisms of neuroprotective action of immunosuppressants—facts and hypotheses. J Cell Mol Med 8:45–58 · DOI
  7. Gold BG, Villafranca JE (2003) Neuroimmunophilin ligands: the development of novel neuroregenerative/neuroprotective compounds. Curr Top Med Chem 3:1368–1375 · DOI
  8. Macleod MR, O’Collins T, Horkey LL, Howells DW, Donnan GA (2005) Systematic review and metaanalysis of the efficacy of FK506 in experimental stroke. J Cereb Blood Flow Metab 25:713–721 · DOI
  9. Furuichi Y, Maeda M, Matsuoka N, Mutoh S, Yanagihara T (2007) Therapeutic time window of tacrolimus (FK506) in a nonhuman primate stroke model: comparison with tissue plasminogen activator. Exp Neurol 204:138–146 · DOI
  10. Furuichi Y, Noto T, Li JY, Oku T, Ishiye M, Moriguchi A, Aramori I, Matsuoka N, Mutoh S, Yanagihara T (2004) Multiple modes of action of tacrolimus (FK506) for neuroprotective action on ischemic damage after transient focal cerebral ischemia in rats. Brain Res 1014:120–130 · DOI
  11. Tsujikawa A, Ogura Y, Hiroshiba N, Miyamoto K, Kiryu J, Honda Y (1998) Tacrolimus (FK506) attenuates leukocyte accumulation after transient retinal ischemia. Stroke 29:1431–1437 · DOI
  12. Zawadzka M, Kaminska B (2005) A novel mechanism of FK506-mediated neuroprotection: downregulation of cytokine expression in glial cells. Glia 49:36–51 · DOI
  13. Szydlowska K, Gozdz A, Dabrowski M, Zawadzka M, Kaminska B (2010) Prolonged activation of ERK triggers glutamate-induced apoptosis of astrocytes: neuroprotective effect of FK506. J Neurochem 113:904–918 · DOI
  14. Zawadzka M, Kaminska B (2003) Immunosuppressant FK506 affects multiple signaling pathways and modulates gene expression in astrocytes. Mol Cell Neurosci 22:202–209 · DOI
  15. Irizarry R, Gautier RL, Cope L (2002) An R package for analyses of affymetrix oligonucleotide arrays. In: The analysis of gene expression data: methods and software. Springer, New York
  16. Storey JD, Tibshirani R (2003) Statistical significance for genome-wide studies. Proc Natl Acad Sci U S A 100:9440–9445 · DOI · Paper page
  17. Beissbarth T, Speed TP (2004) GOstat: find statistically overrepresented Gene Ontologies within a group of genes. Bioinformatics 20:1464–1465 · DOI
  18. Kaminska B, Gozdz A, Zawadzka M, Ellert-Miklaszewska A, Lipko M (2009) MAPK signal transduction underlying brain inflammation and gliosis as therapeutic target. Anat Rec 292:1902–1913 · DOI
  19. Beuscher HU, Gunther C, Rollinghoff M (1990) IL-1β is secreted by activated murine macrophages as biologically inactive precursor. J Immunol 144:2179–2183 · DOI
  20. Denes A, Pinteaux E, Rothwell NJ, Allan SM (2011) Interleukin-1 and stroke: biomarker, harbinger of damage, and therapeutic target. Cerebrovasc Dis 32:517–527 · DOI
  21. Attur MG, Patel R, Thakker G, Vyas P, Levartovsky D, Patel P, Naqvi S, Raza R, Patel K, Abramson D et al (2000) Differential anti-inflammatory effects of immunosuppressive drugs: cyclosporin, rapamycin and FK-506 on inducible nitric oxide synthase, nitric oxide, cyclooxygenase-2 and PGE2 production. Inflamm Res 49:20–26 · DOI
  22. Dusting GJ, Akita K, Hickey H, Smith M, Gurevich V (1999) Cyclosporin A and tacrolimus (FK506) suppress expression of inducible nitric oxide synthase in vitro by different mechanisms. Br J Pharmacol 128:337–344 · DOI
  23. Hamalainen M, Lahti A, Moilanen E (2002) Calcineurin inhibitors, cyclosporin A and tacrolimus inhibit expression of inducible nitric oxide synthase in colon epithelial and macrophage cell lines. Eur J Pharmacol 448:239–244 · DOI
  24. Strestikova P, Otova B, Filipec M, Masek K, Farghali H (2001) Different mechanisms in inhibition of rat macrophage nitric oxide synthase expression by FK 506 and cyclosporin A. Immunopharmacol Immunotoxicol 23:67–74 · DOI
  25. Minghetti L (2004) Cyclooxygenase-2 (COX-2) in inflammatory and degenerative brain diseases. J Neuropathol Exp Neurol 63:901–910 · DOI
  26. Kumar S, Boehm J, Lee JC (2003) p38 MAP kinases: key signalling molecules as therapeutic targets for inflammatory diseases. Nat Rev Drug Discov 2:717–726 · DOI
  27. Kaminska B (2005) MAPK signalling pathways as molecular targets for anti-inflammatory therapy—from molecular mechanisms to therapeutic benefits. Biochim Biophys Acta Proteomics 1754:253–262 · DOI · Paper page
  28. Hidding U, Mielke K, Waetzig V, Brecht S, Hanisch U, Behrens A, Wagner E, Herdegen T (2002) The c-Jun N-terminal kinases in cerebral microglia: immunological functions in the brain. Biochem Pharmacol 64:781–788 · DOI
  29. Lund S, Porzgen P, Mortensen AL, Hasseldam H, Bozyczko-Coyne D, Morath S, Hartung T, Bianchi M, Ghezzi P, Bsibsi M et al (2005) Inhibition of microglial inflammation by the MLK inhibitor CEP-1347. J Neurochem 92:1439–1451 · DOI
  30. Waetzig V, Czeloth K, Hidding U, Mielke K, Kanzow M, Brecht S, Goetz M, Lucius R, Herdegen T, Hanisch UK (2005) c-Jun N-terminal kinases (JNKs) mediate pro-inflammatory actions of microglia. Glia 50:235–246 · DOI
  31. Brecht S, Waetzig V, Hidding U, Hanisch UK, Walther M, Herdegen T, Neiss WF (2009) FK506 protects against various immune responses and secondary degeneration following cerebral ischemia. Anat Rec 292:1993–2001 · DOI
  32. Kaminska B, Swiatek-Machado K (2008) Targeting signaling pathways with small molecules to treat autoimmune disorders. Expert Rev Clin Immunolog 4:93–112 · DOI
  33. Barone FC, Irving EA, Ray AM, Lee JC, Kassis S, Kumar S, Badger AM, White RF, McVey MJ, Legos JJ et al (2001) SB 239063, a second-generation p38 mitogen-activated protein kinase inhibitor, reduces brain injury and neurological deficits in cerebral focal ischemia. J Pharmacol Exp Ther 296:312–321
  34. Piao CS, Kim JB, Han PL, Lee JK (2003) Administration of the p38 MAPK inhibitor SB203580 affords brain protection with a wide therapeutic window against focal ischemic insult. J Neurosci Res 73:537–544 · DOI

Cited by

Sorted by citations

Metadata

Authors
Zawadzka, M., Dabrowski, M., Gozdz, A., Szadujkis, B., Sliwa, M., Lipko, M., & Kaminska, B.
Venue
Journal of Molecular Medicine
Published
2012-07-18
Volume
90
Issue
12
Pages
1459-1471
ISSN
  • 0946-2716
  • 1432-1440
Cited by
34
References
1
Language
en

About these checks

Registry, retraction, Cites and statistics results are computed, not judged, with one exception: a printed reference that no index lists is read once by a model before it counts as a citation error. Claims are extracted by a model and kept only when their quote appears verbatim in the text; each cited source is then checked, with a model’s help, for whether it says what the claim relies on. Those verdicts can be wrong — read the claim’s quote and the cited source before relying on one.

Statistics and arithmetic are recomputed, not judged.

Confidence bands are shown only for fields calibrated on our annotated test set. None is calibrated yet, so no band is shown.

What counts as a claim ›How we measure confidence ›How we check this ›

Are you an author, or do you see a problem with this page? Request a review