

The DOI matches its Crossref record; 65 of the 65 references it cites were found in a registry or an index.
Role of the anterior insula in task-level control and focal attention
Open accessAbstract
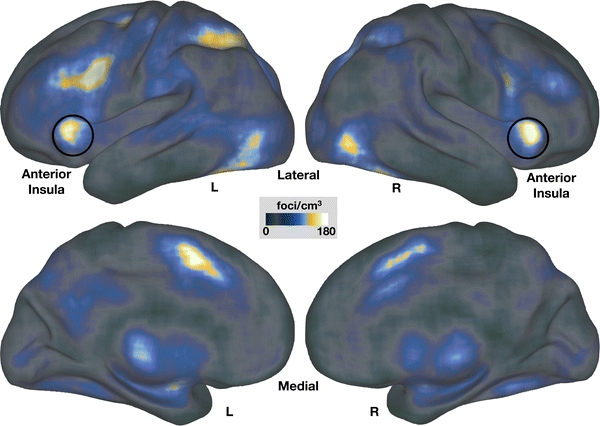
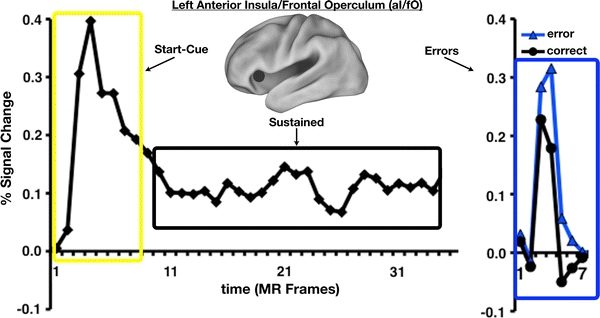
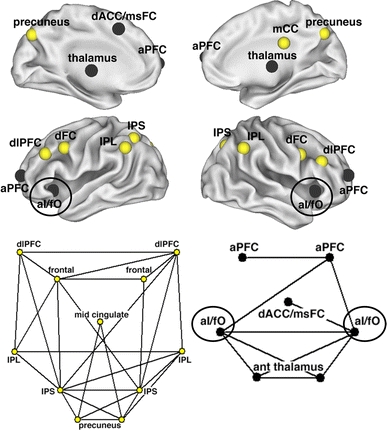
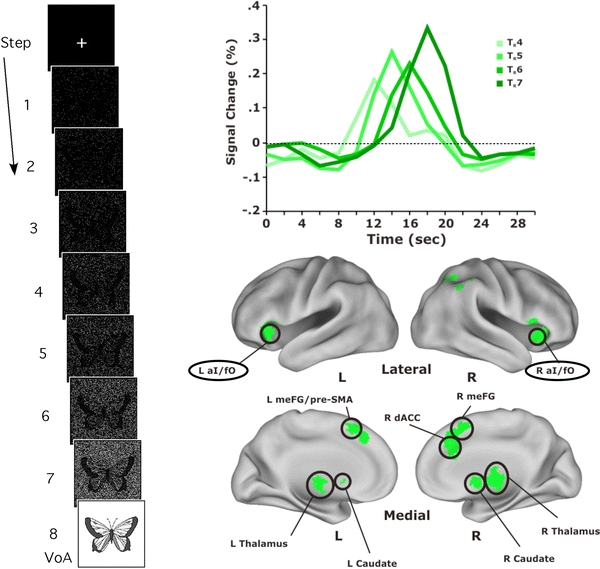
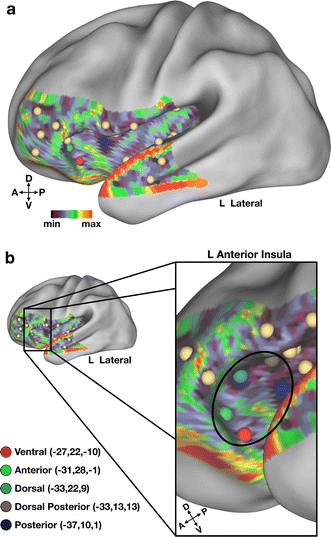
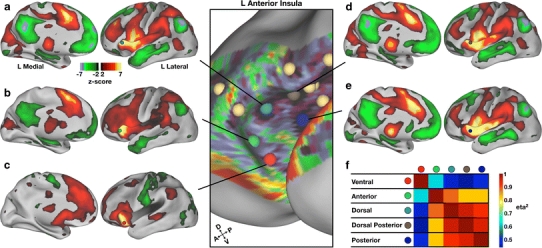
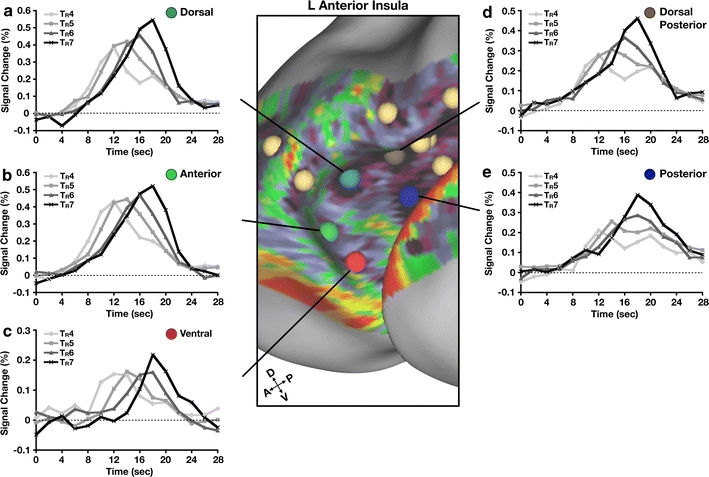
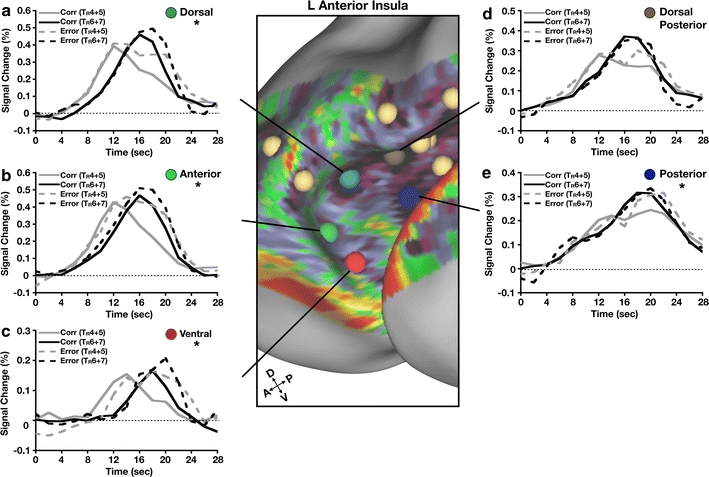
In humans, the anterior insula (aI) has been the topic of considerable research and ascribed a vast number of functional properties by way of neuroimaging and lesion studies. Here, we argue that the aI, at least in part, plays a role in domain-general attentional control and highlight studies (Dosenbach et al. 2006; Dosenbach et al. 2007) supporting this view. Additionally, we discuss a study (Ploran et al. 2007) that implicates aI in processes related to the capture of focal attention. Task-level control and focal attention may or may not reflect information processing supported by a single functional area (within the aI). Therefore, we apply a novel technique (Cohen et al. 2008) that utilizes resting state functional connectivity MRI (rs-fcMRI) to determine whether separable regions exist within the aI. rs-fcMRI mapping suggests that the ventral portion of the aI is distinguishable from more dorsal/anterior regions, which are themselves distinct from more posterior parts of the aI. When these regions are applied to functional MRI (fMRI) data, the ventral and dorsal/anterior regions support processes potentially related to both task-level control and focal attention, whereas the more posterior aI regions did not. These findings suggest that there exists some functional heterogeneity within aI that may subserve related but distinct types of higher-order cognitive processing.
Overview
The claims and statistics of this paper haven’t been checked yet.
Run the check — free, no account needed. It reads the open-access text and checks the sources it cites.
Integrity signals
Registry
Cites
Statistics
Figures
Verification
Claims the paper makes
The claims and statistics of this paper haven’t been checked yet.
Run the check — free, no account needed. It reads the open-access text and checks the sources it cites.
Claims other papers make about this one
Each is checked against this paper’s own text: does it say what the citing paper says it does?
The source backs part of the claim, not all of it — or backs it for a different population, condition or comparison.
In the citing paper
“Indeed, meta-analyses indicate that it is among the most frequently reported areas of activation in functional MRI research (Clark-Polner et al., 2016; Nelson et al., 2010; Yarkoni et al., 2011), with reported activations in processes including pain, emotion, reward, conflict monitoring, error detection, memory, and social cognition (Beckmann et al., 2009; Wager et al., 2016).”
From Motivation in the Service of Allostasis: The Role of Anterior Mid-Cingulate Cortex (2019) · cites this paper as Nelson et al., 2010
Experimental — accuracy not yet measuredThe cited source says what the claim attributes to it.
In the citing paper
“This is also in line with the assumption that the aIns is involved when a feedback is processed consciously (Nelson et al., 2010; Wheeler et al., 2008).”
From Cognitive flexibility in adolescence: Neural and behavioral mechanisms of reward prediction error processing in adaptive decision making during development (2015) · cites this paper as Nelson et al., 2010
In the citing paper
“The aIns is a central hub in the brain and is one of the most commonly activated areas in human neuroimaging studies (Nelson et al., 2010).”
From Cognitive flexibility in adolescence: Neural and behavioral mechanisms of reward prediction error processing in adaptive decision making during development (2015) · cites this paper as Nelson et al., 2010
In the citing paper
“It is well known that aIns activity often coincides with activation in the dmPFC (cf. Hauser et al., 2014a, 2014b; Nelson et al., 2010; Seymour et al., 2004).”
From Cognitive flexibility in adolescence: Neural and behavioral mechanisms of reward prediction error processing in adaptive decision making during development (2015) · cites this paper as Nelson et al., 2010
In the citing paper
“Unsurprisingly, the aIns has been ascribed to a wide variety of functions from processing visceral and emotional information (Critchley, 2005) to controlling attention and task demands (Dosenbach et al., 2006, 2007; Nelson et al., 2010).”
From Cognitive flexibility in adolescence: Neural and behavioral mechanisms of reward prediction error processing in adaptive decision making during development (2015) · cites this paper as Nelson et al., 2010
Self-check
Percentages, sums and reported differences re-computed from the paper’s own numbers.
The self-check needs the paper’s full text.
Citations
Cites
A Computational Approach to Edge Detection
Canny, J. (1986) · IEEE Transactions on Pattern Analysis and Machine Intelligence · doi:10.1109/tpami.1986.4767851 · Cited by 30,004
Co-Planar Stereotaxic Atlas of the Human Brain
Talairach, J., & Tournoux, P. (1988) · Medical Entomology and Zoology · Cited by 11,798
The human brain is intrinsically organized into dynamic, anticorrelated functional networks
Fox, M. D., Snyder, A. Z., Vincent, J. L., Corbetta, M., Van Essen, D. C., & Raichle, M. E. (2005) · Proceedings of the National Academy of Sciences · doi:10.1073/pnas.0504136102 · Cited by 8,553
Co-planar stereotaxic atlas of the human brain
Laitinen, L. (1989) · Clinical Neurology and Neurosurgery · doi:10.1016/0303-8467(89)90128-5 · Cited by 7,565
How do you feel — now? The anterior insula and human awareness
(Bud) Craig, A. D. (2009) · Nature Reviews Neuroscience · doi:10.1038/nrn2555 · Cited by 6,657
Does Rejection Hurt? An fMRI Study of Social Exclusion
Eisenberger, N. I., Lieberman, M. D., & Williams, K. D. (2003) · Science · doi:10.1126/science.1089134 · Cited by 3,849 · cited 2×
“…to, studies of the neurophysiology of reward (Linke et al. 2010), dread (Berns et al. 2006), disappointment and regret (Chua et al. 2009), social rejection (Eisenberger et al. 2003), errors (Hester et al. 2004), error awareness (Klein et al. 2007), and decision-making (Thielscher and Pessoa 2007).”
BackgroundDistinct brain networks for adaptive and stable task control in humans
Dosenbach, N. U. F., Fair, D. A., Miezin, F. M., Cohen, A. L., Wenger, K. K., Dosenbach, R. A. T., Fox, M. D., Snyder, A. Z., Vincent, J. L., Raichle, M. E., et al. (2007) · Proceedings of the National Academy of Sciences · doi:10.1073/pnas.0704320104 · Cited by 2,632
Self-citationCommon regions of the human frontal lobe recruited by diverse cognitive demands
Duncan, J., & Owen, A. M. (2000) · Trends in Neurosciences · doi:10.1016/s0166-2236(00)01633-7 · Cited by 2,498
A dual-networks architecture of top-down control
Dosenbach, N. U. F., Fair, D. A., Cohen, A. L., Schlaggar, B. L., & Petersen, S. E. (2008) · Trends in Cognitive Sciences · doi:10.1016/j.tics.2008.01.001 · Cited by 1,931
Self-citationAnalysis of functional MRI time‐series
Friston, K. J., Jezzard, P., & Turner, R. (1994) · Human Brain Mapping · doi:10.1002/hbm.460010207 · Cited by 1,835
Cited by
Sorted by citations
Items 301–400 of 435
Neural Correlates of Illusory Line Motion
Hamm, J. P., Crawford, T. J., Nebl, H., Kean, M., Williams, S., & Ettinger, U. (2014) · PLoS ONE · doi:10.1371/journal.pone.0087595 · Cited by 10
Functional Neuroimaging of Deficits in Cognitive Control
Mackie, M., & Fan, J. (2017) · Elsevier eBooks · doi:10.1016/b978-0-12-803676-1.00011-8 · Cited by 12
Kranz, M. B., Voss, M. W., Cooke, G. E., Banducci, S. E., Burzynska, A. Z., & Kramer, A. F. (2018) · PLoS ONE · doi:10.1371/journal.pone.0204280 · Cited by 11
The relationship between craving and insular morphometry in regular cocaine users: Does sex matter?
Malek, G. S. A., Goudriaan, A. E., & Kaag, A. M. (2022) · Addiction Biology · doi:10.1111/adb.13157 · Cited by 10
Modulatory Effects of Ketamine and Lamotrigine on Cognition: Emotion Interaction in the Brain
Gärtner, M., Weigand, A., Keicher, C., Meiering, M. S., Weigner, D., Carstens, L., Hertrampf, R., Beckmann, C. F., Mennes, M., Wunder, A., et al. (2023) · Neuropsychobiology · doi:10.1159/000528315 · Cited by 11
Schettino, A., Loeys, T., & Pourtois, G. (2013) · NeuroImage · doi:10.1016/j.neuroimage.2013.04.115 · Cited by 13
Integrative Modeling of Prefrontal Cortex
Alexander, W. H., Vassena, E., Deraeve, J., & Langford, Z. D. (2017) · Journal of Cognitive Neuroscience · doi:10.1162/jocn_a_01138 · Cited by 12
The effects of childhood adversity: Two specific neural patterns
Yan, L., Kraaijenvanger, E. J., Wennekers, R., Müller, V. I., Eickhoff, S. B., Fernández, G., Holz, N. E., & Kohn, N. (2025) · Neuroscience & Biobehavioral Reviews · doi:10.1016/j.neubiorev.2025.106176 · Cited by 9
Moszak, M., Marcickiewicz, J., Pelczyńska, M., & Bogdański, P. (2025) · Nutrients · doi:10.3390/nu17101662 · Cited by 12
Pacheco‐Colón, I., Washington, S. D., Sprouse, C., Helman, G., Gropman, A. L., & VanMeter, J. W. (2015) · PLoS ONE · doi:10.1371/journal.pone.0129595 · Cited by 9
Type 1 diabetes and working memory processing of emotional faces
González‐Garrido, A. A., Gallardo‐Moreno, G. B., & Gómez‐Velázquez, F. R. (2019) · Behavioural Brain Research · doi:10.1016/j.bbr.2019.02.008 · Cited by 11
Context-prosody interaction in sarcasm comprehension: A functional magnetic resonance imaging study
Nakamura, T., Matsui, T., Utsumi, A., Sumiya, M., Nakagawa, E., & Sadato, N. (2022) · Neuropsychologia · doi:10.1016/j.neuropsychologia.2022.108213 · Cited by 11
Nouchi, R., Takeuchi, H., Taki, Y., Sekiguchi, A., Kotozaki, Y., Nakagawa, S., Miyauchi, C. M., Iizuka, K., Yokoyama, R., Shinada, T., et al. (2016) · Scientific Reports · doi:10.1038/srep31231 · Cited by 10
Zonneveld, H. I., Roshchupkin, G. V., Adams, H. H. H., Gutman, B. A., van der Lugt, A., Niessen, W. J., Vernooij, M. W., & Ikram, M. A. (2019) · Journal of Alzheimer s Disease · doi:10.3233/jad-181297 · Cited by 9
Dunne, L., & Opitz, B. (2020) · Brain and Cognition · doi:10.1016/j.bandc.2020.105602 · Cited by 10
Wen, X., Li, W., Liu, Y., Liu, Z., Zhao, P., Zhu, Z., & Wu, X. (2021) · Cognitive Affective & Behavioral Neuroscience · doi:10.3758/s13415-021-00892-y · Cited by 10
Functional Parcellation of Human Brain Using Localized Topo-Connectivity Mapping
Zhao, Y., Gao, Y., Li, M., Anderson, A. W., Ding, Z., & Gore, J. C. (2022) · IEEE Transactions on Medical Imaging · doi:10.1109/tmi.2022.3168888 · Cited by 9
Neural networks involved in learning lexical-semantic and syntactic information in a second language
Mueller, J. L., Rueschemeyer, S., Ono, K., Sugiura, M., Sadato, N., & Nakamura, A. (2014) · Frontiers in Psychology · doi:10.3389/fpsyg.2014.01209 · Cited by 10
The Structural Correlates of Statistical Information Processing during Speech Perception
Deschamps, I., Hasson, U., & Tremblay, P. (2016) · PLoS ONE · doi:10.1371/journal.pone.0149375 · Cited by 9
The cingulo-opercular network is composed of two distinct sub-systemsPreprint
Gratton, C., Dworetsky, A., Adeyemo, B., Seitzman, B. A., Smith, D. M., Petersen, S. E., & Neta, M. (2022) · bioRxiv (Cold Spring Harbor Laboratory) · doi:10.1101/2022.09.16.508254 · Cited by 12
Self-citationAltered resting-state brain function in endurance athletes
Yan, S., Zhao, G. W., Zhang, Q., Liu, L., Bai, X., & Jin, H. (2024) · Cerebral Cortex · doi:10.1093/cercor/bhae076 · Cited by 8
Gilmore, A. W., Nelson, S. M., Naaz, F., Shaffer, R. A., & McDermott, K. (2018) · Cerebral Cortex · doi:10.1093/cercor/bhx264 · Cited by 7
Self-citationThe Role of Frontoparietal Cortex across the Functional Stages of Visual Search
Remington, R. W., Vromen, J. M. G., Becker, S. I., Baumann, O., & Mattingley, J. B. (2020) · Journal of Cognitive Neuroscience · doi:10.1162/jocn_a_01632 · Cited by 8
Elkhetali, A. S., Fleming, L. L., Vaden, R. J., Nenert, R. E., Mendle, J., & Visscher, K. (2018) · NeuroImage · doi:10.1016/j.neuroimage.2018.09.040 · Cited by 8
Qiao, L., Luo, X., Zhang, L., Chen, A., Li, H., & Qiu, J. (2020) · Scientific Reports · doi:10.1038/s41598-020-76211-1 · Cited by 7
Reward-related neural correlates in adolescents with excess body weight
Bhutani, S., Christian, I. R., Palumbo, D., & Wiggins, J. L. (2021) · NeuroImage Clinical · doi:10.1016/j.nicl.2021.102618 · Cited by 8
Functional brain activity during motor control and pain processing in chronic jaw pain
Roy, A., Wang, W., Ho, R. L. M., Ribeiro-Dasilva, M., Fillingim, R. B., & Coombes, S. A. (2018) · Pain · doi:10.1097/j.pain.0000000000001366 · Cited by 8
Edgar, N., Castanheira, K. D. S., Turner, G. R., Spreng, R. N., Vassena, E., & Otto, A. R. (2026) · Cognitive Affective & Behavioral Neuroscience · doi:10.3758/s13415-026-01405-5 · Cited by 9
Zhong, S., Lin, J.-P., Zhang, L., Wang, S., Kemp, G. J., Li, L., & Gong, Q.-Y. (2024) · Translational Psychiatry · doi:10.1038/s41398-024-03091-8 · Cited by 6
Neural substrates of purely endogenous, self-regulatory control of attention
Han, S. W., Shin, H., Jeong, D., Jung, S., Bae, E., Kim, J. Y., Baek, H., & Kim, K.-H. (2018) · Scientific Reports · doi:10.1038/s41598-018-19508-6 · Cited by 7
Citherlet, D., Boucher, O., Gravel, V., Roy-Côté, F., Bouthillier, A., & Nguyen, D. K. (2020) · Epilepsy & Behavior · doi:10.1016/j.yebeh.2020.107264 · Cited by 7
Starski, P. A., Sergio, T. D. O., & Hopf, F. W. (2023) · Addiction Neuroscience · doi:10.1016/j.addicn.2023.100102 · Cited by 8
The effect of olfactory stimuli on the balance ability of stroke patients
Gim, M., Lee, S., Yoo, K.-T., Bae, J.-Y., Kim, M.-K., & Choi, J. (2015) · Journal of Physical Therapy Science · doi:10.1589/jpts.27.109 · Cited by 7
Mansouri, F. A., & Buckley, M. J. (2018) · Advances in Neurobiology · doi:10.1007/978-3-319-94593-4_4 · Cited by 7
Reimagining Physician Development and Lifelong Learning: An Ecological Framework
Mazmanian, P. E., Cervero, R. M., & Durning, S. J. (2021) · Journal of Continuing Education in the Health Professions · doi:10.1097/ceh.0000000000000406 · Cited by 9
Experiencing, Psychopathology, and the Tripartite Mind
Ozier, D., & Westbury, C. F. (2013) · Journal of Behavioral and Brain Science · doi:10.4236/jbbs.2013.32026 · Cited by 6
Wei, H., Chen, Y., Yu, Y., Guo, X., Zhou, G., Zhou, Q.-Q., Qu, L.-J., Yin, X., Li, J., & Zhang, H. (2021) · Brain Imaging and Behavior · doi:10.1007/s11682-020-00446-9 · Cited by 6
Putra, H. A., Park, K., Yamashita, F., Nakagawa, Y., & Murai, T. (2022) · Frontiers in Behavioral Neuroscience · doi:10.3389/fnbeh.2022.951754 · Cited by 6
Yawning induced by focal electrical stimulation in the human brain
Joshi, S. S., Bayat, A., Gagnon, L., Shields, D. C., & Koubeissi, M. Z. (2016) · Epilepsy & Behavior · doi:10.1016/j.yebeh.2016.09.006 · Cited by 6
Insula cortex gates the interplay of action observation and preparation for controlled imitation
Campbell, M. E. J., Nguyen, V. T., Cunnington, R., & Breakspear, M. J. (2021) · Neuropsychologia · doi:10.1016/j.neuropsychologia.2021.108021 · Cited by 7
Addicott, M. A. (2019) · Elsevier eBooks · doi:10.1016/b978-0-12-815298-0.00009-5 · Cited by 6
Elsayed, N. M., Rappaport, B. I., Luby, J. L., & Barch, D. M. (2021) · Developmental Cognitive Neuroscience · doi:10.1016/j.dcn.2021.100952 · Cited by 7
Role of the Insula in Visual and Auditory Perception
Protas, M. (2018) · Springer eBooks · doi:10.1007/978-3-319-75468-0_16 · Cited by 5
Not all smokers are alike: the hidden cost of sustained attention during nicotine abstinence
Deshpande, H. U., Fedota, J. R., Castillo, J., Salmeron, B. J., Ross, T. J., & Stein, E. A. (2022) · Neuropsychopharmacology · doi:10.1038/s41386-022-01275-8 · Cited by 4
Najar, D., Dichev, J., & Stoyanov, D. (2024) · Journal of Clinical Medicine · doi:10.3390/jcm13154363 · Cited by 5
Oosterwijk, S., Touroutoglou, A., & Lindquist, K. A. (2015) · UvA-DARE (University of Amsterdam) · Cited by 5
Otto, T., Zijlstra, F., & Goebel, R. (2018) · PLoS ONE · doi:10.1371/journal.pone.0198204 · Cited by 4
Interactive Effects of HIV Infection and Cannabis Use on Insula Subregion Functional Connectivity
Flannery, J. S., Riedel, M. C., Salo, T., Hill-Bowen, L. D., Poudel, R., Adams, A. R., Laird, A. R., González, R., & Sutherland, M. T. (2021) · Journal of Neuroimmune Pharmacology · doi:10.1007/s11481-021-10005-8 · Cited by 5
The contralateral effects of anticipated stimuli on brain activity measured by ERP and fMRI
Ohgami, Y., Kotani, Y., Yoshida, N., Akai, H., Kunimatsu, A., Kiryu, S., & Inoue, Y. (2022) · Psychophysiology · doi:10.1111/psyp.14189 · Cited by 4
Hansen, H. A., Norris, J. E., Bain, C. M., Ethridge, L. E., & Tardif, C. L. (2026) · Human Brain Mapping · doi:10.1002/hbm.70468 · Cited by 5
Faridi, F., Seyedebrahimi, A., & Khosrowabadi, R. (2021) · Basic and Clinical Neuroscience Journal · doi:10.32598/bcn.2021.2262.1 · Cited by 4
Vazquez-Trejo, V., Nardos, B., Schlaggar, B. L., Fair, D. A., & Miranda-Domínguez, Ó. (2022) · Frontiers in Neuroscience · doi:10.3389/fnins.2022.951907 · Cited by 4
Self-citationVisuomotor Dissociation in Cerebral Scaling of Size
Potgieser, A. R. E., & de Jong, B. M. (2016) · PLoS ONE · doi:10.1371/journal.pone.0151484 · Cited by 4
Agmon, G., Bain, J. S., & Deschamps, I. (2021) · Experimental Brain Research · doi:10.1007/s00221-021-06067-y · Cited by 4
Parabrachial-insular stimulation does not wake mice
Grady, F. S., Graff, S. A., Resch, J. M., & Geerling, J. C. (2022) · Journal of Neurophysiology · doi:10.1152/jn.00318.2022 · Cited by 5
Chat2Brain: A Method for Mapping Open-Ended Semantic Queries to Brain Activation Maps
Wei, Y., Zhang, T., Zhang, H., Zhong, T., Zhao, L., Liu, Z., Ma, C., Zhang, S., Shang, M., Du, L., et al. (2023) · IEEE International Conference on Bioinformatics and Biomedicine (BIBM) · doi:10.1109/bibm58861.2023.10385933 · Cited by 4
Brain imaging of executive function with the computerised multiple elements test
Fuentes‐Claramonte, P., Santo-Angles, A., Argila‐Plaza, I., Lechón, M., Guardiola-Ripoll, M., Almodóvar-Payá, C., Cullen, B., Evans, J. J., Manly, T., Gee, A. L., et al. (2021) · Brain Imaging and Behavior · doi:10.1007/s11682-020-00425-0 · Cited by 6
Li, Z., Tong, G., Wang, Y., Ruan, H., Zheng, Z., Cheng, J., & Wang, Z. (2024) · The World Journal of Biological Psychiatry · doi:10.1080/15622975.2023.2251057 · Cited by 4
Effector-independent Representations Guide Sequential Target Selection Biases in Action
O’Bryan, S. R., Moher, J., McCarthy, J. D., & Song, J. (2024) · Journal of Cognitive Neuroscience · doi:10.1162/jocn_a_02102 · Cited by 3
Transient alteration of awareness triggered by direct electrical stimulation of the brain
Lévi‐Strauss, J., Makhalova, J., Villalon, S. M., Carron, R., Bénar, C., & Bartoloméi, F. (2024) · Brain stimulation · doi:10.1016/j.brs.2024.08.013 · Cited by 3
Doll, L., Heiland, S., & Gutschalk, A. (2025) · Journal of Cognitive Neuroscience · doi:10.1162/jocn_a_02324 · Cited by 5
Brain Functional Architecture and Human Understanding
Yufik, Y. M. (2021) · IntechOpen eBooks · doi:10.5772/intechopen.95594 · Cited by 3
Starski, P. A., Morningstar, M. D., Katner, S. N., Frasier, R. M., Sergio, T. D. O., Wean, S. E., Lapish, C. C., & Hopf, F. W. (2022) · bioRxiv (Cold Spring Harbor Laboratory) · doi:10.1101/2022.05.24.493243 · Cited by 3
Electrophysiological indices of reward anticipation as ADHD risk and prognostic biomarkers
Bunford, N., Ágrez, K., Hámori, G., Koller, J., Pulay, A. J., Nemoda, Z., & Réthelyi, J. (2024) · European Child & Adolescent Psychiatry · doi:10.1007/s00787-024-02606-4 · Cited by 2
MCI-LB brain networks reorganization in relation to specific cognitive domains deficits
Onofrj, V., Franciotti, R., Mitterová, K., Brabenec, L., Gajdoš, M., Morávková, I., Ferretti, A., Spadone, S., Padulo, C., Baldassarre, A., et al. (2026) · Scientific Reports · doi:10.1038/s41598-026-36953-w · Cited by 2
Real-time fMRI-triggered experience sampling: A proof-of-concept study
Bounyarith, T., Braun, D., & Kucyi, A. (2026) · Imaging Neuroscience · doi:10.1162/imag.a.1268 · Cited by 2
Lee, A., Särkkä, A., Madhyastha, T. M., & Grabowski, T. J. (2017) · Biometrical Journal · doi:10.1002/bimj.201600212 · Cited by 2
The effects of age-bias on neural correlates of successful and unsuccessful response inhibition
Hanley, C., Burns, N., Thomas, H. R., Marstaller, L., & Burianová, H. (2022) · Behavioural Brain Research · doi:10.1016/j.bbr.2022.113877 · Cited by 2
Interconnected sub-networks of the macaque monkey gustatory connectome
Hartig, R., Karimi, A., & Evrard, H. (2023) · Frontiers in Neuroscience · doi:10.3389/fnins.2022.818800 · Cited by 3
Sergio, T. D. O., Starski, P. A., & Hopf, F. W. (2023) · Neuromethods · doi:10.1007/978-1-0716-3267-3_4 · Cited by 2
Surgery-induced reduction in inflammation relates to improved neural inhibitory control in obesity
Kaufmann, L., Custers, E., Vreeken, D., Snabel, J. M., Morrison, M. C., Kleemann, R., Wiesmann, M., Hazebroek, E. J., Aarts, E., & Kiliaan, A. J. (2025) · Brain Behavior and Immunity · doi:10.1016/j.bbi.2025.07.012 · Cited by 2
New Reflections on Mirror Neuron Research, the Tower of Babel, and Intercultural Education
Westbrook, T. P. (2015) · Christian Higher Education · doi:10.1080/15363759.2015.1079749 · Cited by 2
Cognitive aspects of human motor activity: Contribution of right hemisphere and cerebellum
Sedov, A. S., Popov, V., Filyushkina, V. I., Semenova, U., Orlov, V. A., Velichkovsky, B. M., & Ushakov, V. (2017) · Psychology in Russia State of Art · doi:10.11621/pir.2017.0314 · Cited by 2
Aging and goal-directed cognition: Cognitive control, inhibition, and motivated cognition
Yang, L., & Skrotzki, C. (2022) · The Psychology of learning and motivation/The psychology of learning and motivation · doi:10.1016/bs.plm.2022.08.002 · Cited by 4
Neurobiology and Functional Anatomy of Tic Disorders
Greene, D. J., Kim, S., BLACK, K. J., & Schlaggar, B. L. (2022) · Oxford University Press eBooks · doi:10.1093/med/9780197543214.003.0014 · Cited by 2
Self-citationGerrans, P. (2024) · Oxford University Press eBooks · doi:10.1093/oso/9780198872221.003.0009 · Cited by 2
Pain Comorbidities with Attention Deficit: A Narrative Review of Clinical and Preclinical Research
Liang, H.-B., He, W., Liu, Y., & Wang, H. (2024) · Journal of Pain Research · doi:10.2147/jpr.s443915 · Cited by 4
Functional connectivity parcellation of the human brain
Schaefer, A., Kong, R., & Yeo, B. T. T. (2016) · Elsevier eBooks · doi:10.1016/b978-0-12-804076-8.00001-3 · Cited by 2
Perfil y endofenotipos neuropsicológicos en TDAH: Una revisión
Rubio, B., Castrillo, J., Herreros, Ó., Gastaminza, X., & Expósito, S. H. (2016) · Revista de Psiquiatría Infanto-Juvenil · doi:10.31766/revpsij.v33n1a1 · Cited by 3
The neural dynamics associated with computational complexityPreprint
Franco, J. P., Bossaerts, P. L., & Murawski, C. (2022) · bioRxiv (Cold Spring Harbor Laboratory) · doi:10.1101/2022.01.05.475102 · Cited by 2
Jankowski, K. F., & Pfeifer, J. H. (2020) · PsyArXiv (OSF Preprints) · doi:10.31234/osf.io/uj4tv · Cited by 2
McIntyre, C. C., O’Donnell, S. M., Khodaei, M., Lyday, R. G., Burdette, J. H., & Laurienti, P. J. (2026) · Human Brain Mapping · doi:10.1002/hbm.70525 · Cited by 1
Harr, A. E., O’Leary, M. R., Vogt, E., Suresh, S., & Hallock, H. L. (2026) · NeuroImage · doi:10.1016/j.neuroimage.2026.121890 · Cited by 1
Facing Ambiguity: What We Do in the Space Between Stimulus and Response
Neta, M. (2026) · Current Directions in Psychological Science · doi:10.1177/09637214261429347 · Cited by 1
Insula, a “mysterious” island in our brain – minireview
Palkovits, M. (2010) · Orvosi Hetilap · doi:10.1556/oh.2010.29004 · Cited by 1
Disrupted Resting-State Brain Functional Architecture in Amphetamine-Type Stimulant Abusers
Chen, Q., Zheng, D., Cui, S., Yan, K. J., Fan, C. X., Zhang, G. F., Xiao, L., Li, Y., Yuan, X., Xie, K., et al. (2018) · Neuropsychiatry · doi:10.4172/neuropsychiatry.1000346 · Cited by 1
Processing Internal and External Stimuli in the Insula: A Very Rough Simplification
Barrós‐Loscertales, A. (2018) · Springer eBooks · doi:10.1007/978-3-319-75468-0_21 · Cited by 1
Hanley, C., Burns, N., Thomas, H. R., Marstaller, L., & Burianová, H. (2023) · Neurobiology of Aging · doi:10.1016/j.neurobiolaging.2023.07.004 · Cited by 1
Neurobiology of Consciousness: Current Research and Perspectives
Płonka, B. K. (2015) · Studia Humana · doi:10.1515/sh-2015-0023 · Cited by 2
Virtual reality rehabilitation in spinal cord injury patients
Villiger, M. (2012) · Repository for Publications and Research Data (ETH Zurich) · doi:10.3929/ethz-a-007594458 · Cited by 1
Investigating the Role of the Right Inferior Frontal Gyrus in Response Inhibition: An fMRI Approach
Zacharov, O. (2016) · NORA - Norwegian Open Research Archives · Cited by 1
Commentary: Visual Feedback of Tongue Movement for Novel Speech Sound Learning
Berthier, M. L., & Moreno‐Torres, I. (2016) · Frontiers in Human Neuroscience · doi:10.3389/fnhum.2016.00662 · Cited by 1
The loss when Losing a Loved one: Epidemiological studies of prolonged grief disorder
Pérez, H. C. S. (2019) · RePub (Erasmus University Rotterdam) · Cited by 1
Neuromotor Organization of Speech Production
Tremblay, P., Deschamps, I., & Dick, A. S. (2019) · Oxford University Press eBooks · doi:10.1093/oxfordhb/9780190672027.013.15 · Cited by 3
Layer-dependent activity in the human superior colliculus during working memoryPreprint
Chen, D., Kragel, P. A., Wager, T. D., Wald, L. L., Bianciardi, M., Satpute, A. B., Quigley, K. S., Barrett, L. F., Katsumi, Y., & Theriault, J. E. (2022) · bioRxiv (Cold Spring Harbor Laboratory) · doi:10.1101/2022.12.06.518975 · Cited by 2
Energetics of the human mind : an effort to show the neural correlates of mental efforts
Otto, T. (2013) · Research Publications (Maastricht University) · doi:10.26481/dis.20131115to
The Representation of Emotion in Autonomic and Central Nervous System Activity
Kragel, P. A. (2015) · DukeSpace (Duke University)
Erleben und Verhalten unter Stress in Abhängigkeit von der kardialen Sensibilität
Kindermann, N. K. (2013) · Electronic Theses of LMU Munich (Ludwig-Maximilians-Universität München) · doi:10.5282/edoc.16074
Antagonistic Activation Patterns Underlie Multi-functionality of the Right Temporo-Parietal Junction
Bzdok, D., Langner, R., Eickhoff, S. B., Laird, A. R., & Fox, P. T. (2013) · International Workshop on Pattern Recognition in NeuroImaging · doi:10.1109/prni.2013.25
Metadata
- Authors
- Nelson, S. M., Dosenbach, N. U. F., Cohen, A. L., Wheeler, M. E., Schlaggar, B. L., & Petersen, S. E.
- Affiliations
- Washington University in St. Louis (US)
- University of Pittsburgh (US)
- Corresponding author
- Nelson, Steven M.
- Venue
- Brain Structure and Function
- Published
- 2010-05-29
- Volume
- 214
- Issue
- 5-6
- Pages
- 669-680
- ISSN
- 1863-2653 (ISSN-L)
- 1863-2661
- PMC
- PMC2886908
- OpenAlex
- W1973254033
- Cited by
- 435
- References
- 65
- Citations by year
- 2026: 11 · 2025: 12 · 2024: 15 · 2023: 20 · 2022: 28 · 2021: 23 · 2020: 26 · 2019: 25 · 2018: 34 · 2017: 31 · 2016: 37 · 2015: 41 · 2014: 31 · 2013: 48 · 2012: 28
- FWCI
- 2.34
- Type
- journal article
- Language
- en
- Open access
- hybrid
- doi.org
- Licence
- cc-by-nc
- Locations
- Brain Structure and Function (publishedVersion, cc-by-nc)
- PubMed Central (publishedVersion, cc-by-nc)
- PubMed (publishedVersion)
- Funders
- National Science Foundation
- National Institutes of Health
- National Institute of Neurological Disorders and Stroke (R01NS046424, K02NS053425, F30NS062489, NS46424, NS61144, NS62489, NS 41255, R21NS041255, NS53425, R21NS061144)
- Eunice Kennedy Shriver National Institute of Child Health and Human Development (R01HD057076, HD57076)
- Topics
- Life Sciences › Neuroscience › Cognitive Neuroscience › Neural and Behavioral Psychology Studies
- Life Sciences › Neuroscience › Cognitive Neuroscience › Functional Brain Connectivity Studies
- Life Sciences › Neuroscience › Cognitive Neuroscience › Visual perception and processing mechanisms
- Keywords
- anterior insula, task-level control, focal attention, resting-state functional connectivity, functional heterogeneity, cognitive control, attentional capture
- MeSH terms
- Attention, Brain Mapping, Cerebral Cortex, Cognition, Magnetic Resonance Imaging, Nerve Net, Neural Pathways, Executive Function
About these checks
Registry, retraction, Cites and statistics results are computed, not judged, with one exception: a printed reference that no index lists is read once by a model before it counts as a citation error. Claims are extracted by a model and kept only when their quote appears verbatim in the text; each cited source is then checked, with a model’s help, for whether it says what the claim relies on. Those verdicts can be wrong — read the claim’s quote and the cited source before relying on one.
Statistics and arithmetic are recomputed, not judged.
Confidence bands are shown only for fields calibrated on our annotated test set. None is calibrated yet, so no band is shown.
What counts as a claim ›How we measure confidence ›How we check this ›
Are you an author, or do you see a problem with this page? Request a review
