

The DOI matches its Crossref record; 35 of the 35 references it cites were found in a registry or an index; 1 of the 29 sources its claims cite were checked for support.
A global view of the OCA2-HERC2 region and pigmentation
Open accessAbstract
Mutations in the gene OCA2 are responsible for oculocutaneous albinism type 2, but polymorphisms in and around OCA2 have also been associated with normal pigment variation. In Europeans, three haplotypes in the region have been shown to be associated with eye pigmentation and a missense SNP (rs1800407) has been associated with green/hazel eyes (Branicki et al. in Ann Hum Genet 73:160-170, 2009). In addition, a missense mutation (rs1800414) is a candidate for light skin pigmentation in East Asia (Yuasa et al. in Biochem Genet 45:535-542, 2007; Anno et al. in Int J Biol Sci 4, 2008). We have genotyped 3,432 individuals from 72 populations for 21 SNPs in the OCA2-HERC2 region including those previously associated with eye or skin pigmentation. We report that the blue-eye associated alleles at all three haplotypes were found at high frequencies in Europe; however, one is restricted to Europe and surrounding regions, while the other two are found at moderate to high frequencies throughout the world. We also observed that the derived allele of rs1800414 is essentially limited to East Asia where it is found at high frequencies. Long-range haplotype tests provide evidence of selection for the blue-eye allele at the three haplotyped systems but not for the green/hazel eye SNP allele. We also saw evidence of selection at the derived allele of rs1800414 in East Asia. Our data suggest that the haplotype restricted to Europe is the strongest marker for blue eyes globally and add further inferential evidence that the derived allele of rs1800414 is an East Asian skin pigmentation allele.
Overview
AI snapshot
Written from the paper’s full text.
TL;DR
Genotyping 21 SNPs across the OCA2-HERC2 region in global populations shows that blue-eye-associated haplotypes differ sharply in geographic range, with the BEH2 TG allele essentially restricted to Europe and carrying the strongest selection signal. The derived rs1800414 C allele is essentially limited to East Asia and shows evidence of selection, supporting it as an East Asian skin-pigmentation allele.
Key findings
- The blue-eye-associated alleles at BEH1 (ACA), BEH2 (TG), and BEH3 (CA) all reach highest frequencies in Northwestern Europe, but BEH2 TG is essentially observed only in Europe; BEH1 ACA and BEH3 CA are found globally, with frequencies <20% in most of Central and East Asia but 40% and higher in the Americas.
- The derived rs1800407 allele is rare and mostly restricted to Europe (0–11%), Southwest Asia (0–9.4%), and Central Asia (0–9.3%); no evidence of selection was seen at rs1800407.
- The derived rs1800414 C allele is found almost exclusively in East and Southeast Asia at frequencies from 0 to 76%, higher in eastern East Asia (62–76.1%) than Southeast Asia (0–54.3%) or Western China (15.5–37.5%); outside this region it appears at low frequencies in Adygei, Chuvash, and Hungarians (>1–3.6%), Yakut (8.8%), and Micronesians (4.2%).
- Long-range haplotype tests show the strongest selection signal at BEH2 TG in Europe and Southwest Asia; BEH1 and BEH3 signals are weak and within the false-positive grouping, while rs1800414 C shows strong selection evidence in East Asia, confirmed by nHS in Western China and Southeast Asia.
Methods
- The abstract reports 3,432 individuals from 72 populations; the methods and Table 1 describe 73 populations and 3,931 total samples including HGDP data. The study typed 21 SNPs spanning 398,549 bp in OCA2-HERC2, including nine previously pigmentation-associated SNPs.
- SNPs were typed with Applied Biosystems TaqMan assays; haplotypes were estimated with fastPHASE, frequency maps with Surfer, and LD with HAPLOT.
- Selection was tested using relative extended haplotype homozygosity (REHH) and normalized haplosimilarity (nHS), with 1,000 neutral simulations under a constant population size model and a bottleneck-plus-exponential-expansion model.
Limitations
- The paper has no explicit limitations section. Evident from the text: this study reports genotype and allele-frequency data but does not directly measure pigmentation phenotypes, so pigmentation associations are inferred from prior studies.
- Some population samples are very small (e.g., Lisongo N=8, Samoans N=8, Malaysians N=11, Orcadians N=16, Kuwaiti N=16), and some HGDP samples were combined, which may make allele-frequency estimates for rare variants unstable.
- The paper states that several questions remain, including whether BEH2 SNPs are causal or only in strong LD with the causative allele, whether BEH2 lies in an OCA2 promoter region, and whether blue eyes are under sexual selection or linked to another selected phenotype such as light skin pigmentation.
Model-written summary. Check it against the paper before relying on it.
Integrity signals
Registry
Cites
Statistics
Figures
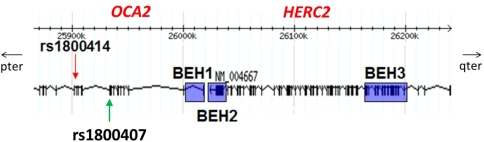
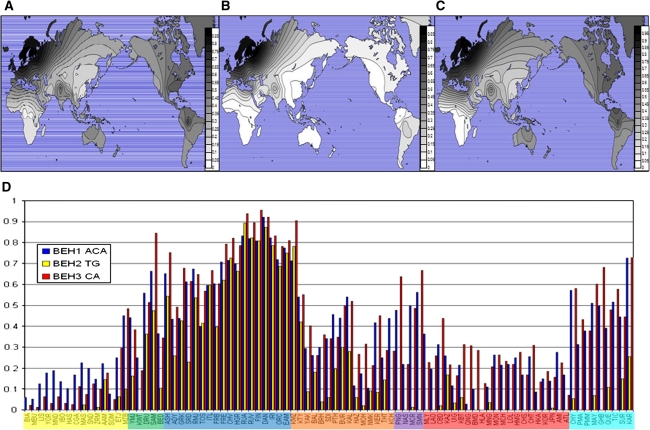
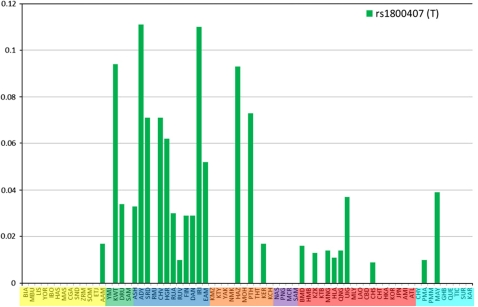
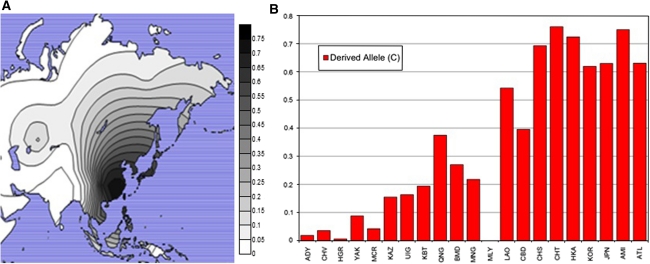
Verification
Claims the paper makes
60 Own result · 16 Not checked yet · 12 Own interpretation · 6 No basis given · 1 Supported · 1 Own method
A result the paper reports from its own data — it cites no other source for it, so there is none to check. The quote shows it is in the paper.
In the paper
“the TG allele at BEH2 is essentially observed only in Europe”
§ A global view of the OCA2-HERC2 region and pigmentation > Results > Geographic distributions of haplotypes
plain- Asserted: passes — The authors put it forward as true.
- Checkable: passes — It can be checked against evidence.
- Load-bearing: unclear — It is unclear whether the paper’s conclusions depend on it.
- Based: passes — The paper gives a reason why it holds.
A result the paper reports from its own data — it cites no other source for it, so there is none to check. The quote shows it is in the paper.
In the paper
“The T allele of rs1800407, when seen, is commonly paired with the blue-eye associated TG allele at BEH2 only in Northern and Eastern Europeans.”
§ A global view of the OCA2-HERC2 region and pigmentation > Results > Geographic distribution of the derived allele of rs1800407
plaincorrelational- Asserted: passes — The authors put it forward as true.
- Checkable: passes — It can be checked against evidence.
- Load-bearing: passes — The paper’s conclusions depend on it.
- Based: passes — The paper gives a reason why it holds.
A result the paper reports from its own data — it cites no other source for it, so there is none to check. The quote shows it is in the paper.
In the paper
“Long-range haplotype tests provide evidence of selection for the blue-eye allele at the three haplotyped systems but not for the green/hazel eye SNP allele.”
§ A global view of the OCA2-HERC2 region and pigmentation > Abstract
plaindirectn = 3,432- Asserted: passes — The authors put it forward as true.
- Checkable: passes — It can be checked against evidence.
- Load-bearing: passes — The paper’s conclusions depend on it.
- Based: passes — The paper gives a reason why it holds.
- The authors state this as an assumption: A variant under selection will rise to high frequency quickly before recombination has time to break down the extended haplotype on which the variant initially arose.
- The authors state this as an assumption: A neutral variant will take longer to reach a high frequency, allowing the extended haplotype time to be degraded by recombination.
A result the paper reports from its own data — it cites no other source for it, so there is none to check. The quote shows it is in the paper.
In the paper
“In our data, with the exception of a low frequency haplotype in Africa, rs916977 and rs1667394 are in nearly complete LD.”
§ A global view of the OCA2-HERC2 region and pigmentation > Results > Blue-eye associated haplotypes
plaincorrelational- Asserted: passes — The authors put it forward as true.
- Checkable: passes — It can be checked against evidence.
- Load-bearing: passes — The paper’s conclusions depend on it.
- Based: passes — The paper gives a reason why it holds.
A result the paper reports from its own data — it cites no other source for it, so there is none to check. The quote shows it is in the paper.
In the paper
“We report that the blue-eye associated alleles at all three haplotypes were found at high frequencies in Europe”
§ A global view of the OCA2-HERC2 region and pigmentation > Abstract
plaincorrelationaln = 3,432- Asserted: passes — The authors put it forward as true.
- Checkable: passes — It can be checked against evidence.
- Load-bearing: passes — The paper’s conclusions depend on it.
- Based: passes — The paper gives a reason why it holds.
A result the paper reports from its own data — it cites no other source for it, so there is none to check. The quote shows it is in the paper.
In the paper
“Elsewhere the T allele is more likely to be found paired with the CA allele.”
§ A global view of the OCA2-HERC2 region and pigmentation > Results > Geographic distribution of the derived allele of rs1800407
hedgedcorrelational- Asserted: passes — The authors put it forward as true.
- Checkable: passes — It can be checked against evidence.
- Load-bearing: unclear — It is unclear whether the paper’s conclusions depend on it.
- Based: passes — The paper gives a reason why it holds.
A result the paper reports from its own data — it cites no other source for it, so there is none to check. The quote shows it is in the paper.
In the paper
“The alleles associated with blue eyes at all three BEH blue-eye associated haplotypes have their highest frequencies in Northwestern Europe”
§ A global view of the OCA2-HERC2 region and pigmentation > Results > Geographic distributions of haplotypes
plaincorrelational- Asserted: passes — The authors put it forward as true.
- Checkable: passes — It can be checked against evidence.
- Load-bearing: unclear — It is unclear whether the paper’s conclusions depend on it.
- Based: passes — The paper gives a reason why it holds.
A result the paper reports from its own data — it cites no other source for it, so there is none to check. The quote shows it is in the paper.
In the paper
“We also observed that the derived allele of rs1800414 is essentially limited to East Asia where it is found at high frequencies.”
§ A global view of the OCA2-HERC2 region and pigmentation > Abstract
plainn = 3,432- Asserted: passes — The authors put it forward as true.
- Checkable: passes — It can be checked against evidence.
- Load-bearing: passes — The paper’s conclusions depend on it.
- Based: passes — The paper gives a reason why it holds.
A result the paper reports from its own data — it cites no other source for it, so there is none to check. The quote shows it is in the paper.
In the paper
“We also saw evidence of selection at the derived allele of rs1800414 in East Asia.”
§ A global view of the OCA2-HERC2 region and pigmentation > Abstract
plaindirectn = 3,432- Asserted: passes — The authors put it forward as true.
- Checkable: passes — It can be checked against evidence.
- Load-bearing: passes — The paper’s conclusions depend on it.
- Based: passes — The paper gives a reason why it holds.
- The authors state this as an assumption: A variant under selection will rise to high frequency quickly before recombination has time to break down the extended haplotype on which the variant initially arose.
- The authors state this as an assumption: A neutral variant will take longer to reach a high frequency, allowing the extended haplotype time to be degraded by recombination.
The paper states this without a source or data behind it here, so there is nothing to check it against. The quote shows it is in the paper.
In the paper
“Since rs1129038 is in nearly complete LD with rs12913832 in all populations, we defined these two SNPs as a haplotype system referred to as BEH2, blue-eye associated haplotype #2.”
§ A global view of the OCA2-HERC2 region and pigmentation > Results > Blue-eye associated haplotypes
plaincorrelational- Asserted: passes — The authors put it forward as true.
- Checkable: passes — It can be checked against evidence.
- Load-bearing: passes — The paper’s conclusions depend on it.
- Based: passes — The paper gives a reason why it holds.
A result the paper reports from its own data — it cites no other source for it, so there is none to check. The quote shows it is in the paper.
In the paper
“while the other two are found at moderate to high frequencies throughout the world”
§ A global view of the OCA2-HERC2 region and pigmentation > Abstract
plainn = 3,432- Asserted: passes — The authors put it forward as true.
- Checkable: passes — It can be checked against evidence.
- Load-bearing: passes — The paper’s conclusions depend on it.
- Based: passes — The paper gives a reason why it holds.
A result the paper reports from its own data — it cites no other source for it, so there is none to check. The quote shows it is in the paper.
In the paper
“Outside of East and Southeast Asia, the C allele is only found in low frequencies in the Adygei, Chuvash, and Hungarians in Europe (>1–3.6%), the Yakut in Siberia (8.8%), and the Micronesians in the Pacific Islands (4.2%).”
§ A global view of the OCA2-HERC2 region and pigmentation > Results > Geographic distribution of the derived allele of rs1800414
plain- Asserted: passes — The authors put it forward as true.
- Checkable: passes — It can be checked against evidence.
- Load-bearing: passes — The paper’s conclusions depend on it.
- Based: passes — The paper gives a reason why it holds.
A result the paper reports from its own data — it cites no other source for it, so there is none to check. The quote shows it is in the paper.
In the paper
“The T allele with the ACA blue-eye associated allele is the second most common combination.”
§ A global view of the OCA2-HERC2 region and pigmentation > Results > Geographic distribution of the derived allele of rs1800407
plaincorrelational- Asserted: passes — The authors put it forward as true.
- Checkable: passes — It can be checked against evidence.
- Load-bearing: unclear — It is unclear whether the paper’s conclusions depend on it.
- Based: passes — The paper gives a reason why it holds.
A result the paper reports from its own data — it cites no other source for it, so there is none to check. The quote shows it is in the paper.
In the paper
“The first observation is that the blue-eye associated alleles of the three BEHs are much more common than the derived allele of rs1800407.”
§ A global view of the OCA2-HERC2 region and pigmentation > Results > Geographic distribution of the derived allele of rs1800407
plain- Asserted: passes — The authors put it forward as true.
- Checkable: passes — It can be checked against evidence.
- Load-bearing: passes — The paper’s conclusions depend on it.
- Based: passes — The paper gives a reason why it holds.
A result the paper reports from its own data — it cites no other source for it, so there is none to check. The quote shows it is in the paper.
In the paper
“The derived allele is mostly restricted to Europe (0–11%), Southwest Asia (0–9.4%), and Central Asia (0–9.3%).”
§ A global view of the OCA2-HERC2 region and pigmentation > Results > Geographic distribution of the derived allele of rs1800407
plain- Asserted: passes — The authors put it forward as true.
- Checkable: passes — It can be checked against evidence.
- Load-bearing: unclear — It is unclear whether the paper’s conclusions depend on it.
- Based: passes — The paper gives a reason why it holds.
A result the paper reports from its own data — it cites no other source for it, so there is none to check. The quote shows it is in the paper.
In the paper
“At BEH1, the T allele of rs1800407 most commonly occurs with the AAA allele and not the ACA allele that has been associated with blue eyes.”
§ A global view of the OCA2-HERC2 region and pigmentation > Results > Geographic distribution of the derived allele of rs1800407
plaincorrelational- Asserted: passes — The authors put it forward as true.
- Checkable: passes — It can be checked against evidence.
- Load-bearing: passes — The paper’s conclusions depend on it.
- Based: passes — The paper gives a reason why it holds.
A result the paper reports from its own data — it cites no other source for it, so there is none to check. The quote shows it is in the paper.
In the paper
“The derived allele of rs1800407 is relatively rare compared to the blue-eye associated alleles of the three BEHs.”
§ A global view of the OCA2-HERC2 region and pigmentation > Results > Geographic distribution of the derived allele of rs1800407
plain- Asserted: passes — The authors put it forward as true.
- Checkable: passes — It can be checked against evidence.
- Load-bearing: unclear — It is unclear whether the paper’s conclusions depend on it.
- Based: passes — The paper gives a reason why it holds.
A result the paper reports from its own data — it cites no other source for it, so there is none to check. The quote shows it is in the paper.
In the paper
“Long-range haplotype tests provide evidence of selection for the blue-eye allele at the three haplotyped systems but not for the green/hazel eye SNP allele.”
§ A global view of the OCA2-HERC2 region and pigmentation > Abstract
plain- Asserted: passes — The authors put it forward as true.
- Checkable: passes — It can be checked against evidence.
- Load-bearing: passes — The paper’s conclusions depend on it.
- Based: passes — The paper gives a reason why it holds.
- The authors state this as an assumption: A variant under selection will rise to high frequency quickly before recombination has time to break down the extended haplotype on which the variant initially arose.
- The authors state this as an assumption: A neutral variant will take longer to reach a high frequency, allowing the extended haplotype time to be degraded by recombination.
A result the paper reports from its own data — it cites no other source for it, so there is none to check. The quote shows it is in the paper.
In the paper
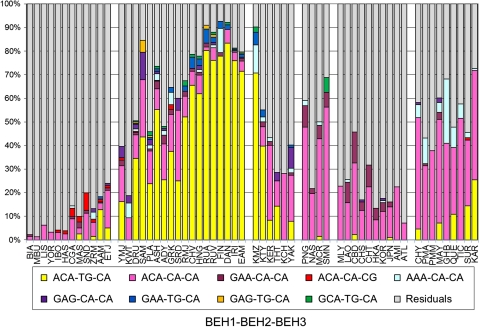
“and almost always occurs on chromosomes with the ACA allele of BEH1”
§ A global view of the OCA2-HERC2 region and pigmentation > Results > Haplotypes and LD
plaincorrelational- Asserted: passes — The authors put it forward as true.
- Checkable: passes — It can be checked against evidence.
- Load-bearing: unclear — It is unclear whether the paper’s conclusions depend on it.
- Based: passes — The paper gives a reason why it holds.
A result the paper reports from its own data — it cites no other source for it, so there is none to check. The quote shows it is in the paper.
In the paper
“in our small sample the derived allele is absent”
§ A global view of the OCA2-HERC2 region and pigmentation > Discussion > Global distribution of the light skin allele
plain- Asserted: passes — The authors put it forward as true.
- Checkable: passes — It can be checked against evidence.
- Load-bearing: unclear — It is unclear whether the paper’s conclusions depend on it.
- Based: passes — The paper gives a reason why it holds.
A result the paper reports from its own data — it cites no other source for it, so there is none to check. The quote shows it is in the paper.
In the paper
“In the Americas, there are three regions, one near rs1800414, one at BEH1, and one at BEH3”
§ A global view of the OCA2-HERC2 region and pigmentation > Results > Haplotypes and LD
plain- Asserted: passes — The authors put it forward as true.
- Checkable: passes — It can be checked against evidence.
- Load-bearing: unclear — It is unclear whether the paper’s conclusions depend on it.
- Based: passes — The paper gives a reason why it holds.
A result the paper reports from its own data — it cites no other source for it, so there is none to check. The quote shows it is in the paper.
In the paper
“In East Asia, we show that the C allele of the missense SNP rs1800414 is also under selection”
§ A global view of the OCA2-HERC2 region and pigmentation > Discussion > Selection in the OCA2-HERC2 region
boosteddirect- Asserted: passes — The authors put it forward as true.
- Checkable: passes — It can be checked against evidence.
- Load-bearing: passes — The paper’s conclusions depend on it.
- Based: passes — The paper gives a reason why it holds.
The paper states this without a source or data behind it here, so there is nothing to check it against. The quote shows it is in the paper.
In the paper
“however, the frequencies of the TG allele of BEH2 and its homozygotes are lower than those of the ACA allele of BEH1 and the CA allele of BEH3.”
§ A global view of the OCA2-HERC2 region and pigmentation > Discussion > Distribution of blue-eye associated alleles
plain- Asserted: passes — The authors put it forward as true.
- Checkable: passes — It can be checked against evidence.
- Load-bearing: unclear — It is unclear whether the paper’s conclusions depend on it.
- Based: passes — The paper gives a reason why it holds.
A result the paper reports from its own data — it cites no other source for it, so there is none to check. The quote shows it is in the paper.
In the paper
“Within East Asia there is a general cline in the frequency of the C allele with the lowest frequencies in Western China, midrange frequencies in Southeast Asia, and high frequencies in Eastern East Asia.”
§ A global view of the OCA2-HERC2 region and pigmentation > Discussion > Global distribution of the light skin allele
plaincorrelational- Asserted: passes — The authors put it forward as true.
- Checkable: passes — It can be checked against evidence.
- Load-bearing: unclear — It is unclear whether the paper’s conclusions depend on it.
- Based: passes — The paper gives a reason why it holds.
A result the paper reports from its own data — it cites no other source for it, so there is none to check. The quote shows it is in the paper.
In the paper
“Again, we see strong evidence of selection at the two BEH2 SNPs in Southern Europe and Southwest Asia using the nHS test”
§ A global view of the OCA2-HERC2 region and pigmentation > Results > Selection
boosteddirect- Asserted: passes — The authors put it forward as true.
- Checkable: passes — It can be checked against evidence.
- Load-bearing: passes — The paper’s conclusions depend on it.
- Based: passes — The paper gives a reason why it holds.
A result the paper reports from its own data — it cites no other source for it, so there is none to check. The quote shows it is in the paper.
In the paper
“Whenever one of the blue-eye associated alleles does occur on a chromosome by itself, it is most likely to be the CA allele of BEH3.”
§ A global view of the OCA2-HERC2 region and pigmentation > Results > Haplotypes and LD
hedgedcorrelational- Asserted: passes — The authors put it forward as true.
- Checkable: passes — It can be checked against evidence.
- Load-bearing: unclear — It is unclear whether the paper’s conclusions depend on it.
- Based: passes — The paper gives a reason why it holds.
A result the paper reports from its own data — it cites no other source for it, so there is none to check. The quote shows it is in the paper.
In the paper
“We showed that the strongest signal of selection in Europe and Southwest Asia is at the TG allele of BEH2”
§ A global view of the OCA2-HERC2 region and pigmentation > Discussion > Selection in the OCA2-HERC2 region
boostedcorrelational- Asserted: passes — The authors put it forward as true.
- Checkable: passes — It can be checked against evidence.
- Load-bearing: passes — The paper’s conclusions depend on it.
- Based: passes — The paper gives a reason why it holds.
A result the paper reports from its own data — it cites no other source for it, so there is none to check. The quote shows it is in the paper.
In the paper
“We have shown that the C allele of the missense SNP rs1800414 is found almost exclusively in East Asia”
§ A global view of the OCA2-HERC2 region and pigmentation > Discussion > Global distribution of the light skin allele
boostedcorrelational- Asserted: passes — The authors put it forward as true.
- Checkable: passes — It can be checked against evidence.
- Load-bearing: passes — The paper’s conclusions depend on it.
- Based: passes — The paper gives a reason why it holds.
A result the paper reports from its own data — it cites no other source for it, so there is none to check. The quote shows it is in the paper.
In the paper
“This also holds true for homozygotes of the blue-eye associated alleles of these haplotypes”
§ A global view of the OCA2-HERC2 region and pigmentation > Discussion > Distribution of blue-eye associated alleles
plain- Asserted: passes — The authors put it forward as true.
- Checkable: passes — It can be checked against evidence.
- Load-bearing: unclear — It is unclear whether the paper’s conclusions depend on it.
- Based: passes — The paper gives a reason why it holds.
A result the paper reports from its own data — it cites no other source for it, so there is none to check. The quote shows it is in the paper.
In the paper
“We saw no evidence for selection at any of the pigmentation regions in Africa or the Americas”
§ A global view of the OCA2-HERC2 region and pigmentation > Results > Selection
plain- Asserted: passes — The authors put it forward as true.
- Checkable: passes — It can be checked against evidence.
- Load-bearing: passes — The paper’s conclusions depend on it.
- Based: passes — The paper gives a reason why it holds.
A result the paper reports from its own data — it cites no other source for it, so there is none to check. The quote shows it is in the paper.
In the paper
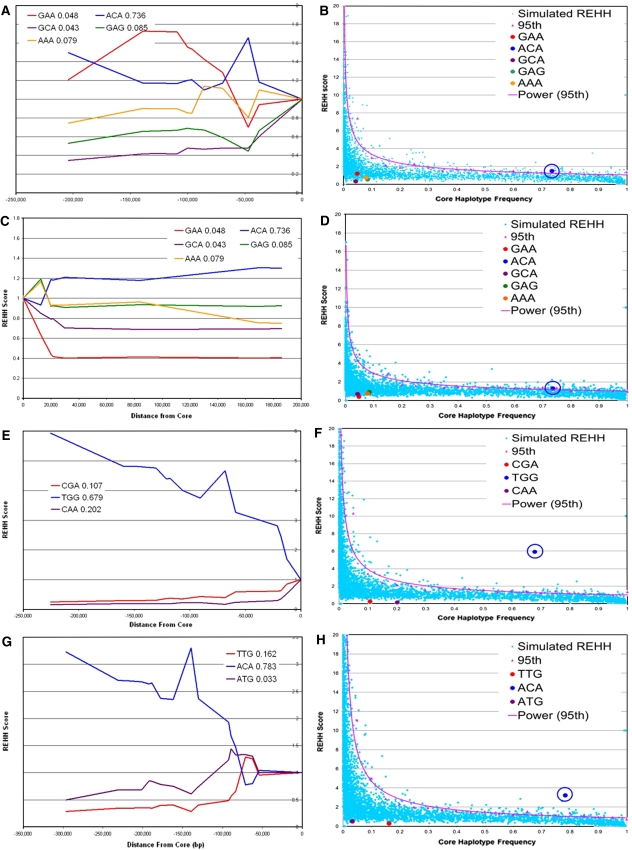
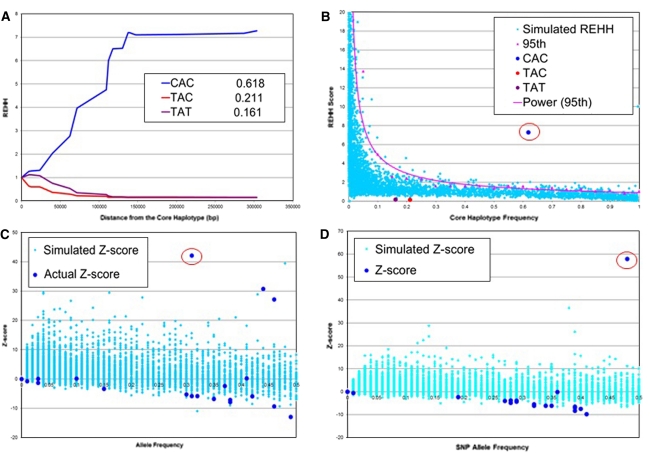
“In the European sample using the constant population size simulation model, we see the strongest signal for selection at the TG allele of BEH2”
§ A global view of the OCA2-HERC2 region and pigmentation > Results > Selection
plaincorrelational- Asserted: passes — The authors put it forward as true.
- Checkable: passes — It can be checked against evidence.
- Load-bearing: passes — The paper’s conclusions depend on it.
- Based: passes — The paper gives a reason why it holds.
None of the sources cited for this claim have been checked yet.
In the paper
“We have shown that the TG allele of BEH2 has a much more restricted global distribution compared to the ACA allele of BEH1 and the CA allele of BEH3, the other two haplotypes published as associated with blue eyes”
§ A global view of the OCA2-HERC2 region and pigmentation > Conclusions
What the sources say
boostedcorrelational- Asserted: passes — The authors put it forward as true.
- Checkable: passes — It can be checked against evidence.
- Load-bearing: passes — The paper’s conclusions depend on it.
- Based: passes — The paper gives a reason why it holds.
A result the paper reports from its own data — it cites no other source for it, so there is none to check. The quote shows it is in the paper.
In the paper
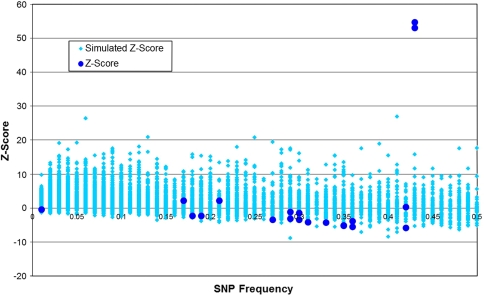
“We see there is strong evidence of selection for the C allele of rs1800414 in all three population groups”
§ A global view of the OCA2-HERC2 region and pigmentation > Results > Selection
boosteddirect- Asserted: passes — The authors put it forward as true.
- Checkable: passes — It can be checked against evidence.
- Load-bearing: passes — The paper’s conclusions depend on it.
- Based: passes — The paper gives a reason why it holds.
A result the paper reports from its own data — it cites no other source for it, so there is none to check. The quote shows it is in the paper.
In the paper
“In East Asia we see strong evidence for selection at the C allele of rs1800414 using the REHH test in both the constant population size model (Fig. 10a, b) and the bottleneck with an expansion model”
§ A global view of the OCA2-HERC2 region and pigmentation > Results > Selection
boosteddirect- Asserted: passes — The authors put it forward as true.
- Checkable: passes — It can be checked against evidence.
- Load-bearing: passes — The paper’s conclusions depend on it.
- Based: passes — The paper gives a reason why it holds.
A result the paper reports from its own data — it cites no other source for it, so there is none to check. The quote shows it is in the paper.
In the paper
“The ACA allele of BEH1 and the CA allele of BEH3 also usually occur on the same chromosomes”
§ A global view of the OCA2-HERC2 region and pigmentation > Results > Haplotypes and LD
plaincorrelational- Asserted: passes — The authors put it forward as true.
- Checkable: passes — It can be checked against evidence.
- Load-bearing: unclear — It is unclear whether the paper’s conclusions depend on it.
- Based: passes — The paper gives a reason why it holds.
A result the paper reports from its own data — it cites no other source for it, so there is none to check. The quote shows it is in the paper.
In the paper
“No evidence of selection was seen at rs1800407”
§ A global view of the OCA2-HERC2 region and pigmentation > Results > Selection
plain- Asserted: passes — The authors put it forward as true.
- Checkable: passes — It can be checked against evidence.
- Load-bearing: unclear — It is unclear whether the paper’s conclusions depend on it.
- Based: passes — The paper gives a reason why it holds.
A result the paper reports from its own data — it cites no other source for it, so there is none to check. The quote shows it is in the paper.
In the paper
“however, outside of Northwestern and Eastern Europe they do not always occur on chromosomes with the TG allele of BEH2.”
§ A global view of the OCA2-HERC2 region and pigmentation > Results > Haplotypes and LD
plaincorrelational- Asserted: passes — The authors put it forward as true.
- Checkable: passes — It can be checked against evidence.
- Load-bearing: passes — The paper’s conclusions depend on it.
- Based: passes — The paper gives a reason why it holds.
A result the paper reports from its own data — it cites no other source for it, so there is none to check. The quote shows it is in the paper.
In the paper
“the TG allele BEH2 always occurs on chromosomes that have the CA allele of BEH3”
§ A global view of the OCA2-HERC2 region and pigmentation > Results > Haplotypes and LD
plaincorrelational- Asserted: passes — The authors put it forward as true.
- Checkable: passes — It can be checked against evidence.
- Load-bearing: unclear — It is unclear whether the paper’s conclusions depend on it.
- Based: passes — The paper gives a reason why it holds.
The paper states this without a source or data behind it here, so there is nothing to check it against. The quote shows it is in the paper.
In the paper
“We also show that the TG allele of BEH2 has a strong signal of selection.”
§ A global view of the OCA2-HERC2 region and pigmentation > Conclusions
boostedcorrelational- Asserted: passes — The authors put it forward as true.
- Checkable: passes — It can be checked against evidence.
- Load-bearing: passes — The paper’s conclusions depend on it.
- Based: passes — The paper gives a reason why it holds.
A result the paper reports from its own data — it cites no other source for it, so there is none to check. The quote shows it is in the paper.
In the paper
“The frequencies of the haplotypes associated with blue eyes of the three blue-eye associated haplotypes in the OCA2 and HERC2 genes are very similar in Northwestern and Eastern Europe where all three haplotypes have their highest frequencies”
§ A global view of the OCA2-HERC2 region and pigmentation > Discussion > Distribution of blue-eye associated alleles
plain- Asserted: passes — The authors put it forward as true.
- Checkable: passes — It can be checked against evidence.
- Load-bearing: unclear — It is unclear whether the paper’s conclusions depend on it.
- Based: passes — The paper gives a reason why it holds.
A result the paper reports from its own data — it cites no other source for it, so there is none to check. The quote shows it is in the paper.
In the paper
“Using the nHS test we see strong evidence of selection for the derived allele of rs1800414 in both the Western China and Southeast Asian groups”
§ A global view of the OCA2-HERC2 region and pigmentation > Results > Selection
boosteddirect- Asserted: passes — The authors put it forward as true.
- Checkable: passes — It can be checked against evidence.
- Load-bearing: passes — The paper’s conclusions depend on it.
- Based: passes — The paper gives a reason why it holds.
A conclusion the paper draws from its own results — it cites no other source for it, so there is none to check. The quote shows it is in the paper.
In the paper
“add further inferential evidence that the derived allele of rs1800414 is an East Asian skin pigmentation allele.”
§ A global view of the OCA2-HERC2 region and pigmentation > Abstract
hedgedcorrelational- Asserted: passes — The authors put it forward as true.
- Checkable: passes — It can be checked against evidence.
- Load-bearing: passes — The paper’s conclusions depend on it.
- Based: passes — The paper gives a reason why it holds.
In the paper
“The T allele of rs1800407 has also been associated with blue-eye penetrance (Sturm et al. 2008).”
§ A global view of the OCA2-HERC2 region and pigmentation > Results > Geographic distribution of the derived allele of rs1800407
What the sources say
- Not checked yetcites Sturm et al. 2008 source
plaincorrelational- Asserted: passes — The authors put it forward as true.
- Checkable: passes — It can be checked against evidence.
- Load-bearing: unclear — It is unclear whether the paper’s conclusions depend on it.
- Based: passes — The paper gives a reason why it holds.
None of the sources cited for this claim have been checked yet.
In the paper
“Several sites in and around OCA2 have been reported to be the functional variant or to be tightly linked to the functional variant leading to blue eyes. These sites include a three-SNP haplotype (rs4778138, rs4778241, rs7495174) and four individual SNPs, rs1129038, rs12913832, rs916977, and rs1667394 (Duffy et al. 2007; Sturm et al. 2008; Kayser et al. 2008; Sulem et al. 2007; Mengel-From et al. 2”
§ A global view of the OCA2-HERC2 region and pigmentation > Background
What the sources say
plaindirect- Asserted: passes — The authors put it forward as true.
- Checkable: passes — It can be checked against evidence.
- Load-bearing: unclear — It is unclear whether the paper’s conclusions depend on it.
- Based: passes — The paper gives a reason why it holds.
The paper states this without a source or data behind it here, so there is nothing to check it against. The quote shows it is in the paper.
In the paper
“In European populations, it is primarily associated with blue irises.”
§ A global view of the OCA2-HERC2 region and pigmentation > Background
plaincorrelational- Asserted: passes — The authors put it forward as true.
- Checkable: passes — It can be checked against evidence.
- Load-bearing: unclear — It is unclear whether the paper’s conclusions depend on it.
- Based: passes — The paper gives a reason why it holds.
In the paper
“This association may explain the increased blue-eye penetrance seen by Sturm et al. (2008) as a type of ascertainment effect.”
§ A global view of the OCA2-HERC2 region and pigmentation > Results > Geographic distribution of the derived allele of rs1800407
What the sources say
- Not checked yetcites Sturm et al. 2008 source
hedgedconditional- Asserted: passes — The authors put it forward as true.
- Checkable: passes — It can be checked against evidence.
- Load-bearing: unclear — It is unclear whether the paper’s conclusions depend on it.
- Based: passes — The paper gives a reason why it holds.
A conclusion the paper draws from its own results — it cites no other source for it, so there is none to check. The quote shows it is in the paper.
In the paper
“Our data suggest that the haplotype restricted to Europe is the strongest marker for blue eyes globally”
§ A global view of the OCA2-HERC2 region and pigmentation > Abstract
hedgedcorrelationaln = 3,432- Asserted: passes — The authors put it forward as true.
- Checkable: passes — It can be checked against evidence.
- Load-bearing: passes — The paper’s conclusions depend on it.
- Based: passes — The paper gives a reason why it holds.
A conclusion the paper draws from its own results — it cites no other source for it, so there is none to check. The quote shows it is in the paper.
In the paper
“Along with the distribution data, this strongly suggests that the TG allele of BEH2 is, contains, or is in strong LD with the blue eye causal mutation.”
§ A global view of the OCA2-HERC2 region and pigmentation > Discussion > Selection in the OCA2-HERC2 region
boostedcorrelational- Asserted: passes — The authors put it forward as true.
- Checkable: passes — It can be checked against evidence.
- Load-bearing: passes — The paper’s conclusions depend on it.
- Based: passes — The paper gives a reason why it holds.
A conclusion the paper draws from its own results — it cites no other source for it, so there is none to check. The quote shows it is in the paper.
In the paper
“and any signal seen at BEH1 and BEH3 is likely due to hitchhiking”
§ A global view of the OCA2-HERC2 region and pigmentation > Discussion > Selection in the OCA2-HERC2 region
hedgedconditional- Asserted: passes — The authors put it forward as true.
- Checkable: passes — It can be checked against evidence.
- Load-bearing: passes — The paper’s conclusions depend on it.
- Based: passes — The paper gives a reason why it holds.
A conclusion the paper draws from its own results — it cites no other source for it, so there is none to check. The quote shows it is in the paper.
In the paper
“Given the strong LD in Europe across all three haplotype systems, their association with the blue eye phenotype in Europe is understandable.”
§ A global view of the OCA2-HERC2 region and pigmentation > Discussion > Distribution of blue-eye associated alleles
plaincorrelational- Asserted: passes — The authors put it forward as true.
- Checkable: passes — It can be checked against evidence.
- Load-bearing: unclear — It is unclear whether the paper’s conclusions depend on it.
- Based: passes — The paper gives a reason why it holds.
None of the sources cited for this claim have been checked yet.
In the paper
“since this allele has been associated with lighter skin pigmentation in East Asians”
§ A global view of the OCA2-HERC2 region and pigmentation > Discussion > Selection in the OCA2-HERC2 region
What the sources say
plaincorrelational- Asserted: passes — The authors put it forward as true.
- Checkable: passes — It can be checked against evidence.
- Load-bearing: passes — The paper’s conclusions depend on it.
- Based: passes — The paper gives a reason why it holds.
A conclusion the paper draws from its own results — it cites no other source for it, so there is none to check. The quote shows it is in the paper.
In the paper
“However, these frequency data for other populations around the world and the essential restriction of blue eyes to Europe, shows that the BEH1 and BEH3 haplotype systems, and the composing SNPs are not universal markers of blue eyes.”
§ A global view of the OCA2-HERC2 region and pigmentation > Discussion > Distribution of blue-eye associated alleles
plain- Asserted: passes — The authors put it forward as true.
- Checkable: passes — It can be checked against evidence.
- Load-bearing: passes — The paper’s conclusions depend on it.
- Based: passes — The paper gives a reason why it holds.
- Rests on an assumption: Blue eyes are essentially restricted to Europe.
A conclusion the paper draws from its own results — it cites no other source for it, so there is none to check. The quote shows it is in the paper.
In the paper
“The TG allele at BEH2 is the best marker for blue eyes”
§ A global view of the OCA2-HERC2 region and pigmentation > Discussion > Distribution of blue-eye associated alleles
plaincorrelational- Asserted: passes — The authors put it forward as true.
- Checkable: passes — It can be checked against evidence.
- Load-bearing: passes — The paper’s conclusions depend on it.
- Based: passes — The paper gives a reason why it holds.
A conclusion the paper draws from its own results — it cites no other source for it, so there is none to check. The quote shows it is in the paper.
In the paper
“This result is likely due to the fact that the C allele of rs1800414 occurs on the same chromosome as these haplotypes in East Asia”
§ A global view of the OCA2-HERC2 region and pigmentation > Results > Selection
hedgedconditional- Asserted: passes — The authors put it forward as true.
- Checkable: passes — It can be checked against evidence.
- Load-bearing: passes — The paper’s conclusions depend on it.
- Based: passes — The paper gives a reason why it holds.
- Probably not a substantial claim. 11
- It may state two separate claims as one. 32
Every source the paper cites for this claim was checked and supports it.
In the paper
“Sturm et al. (2008) concluded that the derived allele of rs1800407 increased the penetrance of the blue eye phenotype associated with the derived allele of rs12913832.”
§ A global view of the OCA2-HERC2 region and pigmentation > Background
What the sources say
- Supportedcites Sturm et al. 2008 source
Table 4 (Sequence Alignment section; page unavailable) shows higher blue-eye penetrance with the R419Q Q allele on the rs12913832 C/C background: 0.83 for R/Q versus 0.71 for R/R. The Discussion also concludes that R419Q modifies penetrance at the rs12913832 locus. (LLM, conf=0.91)
plaindirect- Asserted: passes — The authors put it forward as true.
- Checkable: passes — It can be checked against evidence.
- Load-bearing: fails — The paper’s conclusions may not depend on it.
- Based: passes — The paper gives a reason why it holds.
Probably not a substantial claim. The paper’s conclusions may not depend on it.
- Supported
A result the paper reports from its own data — it cites no other source for it, so there is none to check. The quote shows it is in the paper.
In the paper
“the ACA allele of BEH1 and the CA allele at BEH3 are at their highest frequencies in Europe, particularly in Northern and Western Europe, and have much lower frequencies elsewhere.”
§ A global view of the OCA2-HERC2 region and pigmentation > Results > Geographic distributions of haplotypes
plaincorrelational- Asserted: passes — The authors put it forward as true.
- Checkable: passes — It can be checked against evidence.
- Load-bearing: passes — The paper’s conclusions depend on it.
- Based: passes — The paper gives a reason why it holds.
It may state two separate claims as one.
A result the paper reports from its own data — it cites no other source for it, so there is none to check. The quote shows it is in the paper.
In the paper
“In most of Central and East Asia, these alleles have frequencies of <20% but reach frequencies of 40% and higher in the Americas.”
§ A global view of the OCA2-HERC2 region and pigmentation > Results > Geographic distributions of haplotypes
plain- Asserted: passes — The authors put it forward as true.
- Checkable: passes — It can be checked against evidence.
- Load-bearing: unclear — It is unclear whether the paper’s conclusions depend on it.
- Based: passes — The paper gives a reason why it holds.
It may state two separate claims as one.
A result the paper reports from its own data — it cites no other source for it, so there is none to check. The quote shows it is in the paper.
In the paper
“Our data confirm that the putative light skin allele of rs1800414 (C) is found almost exclusively in East and Southeast Asia, at frequencies ranging from 0 to 76% (Fig. 4) at higher levels in eastern East Asia (62–76.1%) compared with Southeast Asia (0–54.3%) and Western China (15.5–37.5%).”
§ A global view of the OCA2-HERC2 region and pigmentation > Results > Geographic distribution of the derived allele of rs1800414
hedgedcorrelational- Asserted: passes — The authors put it forward as true.
- Checkable: passes — It can be checked against evidence.
- Load-bearing: passes — The paper’s conclusions depend on it.
- Based: passes — The paper gives a reason why it holds.
It may state two separate claims as one.
A result the paper reports from its own data — it cites no other source for it, so there is none to check. The quote shows it is in the paper.
In the paper
“Outside of this region, the derived allele is found in African Americans (1.7%), San Francisco Chinese (0.9%), the Arizona Pima (1.0%), and the Maya (3.9%).”
§ A global view of the OCA2-HERC2 region and pigmentation > Results > Geographic distribution of the derived allele of rs1800407
plain- Asserted: passes — The authors put it forward as true.
- Checkable: passes — It can be checked against evidence.
- Load-bearing: unclear — It is unclear whether the paper’s conclusions depend on it.
- Based: passes — The paper gives a reason why it holds.
It may state two separate claims as one.
A result the paper reports from its own data — it cites no other source for it, so there is none to check. The quote shows it is in the paper.
In the paper
“The blue-eye associated CA allele of BEH3 commonly pairs with the T allele only in Northwestern and Eastern Europe and the TG allele is its most common partner elsewhere.”
§ A global view of the OCA2-HERC2 region and pigmentation > Results > Geographic distribution of the derived allele of rs1800407
plaincorrelational- Asserted: passes — The authors put it forward as true.
- Checkable: passes — It can be checked against evidence.
- Load-bearing: unclear — It is unclear whether the paper’s conclusions depend on it.
- Based: passes — The paper gives a reason why it holds.
It may state two separate claims as one.
A result the paper reports from its own data — it cites no other source for it, so there is none to check. The quote shows it is in the paper.
In the paper
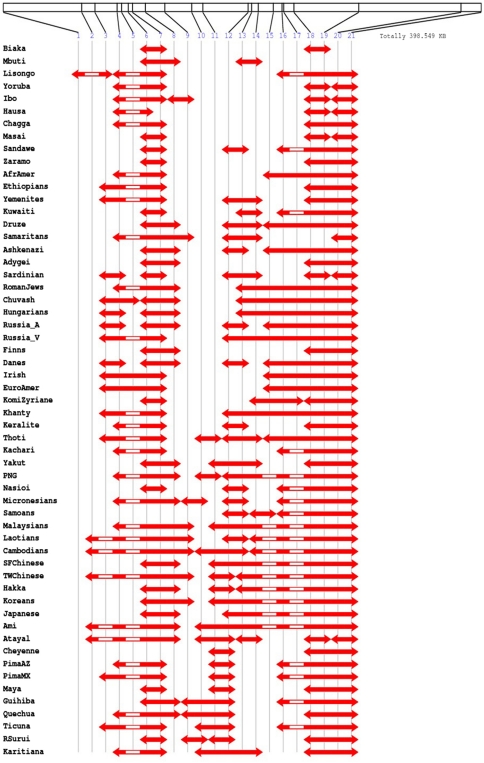
“In Africa, the first region encompasses SNP 4 (rs12914687) through SNP 7 (rs2015343) and the second region encompasses SNP 16 (rs7494942) through SNP 21 (rs1667394).”
§ A global view of the OCA2-HERC2 region and pigmentation > Results > Haplotypes and LD
plain- Asserted: passes — The authors put it forward as true.
- Checkable: passes — It can be checked against evidence.
- Load-bearing: unclear — It is unclear whether the paper’s conclusions depend on it.
- Based: passes — The paper gives a reason why it holds.
It may state two separate claims as one.
A result the paper reports from its own data — it cites no other source for it, so there is none to check. The quote shows it is in the paper.
In the paper
“In Southwest Asia and Europe, both high LD regions are larger and the first is composed of SNP 3 (rs11074314) through SNP 8 (rs4778136), and the second is composed of SNP 12 (rs4778138) through SNP 21 (rs1667394).”
§ A global view of the OCA2-HERC2 region and pigmentation > Results > Haplotypes and LD
plain- Asserted: passes — The authors put it forward as true.
- Checkable: passes — It can be checked against evidence.
- Load-bearing: unclear — It is unclear whether the paper’s conclusions depend on it.
- Based: passes — The paper gives a reason why it holds.
It may state two separate claims as one.
A result the paper reports from its own data — it cites no other source for it, so there is none to check. The quote shows it is in the paper.
In the paper
“On average, globally we see two regions of high LD, though the sizes of each of these regions vary by population group.”
§ A global view of the OCA2-HERC2 region and pigmentation > Results > Haplotypes and LD
plain- Asserted: passes — The authors put it forward as true.
- Checkable: passes — It can be checked against evidence.
- Load-bearing: unclear — It is unclear whether the paper’s conclusions depend on it.
- Based: passes — The paper gives a reason why it holds.
It may state two separate claims as one.
A result the paper reports from its own data — it cites no other source for it, so there is none to check. The quote shows it is in the paper.
In the paper
“The smallest regions are in Africa whereas the largest regions are in East Asia.”
§ A global view of the OCA2-HERC2 region and pigmentation > Results > Haplotypes and LD
plaincorrelational- Asserted: passes — The authors put it forward as true.
- Checkable: passes — It can be checked against evidence.
- Load-bearing: unclear — It is unclear whether the paper’s conclusions depend on it.
- Based: passes — The paper gives a reason why it holds.
It may state two separate claims as one.
A result the paper reports from its own data — it cites no other source for it, so there is none to check. The quote shows it is in the paper.
In the paper
“All three blue-eye associated alleles and homozygotes of these alleles are also present in Southern Europe and Southwest Asia at lower frequencies than those found in Northwestern and Eastern Europe”
§ A global view of the OCA2-HERC2 region and pigmentation > Discussion > Distribution of blue-eye associated alleles
plaincorrelational- Asserted: passes — The authors put it forward as true.
- Checkable: passes — It can be checked against evidence.
- Load-bearing: unclear — It is unclear whether the paper’s conclusions depend on it.
- Based: passes — The paper gives a reason why it holds.
It may state two separate claims as one.
A result the paper reports from its own data — it cites no other source for it, so there is none to check. The quote shows it is in the paper.
In the paper
“In Central Asia and the Pacific, the first region is the same as in Africa and the second region is the same as in Southwest Asia and Europe.”
§ A global view of the OCA2-HERC2 region and pigmentation > Results > Haplotypes and LD
plain- Asserted: passes — The authors put it forward as true.
- Checkable: passes — It can be checked against evidence.
- Load-bearing: unclear — It is unclear whether the paper’s conclusions depend on it.
- Based: passes — The paper gives a reason why it holds.
It may state two separate claims as one.
A result the paper reports from its own data — it cites no other source for it, so there is none to check. The quote shows it is in the paper.
In the paper
“In Eastern Europe, the evidence for selection is again the strongest at the TG allele BEH2; there is no evidence of selection to the centromeric side of BEH1, and weak evidence for selection at the CA allele of BEH3 and to the telomeric side of the ACA allele of BEH1.”
§ A global view of the OCA2-HERC2 region and pigmentation > Results > Selection
plain- Asserted: passes — The authors put it forward as true.
- Checkable: passes — It can be checked against evidence.
- Load-bearing: passes — The paper’s conclusions depend on it.
- Based: passes — The paper gives a reason why it holds.
It may state two separate claims as one.
A result the paper reports from its own data — it cites no other source for it, so there is none to check. The quote shows it is in the paper.
In the paper
“At the ACA allele of BEH1 and the CA allele of BEH3, the REHH scores are weakly significant and just over the 95th percentile; however, both regions are within the false positive grouping of the simulated data.”
§ A global view of the OCA2-HERC2 region and pigmentation > Results > Selection
plain- Asserted: passes — The authors put it forward as true.
- Checkable: passes — It can be checked against evidence.
- Load-bearing: unclear — It is unclear whether the paper’s conclusions depend on it.
- Based: passes — The paper gives a reason why it holds.
It may state two separate claims as one.
A result the paper reports from its own data — it cites no other source for it, so there is none to check. The quote shows it is in the paper.
In the paper
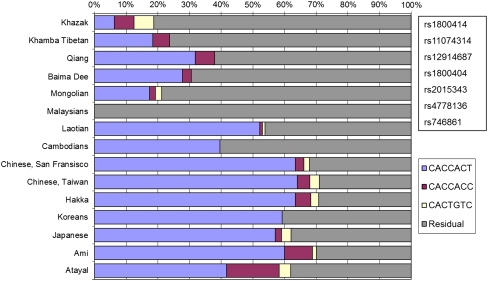
“Of the remaining two haplotypes containing the derived allele of rs1800414, one differs from the most common haplotype at the last site and the other differs at the final four sites.”
§ A global view of the OCA2-HERC2 region and pigmentation > Results > Haplotypes and LD
plain- Asserted: passes — The authors put it forward as true.
- Checkable: passes — It can be checked against evidence.
- Load-bearing: unclear — It is unclear whether the paper’s conclusions depend on it.
- Based: passes — The paper gives a reason why it holds.
It may state two separate claims as one.
A result the paper reports from its own data — it cites no other source for it, so there is none to check. The quote shows it is in the paper.
In the paper
“In Southern Europe, the TG allele at BEH2 has a strongly significant REHH score, at BEH3 the CA allele is weakly significant, and there is no evidence of selection at BEH1.”
§ A global view of the OCA2-HERC2 region and pigmentation > Results > Selection
boosted- Asserted: passes — The authors put it forward as true.
- Checkable: passes — It can be checked against evidence.
- Load-bearing: unclear — It is unclear whether the paper’s conclusions depend on it.
- Based: passes — The paper gives a reason why it holds.
It may state two separate claims as one.
A result the paper reports from its own data — it cites no other source for it, so there is none to check. The quote shows it is in the paper.
In the paper
“On average, there are two regions of high LD, one near the East Asian “light skin” SNP (rs1800414) and one in the BEH region.”
§ A global view of the OCA2-HERC2 region and pigmentation > Results > Haplotypes and LD
plain- Asserted: passes — The authors put it forward as true.
- Checkable: passes — It can be checked against evidence.
- Load-bearing: unclear — It is unclear whether the paper’s conclusions depend on it.
- Based: passes — The paper gives a reason why it holds.
It may state two separate claims as one.
A result the paper reports from its own data — it cites no other source for it, so there is none to check. The quote shows it is in the paper.
In the paper
“In Northwestern Europe, the TG allele of BEH2 once again has the strongest signal for selection, the centromeric side of the ACA allele of BEH1 and the CA allele of BEH3 are very weakly significant, and the telomeric side of BEH1 shows no significant evidence of selection.”
§ A global view of the OCA2-HERC2 region and pigmentation > Results > Selection
plain- Asserted: passes — The authors put it forward as true.
- Checkable: passes — It can be checked against evidence.
- Load-bearing: unclear — It is unclear whether the paper’s conclusions depend on it.
- Based: passes — The paper gives a reason why it holds.
It may state two separate claims as one.
The paper states this without a source or data behind it here, so there is nothing to check it against. The quote shows it is in the paper.
In the paper
“Outside of Europe, the blue-eye associated alleles of BEH1 and BEH2 are still common and homozygotes of these alleles are still seen but the blue-eye associated allele of BEH2 is much rarer and blue-eye associated homozygotes are virtually unseen.”
§ A global view of the OCA2-HERC2 region and pigmentation > Discussion > Distribution of blue-eye associated alleles
plain- Asserted: passes — The authors put it forward as true.
- Checkable: passes — It can be checked against evidence.
- Load-bearing: unclear — It is unclear whether the paper’s conclusions depend on it.
- Based: passes — The paper gives a reason why it holds.
It may state two separate claims as one.
The paper states this without a source or data behind it here, so there is nothing to check it against. The quote shows it is in the paper.
In the paper
“Interestingly, we also get significant REHH values at all three BEHs but the haplotypes that contain the ancestral alleles are the ones showing evidence of selection”
§ A global view of the OCA2-HERC2 region and pigmentation > Results > Selection
plaincorrelational- Asserted: passes — The authors put it forward as true.
- Checkable: passes — It can be checked against evidence.
- Load-bearing: unclear — It is unclear whether the paper’s conclusions depend on it.
- Based: passes — The paper gives a reason why it holds.
It may state two separate claims as one.
A result the paper reports from its own data — it cites no other source for it, so there is none to check. The quote shows it is in the paper.
In the paper
“In fact, though the bottleneck with expansion model had a different distribution of allele frequencies (more high frequency alleles and fewer midrange frequency alleles compared to the constant population size model) the 95th percentile line remained the same.”
§ A global view of the OCA2-HERC2 region and pigmentation > Results > Selection
plaincorrelational- Asserted: passes — The authors put it forward as true.
- Checkable: passes — It can be checked against evidence.
- Load-bearing: unclear — It is unclear whether the paper’s conclusions depend on it.
- Based: passes — The paper gives a reason why it holds.
It may state two separate claims as one.
A result the paper reports from its own data — it cites no other source for it, so there is none to check. The quote shows it is in the paper.
In the paper
“We actually see three regions of high LD in Native Americans, the first from SNP 3 (rs11074314) to SNP 8 (rs4778136), the second from SNP 9 (rs746861) to SNP 12 (rs4778138), and the third from SNP 18 (rs3935591) through SNP 21 (rs1667394).”
§ A global view of the OCA2-HERC2 region and pigmentation > Results > Haplotypes and LD
plain- Asserted: passes — The authors put it forward as true.
- Checkable: passes — It can be checked against evidence.
- Load-bearing: unclear — It is unclear whether the paper’s conclusions depend on it.
- Based: passes — The paper gives a reason why it holds.
It may state two separate claims as one.
A result the paper reports from its own data — it cites no other source for it, so there is none to check. The quote shows it is in the paper.
In the paper
“Here we see the derived allele of rs1800414 occurs on three haplotypes, though a vast majority occurs on a single haplotype (CACCACT).”
§ A global view of the OCA2-HERC2 region and pigmentation > Results > Haplotypes and LD
plaincorrelational- Asserted: passes — The authors put it forward as true.
- Checkable: passes — It can be checked against evidence.
- Load-bearing: unclear — It is unclear whether the paper’s conclusions depend on it.
- Based: passes — The paper gives a reason why it holds.
It may state two separate claims as one.
A result the paper reports from its own data — it cites no other source for it, so there is none to check. The quote shows it is in the paper.
In the paper
“In Europe, the second region covers all three BEHs, and in East Asia, the first region includes rs1800414.”
§ A global view of the OCA2-HERC2 region and pigmentation > Results > Haplotypes and LD
plain- Asserted: passes — The authors put it forward as true.
- Checkable: passes — It can be checked against evidence.
- Load-bearing: unclear — It is unclear whether the paper’s conclusions depend on it.
- Based: passes — The paper gives a reason why it holds.
It may state two separate claims as one.
A result the paper reports from its own data — it cites no other source for it, so there is none to check. The quote shows it is in the paper.
In the paper
“In Southwest Asia, there are significant REHH values at the TG allele of BEH2 and the CA allele BEH3. As in Europe, the BEH2 signal of selection is strong, whereas the BEH3 signal is barely significant”
§ A global view of the OCA2-HERC2 region and pigmentation > Results > Selection
plaincorrelational- Asserted: passes — The authors put it forward as true.
- Checkable: passes — It can be checked against evidence.
- Load-bearing: unclear — It is unclear whether the paper’s conclusions depend on it.
- Based: passes — The paper gives a reason why it holds.
It may state two separate claims as one.
A result the paper reports from its own data — it cites no other source for it, so there is none to check. The quote shows it is in the paper.
In the paper
“In East Asia, the first high LD region extends from SNP 2 (rs1800414) to SNP 9 (rs746861) and the second region extends from SNP 10 (rs7170869) to SNP 21 (rs1667394).”
§ A global view of the OCA2-HERC2 region and pigmentation > Results > Haplotypes and LD
plain- Asserted: passes — The authors put it forward as true.
- Checkable: passes — It can be checked against evidence.
- Load-bearing: unclear — It is unclear whether the paper’s conclusions depend on it.
- Based: passes — The paper gives a reason why it holds.
It may state two separate claims as one.
In the paper
“Duffy et al. (2007) previously identified a three-SNP haplotype system (rs4778138, rs4778241, and rs7495174) associated with blue eyes; for the purpose of this paper, we will refer to this system as BEH1, blue-eye associated haplotype #1.”
§ A global view of the OCA2-HERC2 region and pigmentation > Results > Blue-eye associated haplotypes
What the sources say
- Not checked yetcites Duffy et al. 2007 source
plaincorrelational- Asserted: passes — The authors put it forward as true.
- Checkable: passes — It can be checked against evidence.
- Load-bearing: passes — The paper’s conclusions depend on it.
- Based: passes — The paper gives a reason why it holds.
Probably not a substantial claim.
In the paper
“One of the HERC2 SNPs (rs1667394) has been associated with blond hair in Europeans (Sulem et al. 2007).”
§ A global view of the OCA2-HERC2 region and pigmentation > Background
What the sources say
- Not checked yetcites Sulem et al. 2007 source
plaincorrelational- Asserted: passes — The authors put it forward as true.
- Checkable: passes — It can be checked against evidence.
- Load-bearing: fails — The paper’s conclusions may not depend on it.
- Based: passes — The paper gives a reason why it holds.
Probably not a substantial claim. The paper’s conclusions may not depend on it.
None of the sources cited for this claim have been checked yet.
In the paper
“Two other SNPs, rs916977 and rs1667394, have previously been associated with blue eyes (Kayser et al. 2008; Sulem et al. 2007).”
§ A global view of the OCA2-HERC2 region and pigmentation > Results > Blue-eye associated haplotypes
What the sources say
plaincorrelational- Asserted: passes — The authors put it forward as true.
- Checkable: passes — It can be checked against evidence.
- Load-bearing: fails — The paper’s conclusions may not depend on it.
- Based: passes — The paper gives a reason why it holds.
Probably not a substantial claim. The paper’s conclusions may not depend on it.
In the paper
“Edwards et al. (2010) showed an association between the derived allele of rs1800414 (C, 615Arg) and lighter skin pigmentation in a sample of individuals of East Asian ancestry from Canada and confirmed their results using an independent sample of Han Chinese.”
§ A global view of the OCA2-HERC2 region and pigmentation > Background
What the sources say
- Not checked yetcites Edwards et al. 2010
plaincorrelational- Asserted: passes — The authors put it forward as true.
- Checkable: passes — It can be checked against evidence.
- Load-bearing: fails — The paper’s conclusions may not depend on it.
- Based: passes — The paper gives a reason why it holds.
Probably not a substantial claim. The paper’s conclusions may not depend on it. It may state two separate claims as one.
In the paper
“The derived allele of another SNP at OCA2, rs1800407, has been associated with green/hazel eyes in Europeans (Branicki et al. 2009).”
§ A global view of the OCA2-HERC2 region and pigmentation > Background
What the sources say
- Not checked yetcites Branicki et al. 2009 source
plaincorrelational- Asserted: passes — The authors put it forward as true.
- Checkable: passes — It can be checked against evidence.
- Load-bearing: fails — The paper’s conclusions may not depend on it.
- Based: passes — The paper gives a reason why it holds.
Probably not a substantial claim. The paper’s conclusions may not depend on it.
In the paper
“Sturm et al. (2008) reported that rs12913832 is associated with blue eyes.”
§ A global view of the OCA2-HERC2 region and pigmentation > Results > Blue-eye associated haplotypes
What the sources say
- Not checked yetcites Sturm et al. 2008 source
plaincorrelational- Asserted: passes — The authors put it forward as true.
- Checkable: passes — It can be checked against evidence.
- Load-bearing: passes — The paper’s conclusions depend on it.
- Based: passes — The paper gives a reason why it holds.
Probably not a substantial claim.
None of the sources cited for this claim have been checked yet.
In the paper
“In humans, it has been implicated in iris, skin, and hair pigmentation (Duffy et al. 2007; Sturm et al. 2008; Kayser et al. 2008; Sulem et al. 2007).”
§ A global view of the OCA2-HERC2 region and pigmentation > Background
What the sources say
plaincorrelational- Asserted: passes — The authors put it forward as true.
- Checkable: passes — It can be checked against evidence.
- Load-bearing: passes — The paper’s conclusions depend on it.
- Based: passes — The paper gives a reason why it holds.
Probably not a substantial claim.
None of the sources cited for this claim have been checked yet.
In the paper
“The derived allele at a missense SNP (rs1800414, His615Arg) in exon 19 of OCA2 has been reported to be specific to East Asia (Yuasa et al. 2007; Anno et al. 2008).”
§ A global view of the OCA2-HERC2 region and pigmentation > Background
What the sources say
- Not checked yetcites Yuasa et al. 2007 source
- Not checked yetcites Anno et al. 2008
plaincorrelational- Asserted: passes — The authors put it forward as true.
- Checkable: passes — It can be checked against evidence.
- Load-bearing: fails — The paper’s conclusions may not depend on it.
- Based: passes — The paper gives a reason why it holds.
Probably not a substantial claim. The paper’s conclusions may not depend on it.
A conclusion the paper draws from its own results — it cites no other source for it, so there is none to check. The quote shows it is in the paper.
In the paper
“This evidence suggests that BEH2 may contain the causal allele for blue eyes or at minimum is the best marker for the region in LD that does contain the causal allele.”
§ A global view of the OCA2-HERC2 region and pigmentation > Conclusions
hedgedconditional- Asserted: passes — The authors put it forward as true.
- Checkable: passes — It can be checked against evidence.
- Load-bearing: passes — The paper’s conclusions depend on it.
- Based: passes — The paper gives a reason why it holds.
It may state two separate claims as one.
A conclusion the paper draws from its own results — it cites no other source for it, so there is none to check. The quote shows it is in the paper.
In the paper
“Since there is no known biological advantage to having blue eyes, we think a likely answer is sexual selection that in Europe and Southwest Asia individuals with blue eyes are, or were, preferred as mates.”
§ A global view of the OCA2-HERC2 region and pigmentation > Discussion > Selection in the OCA2-HERC2 region
hedgedconditional- Asserted: passes — The authors put it forward as true.
- Checkable: passes — It can be checked against evidence.
- Load-bearing: fails — The paper’s conclusions may not depend on it.
- Based: passes — The paper gives a reason why it holds.
Probably not a substantial claim. The paper’s conclusions may not depend on it.
- Rests on an assumption: There is no known biological advantage to having blue eyes.
What the paper did — it cites no source for this, so there is none to check. The quote shows it is in the paper.
In the paper
“We confirmed these results using a bottleneck followed by an exponential expansion model and saw the same results”
§ A global view of the OCA2-HERC2 region and pigmentation > Results > Selection
plain- Asserted: passes — The authors put it forward as true.
- Checkable: passes — It can be checked against evidence.
- Load-bearing: unclear — It is unclear whether the paper’s conclusions depend on it.
- Based: passes — The paper gives a reason why it holds.
It may state two separate claims as one.
A conclusion the paper draws from its own results — it cites no other source for it, so there is none to check. The quote shows it is in the paper.
In the paper
“This research provides further evidence for lighter pigmentation evolving by means of selection at least partly independently in Europeans and East Asians but at some genes in common.”
§ A global view of the OCA2-HERC2 region and pigmentation > Conclusions
plaindirect- Asserted: passes — The authors put it forward as true.
- Checkable: passes — It can be checked against evidence.
- Load-bearing: passes — The paper’s conclusions depend on it.
- Based: passes — The paper gives a reason why it holds.
It may state two separate claims as one.
None of the sources cited for this claim have been checked yet.
In the paper
“and variants affecting skin pigmentation have previously been shown to be targets of selection”
§ A global view of the OCA2-HERC2 region and pigmentation > Discussion > Selection in the OCA2-HERC2 region
What the sources say
boosteddirect- Asserted: passes — The authors put it forward as true.
- Checkable: passes — It can be checked against evidence.
- Load-bearing: fails — The paper’s conclusions may not depend on it.
- Based: passes — The paper gives a reason why it holds.
Probably not a substantial claim. The paper’s conclusions may not depend on it.
In the paper
“Cook et al. (2009) showed melanocytes homozygous for the blue-eye associated allele of rs12913832 of BEH2 produced significantly less melanin than heterozygotes or those that were homozygous for the ancestral allele, but did not control for other SNPs in the region.”
§ A global view of the OCA2-HERC2 region and pigmentation > Conclusions
What the sources say
- Not checked yetcites Cook et al. (2009) source
plaindirect- Asserted: passes — The authors put it forward as true.
- Checkable: passes — It can be checked against evidence.
- Load-bearing: passes — The paper’s conclusions depend on it.
- Based: passes — The paper gives a reason why it holds.
It may state two separate claims as one.
In the paper
“A recent study by Liu et al. (2010) found that rs12913832 has the strongest effect when eye color is measured quantitatively and can explain most of the variance in eye color amongst Europeans.”
§ A global view of the OCA2-HERC2 region and pigmentation > Conclusions
What the sources say
- Not checked yetcites Liu et al. (2010) source
plaincorrelational- Asserted: passes — The authors put it forward as true.
- Checkable: passes — It can be checked against evidence.
- Load-bearing: passes — The paper’s conclusions depend on it.
- Based: passes — The paper gives a reason why it holds.
It may state two separate claims as one.
A conclusion the paper draws from its own results — it cites no other source for it, so there is none to check. The quote shows it is in the paper.
In the paper
“and may even contain the causal allele though the actual causative variant could be anywhere in the region of strong LD seen in European populations.”
§ A global view of the OCA2-HERC2 region and pigmentation > Discussion > Distribution of blue-eye associated alleles
hedgedconditional- Asserted: passes — The authors put it forward as true.
- Checkable: passes — It can be checked against evidence.
- Load-bearing: unclear — It is unclear whether the paper’s conclusions depend on it.
- Based: passes — The paper gives a reason why it holds.
It may state two separate claims as one.
The authors state this as an assumption.
A variant under selection will rise to high frequency quickly before recombination has time to break down the extended haplotype on which the variant initially arose.
“REHH and nHS are both based on the logical assumption that a variant under selection will rise to high frequency quickly before recombination has time to break down the extended haplotype on which the variant initially arose.”
The authors state this as an assumption.
A neutral variant will take longer to reach a high frequency, allowing the extended haplotype time to be degraded by recombination.
“In contrast, a neutral variant will take longer to reach a high frequency, allowing the extended haplotype time to be degraded by recombination.”
The paper relies on this without support.
Blue eyes are essentially restricted to Europe.
“the essential restriction of blue eyes to Europe”
The paper relies on this without support.
There is no known biological advantage to having blue eyes.
“Since there is no known biological advantage to having blue eyes”
Claims other papers make about this one
Each is checked against this paper’s own text: does it say what the citing paper says it does?
In the citing paper
“Finally, our population genetic analysis of HERC2 and APBA2, together with similar work on the HERC2 - OCA2 interval from Donnelly et al. [37], is consistent with the possibility that blue eyes were selected independently from fair skin for reasons having to do with reproductive success rather than survival.”
From Genetic Architecture of Skin and Eye Color in an African-European Admixed Population (2013) · cites this paper as [37]
Self-check
Percentages, sums and reported differences re-computed from the paper’s own numbers.
Each contradiction between two passages listed here was confirmed by an independent check.
Rated minor: it would not touch a result — a value no result rests on, a p-value that stays on the same side of the significance level, or a conflict that is clerical, resolved elsewhere in the paper, or outside its own findings.
In the paper
“| Total Kidd lab samples | 3,495 | | | | Total HGDP samples | 499 | | | | Total samples | 3,931 | | |”
§ A global view of the OCA2-HERC2 region and pigmentation > Materials and methods > Populations
Reported 3931 · recomputed 3994
Rated minor: it would not touch a result — a value no result rests on, a p-value that stays on the same side of the significance level, or a conflict that is clerical, resolved elsewhere in the paper, or outside its own findings.
In the paper
§ A global view of the OCA2-HERC2 region and pigmentation > Abstract
“We have genotyped 3,432 individuals from 72 populations for 21 SNPs in the OCA2-HERC2 region including those previously associated with eye or skin pigmentation.”
§ A global view of the OCA2-HERC2 region and pigmentation > Materials and methods > Populations
“We have typed 3,432 individuals from a global sample of 73 populations.”
Rated minor: it would not touch a result — a value no result rests on, a p-value that stays on the same side of the significance level, or a conflict that is clerical, resolved elsewhere in the paper, or outside its own findings.
In the paper
§ A global view of the OCA2-HERC2 region and pigmentation > Results > Haplotypes and LD
“We also looked at the haplotypes of the seven SNPs that compose the first high LD region in East Asians with respect to the derived allele of rs1800414 (Fig. 7).”
§ A global view of the OCA2-HERC2 region and pigmentation > Results > Haplotypes and LD
“In East Asia, the first high LD region extends from SNP 2 (rs1800414) to SNP 9 (rs746861)”
Rated minor: it would not touch a result — a value no result rests on, a p-value that stays on the same side of the significance level, or a conflict that is clerical, resolved elsewhere in the paper, or outside its own findings.
In the paper
§ A global view of the OCA2-HERC2 region and pigmentation > Discussion > Distribution of blue-eye associated alleles
“Outside of Europe, the blue-eye associated alleles of BEH1 and BEH2 are still common and homozygotes of these alleles are still seen but the blue-eye associated allele of BEH2 is much rarer and blue-eye associated homozygotes are virtually unseen.”
§ A global view of the OCA2-HERC2 region and pigmentation > Results > Geographic distributions of haplotypes
“the TG allele at BEH2 is essentially observed only in Europe”
Citations
Cites
Generating samples under a Wright–Fisher neutral model of genetic variation
Hudson, R. R. (2002) · Bioinformatics · doi:10.1093/bioinformatics/18.2.337 · Cited by 2,397
Scheet, P. A., & Stephens, M. (2006) · The American Journal of Human Genetics · doi:10.1086/502802 · Cited by 1,959
Worldwide Human Relationships Inferred from Genome-Wide Patterns of Variation
Li, J. Z., Absher, D. M., Tang, H., Southwick, A. M., Casto, A. M., Ramachandran, S., Cann, H. M., Barsh, G. S., Feldman, M. W., Cavalli-Sforza, L. L., et al. (2008) · Science · doi:10.1126/science.1153717 · Cited by 1,915
Positive Natural Selection in the Human Lineage
Sabeti, P. C., Schaffner, S. F., Fry, B., Lohmueller, J., Varilly, P., Shamovsky, O., Palma, A., Mikkelsen, T. S., Altshuler, D., & Lander, E. S. (2006) · Science · doi:10.1126/science.1124309 · Cited by 1,157
Genetic determinants of hair, eye and skin pigmentation in Europeans
Sulem, P., Gudbjartsson, D. F., Stacey, S. N., Helgason, A., Rafnar, T., Magnusson, K. P., Manolescu, A., Karason, A., Palsson, A., Thorleifsson, G., et al. (2007) · Nature Genetics · doi:10.1038/ng.2007.13 · Cited by 750 · cited 7×
“These sites include a three-SNP haplotype (rs4778138, rs4778241, rs7495174) and four individual SNPs, rs1129038, rs12913832, rs916977, and rs1667394 (Duffy et al. 2007; Sturm et al. 2008; Kayser et al. 2008; Sulem et al. 2007; Mengel-From et al. 2010; Walsh et al. 2010).”
InfluentialGenotype, haplotype and copy-number variation in worldwide human populations
Jakobsson, M., Scholz, S. W., Scheet, P., Gibbs, J. R., VanLiere, J. M., Fung, H.-C., Szpiech, Z. A., Degnan, J. H., Wang, K., Guerreiro, R., et al. (2008) · Nature · doi:10.1038/nature06742 · Cited by 714
Genetic evidence for the convergent evolution of light skin in Europeans and East Asians
Norton, H. L., Kittles, R. A., Parra, E., McKeigue, P., Mao, X., Cheng, K., Canfield, V. A., Bradley, D. G., McEvoy, B., & Shriver, M. D. (2006) · Molecular Biology and Evolution · doi:10.1093/molbev/msl203 · Cited by 410 · cited 2×
“Again this result is not completely unexpected since this allele has been associated with lighter skin pigmentation in East Asians, and variants affecting skin pigmentation have previously been shown to be targets of selection (Edwards et al. 2010; Izagirre et al. 2006; Lao et al. 2007; Norton et al. 2007).”
Human pigmentation genes: identification, structure and consequences of polymorphic variation
Sturm, R. A., Teasdale, R. D., & Box, N. F. (2001) · Gene · doi:10.1016/s0378-1119(01)00694-1 · Cited by 398
Molecular genetics of human pigmentation diversity
Sturm, R. A. (2009) · Human Molecular Genetics · doi:10.1093/hmg/ddp003 · Cited by 379
Sturm, R. A., Duffy, D. L., Zhao, Z. Z., Leite, F. P. N., Stark, M. S., Hayward, N. K., Martin, N. G., & Montgomery, G. W. (2008) · The American Journal of Human Genetics · doi:10.1016/j.ajhg.2007.11.005 · Cited by 378
Cited by
Sorted by citations
Genome-wide patterns of selection in 230 ancient Eurasians
Mathieson, I., Lazaridis, I., Rohland, N., Mallick, S., Patterson, N., Roodenberg, S. A., Harney, E., Stewardson, K., Fernandes, D., Novak, M., et al. (2015) · Nature · doi:10.1038/nature16152 · Cited by 1,515
Ancient human genomes suggest three ancestral populations for present-day Europeans
Lazaridis, I., Patterson, N., Mittnik, A., Renaud, G., Mallick, S., Kirsanow, K., Sudmant, P. H., Schraiber, J. G., Castellano, S., Lipson, M., et al. (2014) · Nature · doi:10.1038/nature13673 · Cited by 1,357
Self-citationA Dynamic 6,000-Year Genetic History of Eurasia’s Eastern Steppe
Jeong, C., Wang, K., Wilkin, S., Taylor, W. T. T., Miller, B. K., Bemmann, J., Stahl, R., Chiovelli, C., Knolle, F., Ulziibayar, S., et al. (2020) · Cell · doi:10.1016/j.cell.2020.10.015 · Cited by 326
Early Neolithic genomes from the eastern Fertile Crescent
Broushaki, F., Thomas, M. G., Link, V., López, S., van Dorp, L., Kirsanow, K., Hofmanová, Z., Diekmann, Y., Cassidy, L. M., Díez-del-Molino, D., et al. (2016) · Science · doi:10.1126/science.aaf7943 · Cited by 288
Kídd, K. K., PAKSTIS, A. J., Speed, W. C., Lagace, R. E., Chang, J., Wootton, S., Haigh, E., & Kidd, J. R. (2014) · Forensic Science International Genetics · doi:10.1016/j.fsigen.2014.06.014 · Cited by 276
Self-citation
Metadata
- Authors
- Donnelly, M. P., Paschou, P., Grigorenko, E., Gurwitz, D., Barta, C., Lu, R.-B., Zhukova, O. V., Kim, J.-J., Siniscalco, M., New, M., Li, H., Kajuna, S. L. B., Manolopoulos, V. G., Speed, W. C., Pakstis, A. J., Kidd, J. R., & Kidd, K. K.
- Affiliations
- Yale University (US)
- Democritus University of Thrace (GR)
- Tel Aviv University (IL)
- Semmelweis University (HU)
- National Cheng Kung University (TW)
- Vavilov Institute of General Genetics (RU)
- Rockefeller University (US)
- Icahn School of Medicine at Mount Sinai (US)
- Fudan University (CN)
- Hubert Kairuki Memorial University (TZ)
- ORCID
- Venue
- Human Genetics
- Published
- 2011-11-08
- Volume
- 131
- Issue
- 5
- Pages
- 683-696
- ISSN
- 0018-7348 (ISSN-L)
- 0340-6717
- 1432-1203
- PMC
- PMC3325407
- OpenAlex
- W2043631048
- Semantic Scholar
- 899ecf13f4b1cdf7b01e4dc73a4b70f32b7286d6
- Cited by
- 131
- References
- 35
- Citations by year
- 2026: 4 · 2025: 11 · 2024: 8 · 2023: 4 · 2022: 13 · 2021: 12 · 2020: 9 · 2019: 9 · 2018: 14 · 2017: 10 · 2016: 7 · 2015: 8 · 2014: 11 · 2013: 6 · 2012: 4
- FWCI
- 3.37
- Type
- journal article
- Language
- en
- Open access
- hybrid
- doi.org
- Licence
- cc-by-nc
- Locations
- Human Genetics (publishedVersion, cc-by-nc)
- Europe PMC (PubMed Central) (publishedVersion, cc-by-nc)
- PubMed Central (publishedVersion, cc-by-nc)
- PubMed (publishedVersion)
- Funders
- U.S. Department of Justice
- Tel Aviv University
- National Institutes of Health
- Office of Justice Programs
- National Institute of General Medical Sciences (GM 57672, P01GM057672)
- Topics
- Life Sciences › Biochemistry, Genetics and Molecular Biology › Cell Biology › melanin and skin pigmentation
- Life Sciences › Biochemistry, Genetics and Molecular Biology › Genetics › Forensic and Genetic Research
- Life Sciences › Biochemistry, Genetics and Molecular Biology › Genetics › Genetic Associations and Epidemiology
- Keywords
- OCA2, HERC2, eye pigmentation, skin pigmentation, blue eyes, single nucleotide polymorphisms, haplotypes, natural selection, European populations
- MeSH terms
- Europe, Eye Color, Asia, Eastern, Gene Frequency, Haplotypes, Humans, Selection, Genetic, Skin Pigmentation, Linkage Disequilibrium, Polymorphism, Single Nucleotide, Guanine Nucleotide Exchange Factors, Membrane Transport Proteins, Ubiquitin-Protein Ligases
About these checks
Registry, retraction, Cites and statistics results are computed, not judged, with one exception: a printed reference that no index lists is read once by a model before it counts as a citation error. Claims are extracted by a model and kept only when their quote appears verbatim in the text; each cited source is then checked, with a model’s help, for whether it says what the claim relies on. Those verdicts can be wrong — read the claim’s quote and the cited source before relying on one.
A language model drew the claims from the paper on 2026-10-10, under version 3 of the claim definition (model deepseek-v4.1-flash, prompt extract-v3).
A second model labelled each claim on 2026-10-10 (model jev-1.13-20260917, definition revision gold-guideline-v0.2).
Cited sources are checked with a language model’s help (gpt-6-sol).
Statistics and arithmetic are recomputed, not judged.
Confidence bands are shown only for fields calibrated on our annotated test set. None is calibrated yet, so no band is shown.
What counts as a claim ›How we measure confidence ›How we check this ›
Are you an author, or do you see a problem with this page? Request a review
