

The DOI matches its Crossref record; 59 of the 59 references it cites were found in a registry or an index.
Overlaps Between Autism and Language Impairment: Phenomimicry or Shared Etiology?
Open accessAbstract
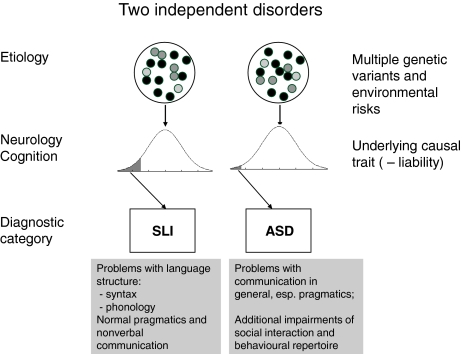
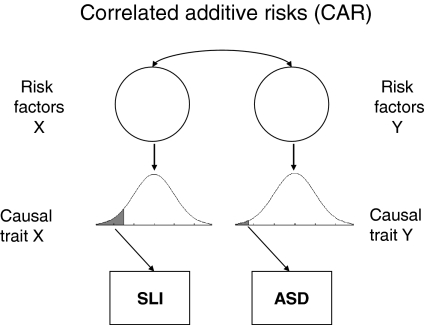
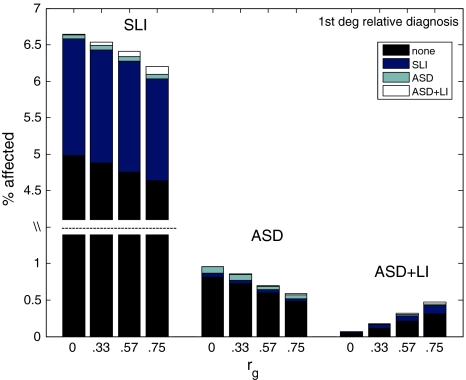
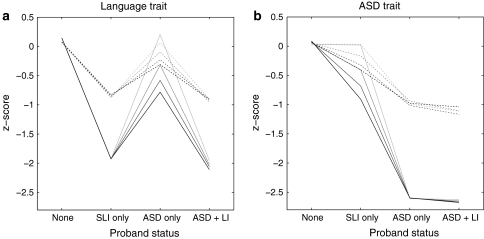
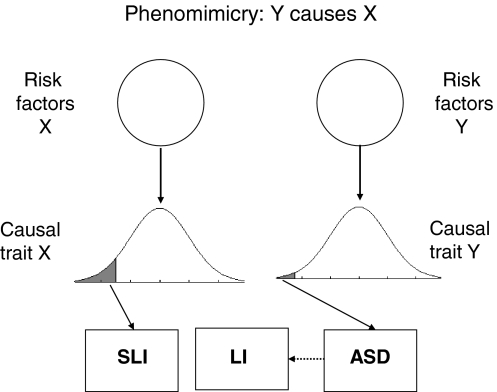
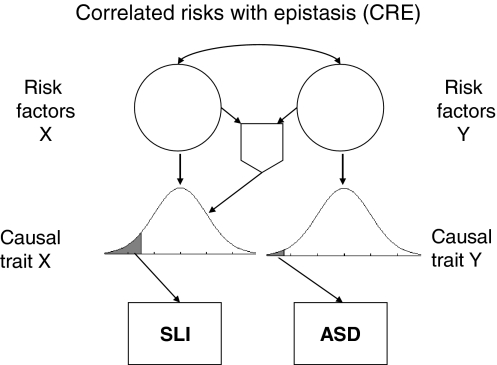
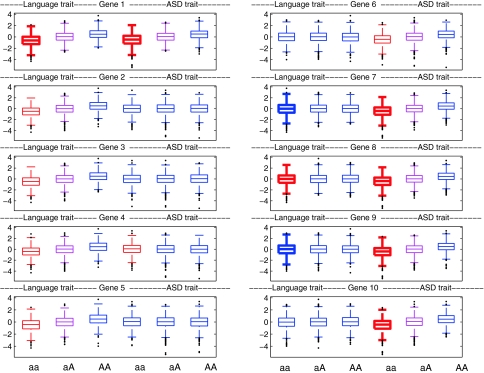
Traditionally, autistic spectrum disorder (ASD) and specific language impairment (SLI) are regarded as distinct conditions with separate etiologies. Yet these disorders co-occur at above chance levels, suggesting shared etiology. Simulations, however, show that additive pleiotropic genes cannot account for observed rates of language impairment in relatives, which are higher for probands with SLI than for those with ASD + language impairment. An alternative account is in terms of 'phenomimicry', i.e., language impairment in comorbid cases may be a consequence of ASD risk factors, and different from that seen in SLI. However, this cannot explain why molecular genetic studies have found a common risk genotype for ASD and SLI. This paper explores whether nonadditive genetic influences could account for both family and molecular findings. A modified simulation involving G x G interactions obtained levels of comorbidity and rates of impairment in relatives more consistent with observed values. The simulations further suggest that the shape of distributions of phenotypic trait scores for different genotypes may provide evidence of whether a gene is involved in epistasis.
Overview
The claims and statistics of this paper haven’t been checked yet.
Run the check — free, no account needed. It reads the open-access text and checks the sources it cites.
Integrity signals
Registry
Cites
Statistics
Figures
Verification
Claims the paper makes
The claims and statistics of this paper haven’t been checked yet.
Run the check — free, no account needed. It reads the open-access text and checks the sources it cites.
Claims other papers make about this one
Each is checked against this paper’s own text: does it say what the citing paper says it does?
The check wasn’t confident either way, so it gives no verdict — never disputed.
In the citing paper
“and in individuals with dysmorphic features [49]”
From DSM-5 and autism spectrum disorders (ASDs): an opportunity for identifying ASD subtypes (2013) · cites this paper as [49]
Experimental — accuracy not yet measured
Self-check
Percentages, sums and reported differences re-computed from the paper’s own numbers.
The self-check needs the paper’s full text.
Citations
Cites
Diagnostic and Statistical Manual of Mental Disorders
Williams, J. B. W., & First, M. B. (2013) · Oxford University Press eBooks · doi:10.1093/acrefore/9780199975839.013.104 · Cited by 109,845
The Endophenotype Concept in Psychiatry: Etymology and Strategic Intentions
Gottesman, I. I., & Gould, T. D. (2003) · American Journal of Psychiatry · doi:10.1176/appi.ajp.160.4.636 · Cited by 5,615
Diagnostic and Statistical Manual of Mental Disorders
Raber, G., & Spokas, M. (2024) · doi:10.4135/9781071886229.n145 · Cited by 2,806
Autism as a strongly genetic disorder: evidence from a British twin study
Bailey, A., Le Couteur, A., Gottesman, I., Bolton, P., Simonoff, E., Yuzda, E., & Rutter, M. (1995) · Psychological Medicine · doi:10.1017/s0033291700028099 · Cited by 2,461
Prevalence of Specific Language Impairment in Kindergarten Children
Tomblin, J. B., Records, N. L., Buckwalter, P., Zhang, X., Smith, E., & O’Brien, M. (1997) · Journal of Speech, Language, and Hearing Research · doi:10.1044/jslhr.4006.1245 · Cited by 2,288
Handbook of Autism and Pervasive Developmental Disorders
(2005) · Wiley eBooks · doi:10.1002/9780470939352 · Cited by 2,262
Baird, G., Simonoff, E., Pickles, A., Chandler, S., Loucas, T., Meldrum, D., & Charman, T. (2006) · The Lancet · doi:10.1016/s0140-6736(06)69041-7 · Cited by 2,104
The inheritance of liability to certain diseases, estimated from the incidence among relatives
Falconer, D. (1965) · Annals of Human Genetics · doi:10.1111/j.1469-1809.1965.tb00500.x · Cited by 1,662
INFANTILE AUTISM: A GENETIC STUDY OF 21 TWIN PAIRS
Folstein, S., & Rutter, M. (1977) · Journal of Child Psychology and Psychiatry · doi:10.1111/j.1469-7610.1977.tb00443.x · Cited by 1,361 · cited 2×
“1995; Folstein and Rutter 1977; Hallmayer et al. 2002; Steffenburg et al. 1989) and SLI (Bishop et al. 1995; Bishop and Hayiou-Thomas 2008; Lewis and Thompson 1992; Tomblin and Buckwalter 1998), despite growing up together and sharing many environmental influences.”
BackgroundAn investigation of language impairment in autism: Implications for genetic subgroups
Kjelgaard, M., & Tager-Flusberg, H. B. (2001) · Language and Cognitive Processes · doi:10.1080/01690960042000058 · Cited by 1,131
Research works printed but not linked: 1
- World Health Organization (1993) The ICD-10 classification for mental and behavioural disorders: diagnostic criteria for research. WHO, Geneva
Cited by
Sorted by citations
Items 101–169 of 169
War Albert Einstein ein Asperger-Autist?
Kamp‐Becker, I. (2013) · Nervenheilkunde · doi:10.1055/s-0038-1633284 · Cited by 4
Communication and its Development in Autism Spectrum Disorders
Paul, R., & Simmons, E. S. (2019) · Cambridge University Press eBooks · doi:10.1017/9781108297769.005 · Cited by 4
Rethinking the role of language in autism
Hinzen, W. (2022) · Evolutionary Linguistic Theory · doi:10.1075/elt.00040.hin · Cited by 6
Rui, H., Schaeffer, J. C., & He, X. (2024) · Language Acquisition · doi:10.1080/10489223.2024.2371594 · Cited by 3
Rutkiewicz-Hańczewska, M., & Korendo, M. (2024) · Prace Językoznawcze · doi:10.31648/pj.10597 · Cited by 3
Zarokanellou, V., Gryparis, A., & Papanikolaou, Κ. (2025) · Brain Sciences · doi:10.3390/brainsci15010073 · Cited by 3
A Feasibility Study of CCC-2 as a Screening Instrument for Children with Communication Disorders
서유경, & Ahn, S. (2015) · Journal of speech-language & hearing disorders · doi:10.15724/jslhd.2015.24.4.030 · Cited by 3
Boerma, T., Wijnen, F. N. K., & Blom, E. (2022) · Stem- Spraak- en Taalpathologie · doi:10.21827/32.8310/2022-sg-1 · Cited by 3
Structural Language and Nonverbal Ability Profiles in Monolingual and Bilingual Children with ASD
Silleresi, S. (2018) · theses.fr (ABES) · doi:10.70675/f16bd1f4zf081z4f89zac3bzac3f4727a65b · Cited by 3
Qiu, W., & He, X. (2024) · Journal of Autism and Developmental Disorders · doi:10.1007/s10803-024-06271-z · Cited by 2
DSM-5 and ASD: Reflections and Commentary
Lord, C., & Gotham, K. O. (2014) · Autism and child psychopathology series · doi:10.1007/978-3-319-06796-4_17 · Cited by 2
Williams, D. M. (2017) · Wiley eBooks · doi:10.1002/9781118554470.ch13 · Cited by 2
DLD (SLI) a ASD w kontekście logopedycznej diagnozy różnicowej
Sadowska, E. (2022) · Logopaedica Lodziensia · doi:10.18778/2544-7238.06.15 · Cited by 1
Gagné‐Julien, A., & Bérubé, A. (2023) · European Journal for Philosophy of Science · doi:10.1007/s13194-023-00535-8 · Cited by 1
Du, J., He, X., & Yu, H. (2025) · Journal of Communication Disorders · doi:10.1016/j.jcomdis.2025.106574 · Cited by 1
DLD and ALI Language Profiles are not the Same : Evidence from Mandarin Wh-words
Huang, R., Schaeffer, J. C., & He, X. (2021) · UvA-DARE (University of Amsterdam) · Cited by 1
The Evolution of Language and Speech
Benítez‐Burraco, A., & Dediu, D. (2021) · Oxford University Press eBooks · doi:10.1093/oxfordhb/9780198813781.013.29 · Cited by 1
Coman, D. C., & Mian, N. D. (2018) · Current clinical psychiatry · doi:10.1007/978-3-319-98643-2_5 · Cited by 1
A kommunkáció rejtett zavara: a pragmatikai kommunikációs zavar
Svindt, V. (2021) · Anyanyelv-pedagógia · doi:10.21030/anyp.2021.3.1 · Cited by 1
Newbury, D. F., Simpson, N. H., Thompson, P. A., & Bishop, D. (2020) · Wellcome Open Research · doi:10.12688/wellcomeopenres.14677.3 · Cited by 1
Self-citationTaylor, L. J. (2013) · UWA Profiles and Research Repository (UWA) · Cited by 1
Factors Influencing Participation Outcomes of Young Adults with Autism Spectrum Disorder
Kirby, A. V. (2015) · Carolina Digital Repository (University of North Carolina at Chapel Hill) · doi:10.17615/mder-ke30 · Cited by 1
Uniform screening for atypical language development in Dutch child health care
Visser‐Bochane, M. I. (2021) · University of Groningen research database (University of Groningen / Centre for Information Technology) · doi:10.33612/diss.171348669 · Cited by 1
Evaluating Causal Psychological Models: A Study of Imitation Theories of Autism Using a Large SamplePreprint
Tang, B., Wodka, E. L., Caffo, B. S., & Ewen, J. B. (2023) · doi:10.31234/osf.io/qfv5c · Cited by 1
Cross‐Linguistic Perspectives on Morphosyntax in Child Language Disorders
Antonijević, S., & Meir, N. (2024) · doi:10.1002/9781119875949.ch19 · Cited by 1
From the Savannah to the Cloud: Blogging Evolutionary Linguistics Research
Littauer, R., Roberts, S. G., Winters, J., Bailes, R., Pleyer, M., & Little, H. (2014) · Max Planck Digital Library · doi:10.5281/zenodo.23413654
Westermark, S. O. (2013) · KTH Publication Database DiVA (KTH Royal Institute of Technology)
Using digital stories to improve writing skills of students With Autism Spectrum Disorder
Andreevski, M. (2013) · Rowan Digitals Works (Rowan University)
Pereira, A. F. S. (2014) · Portuguese National Funding Agency for Science, Research and Technology (RCAAP Project by FCT)
Developmental Language Impairment: Conceptual Issues and Prospects of an Evolutionary Approach
Lian, A. (2016) · Palgrave Macmillan UK eBooks · doi:10.1057/978-1-137-58746-6_2
Language Impairment in Autism Spectrum Disorders
Rakhlin, N., & Grigorenko, E. L. (2014) · WORLD SCIENTIFIC eBooks · doi:10.1142/9789814602167_0003
Camacho, P. (2017)
Montrenes, J. J. (2021) · Louisiana State University · doi:10.31390/gradschool_theses.5336
Déficit da interação social em crianças e adolescentes autistas
Pegoraro, L. F. (2014) · doi:10.47749/t/unicamp.2014.923146
O’Brien, A. M., Perrachione, T. K., Weil, L. W., Araujo, Y. S., Halverson, K. K., Harris, A., Ostrovskaya, I., Kjelgaard, M., Wexler, K. N., Tager-Flusberg, H. B., et al. (2022) · SSRN Electronic Journal · doi:10.2139/ssrn.4170698
An Overview about Specific Language Impairment: Review Article
(2023) · The Egyptian Journal of Hospital Medicine · doi:10.21608/ejhm.2023.313893
Reader�s Theater projects in reading disability remediation (ReadDrama): project data
Hautala, J., & Junttila, E. (2024) · doi:10.17011/jyx/dataset/94903
Intelligence profiles in autism spectrum disorder
(2023) · Language acquisition & language disorders · doi:10.1075/lald.68.c4
Interactive technologies for training language skills in children on the autism spectrum
(2023) · Language acquisition & language disorders · doi:10.1075/lald.68.c7
Structural language and Autism Spectrum Disorder
(2023) · Language acquisition & language disorders · doi:10.1075/lald.68.c2
(2023) · Language acquisition & language disorders · doi:10.1075/lald.68.c3
(2023) · Language acquisition & language disorders · doi:10.1075/lald.68.c1
(2023) · Language acquisition & language disorders · doi:10.1075/lald.68.ack
List of most frequent acronyms and abbreviations
(2023) · Language acquisition & language disorders · doi:10.1075/lald.68.abb
(2023) · Language acquisition & language disorders · doi:10.1075/lald.68.refs
(2023) · Language acquisition & language disorders · doi:10.1075/lald.68.lot
Profiles in children on the autism spectrum
(2023) · Language acquisition & language disorders · doi:10.1075/lald.68.c6
(2023) · Language acquisition & language disorders · doi:10.1075/lald.68.li
Autism severity and developmental factors
(2023) · Language acquisition & language disorders · doi:10.1075/lald.68.c5
(2023) · Language acquisition & language disorders · doi:10.1075/lald.68.pre
(2023) · Language acquisition & language disorders · doi:10.1075/lald.68.lof
(2023) · Language acquisition & language disorders · doi:10.1075/lald.68.si
(2023) · Language acquisition & language disorders · doi:10.1075/lald.68.toc
(2023) · Language acquisition & language disorders · doi:10.1075/lald.68.prelim
(2023) · Language acquisition & language disorders · doi:10.1075/lald.68.c8
Gelişimsel Bozukluğu Olan Çocuklarda İstatistiksel Dil Öğrenimi
Karaman, F. (2024) · Dilbilim Araştırmaları Dergisi · doi:10.18492/dad.1461707
Predictive Language Processing in Autism Spectrum Disorder and Developmental Language Disorder
Ανδρέου, Γ., Lymperopoulou, V., & Aslanoglou, V. (2025) · IGI Global eBooks · doi:10.4018/979-8-3693-8176-2.ch008
Ανδρέου, Γ., Lymperopoulou, V., & Papoudi, D. (2025) · Advances in Neurodevelopmental Disorders · doi:10.1007/s41252-025-00438-0
Hus, Y., & Segal, O. (2025) · Exploration of Neuroprotective Therapy · doi:10.37349/ent.2025.1004110
FOXP family of transcription factors in autism spectrum disorder in humans: a systematic review
SANTANA, J. D., Fernandes, J. V. A., Júnior, E. A. D. S., Holanda, M. M. D. A., do Egito, L. J. C., Ravanello, A., ANTONINO, J. P., & NEVES, M. A. (2025) · Minerva Psychiatry · doi:10.23736/s2724-6612.25.02624-7
Doghadze, I., & Gagoshidze, T. (2026) · Frontiers in Psychology · doi:10.3389/fpsyg.2026.1920573
Zeng, X., Gao, M., & Shirai, Y. (2026) · Journal of Speech Language and Hearing Research · doi:10.1044/2026_jslhr-24-00625
Metadata
- Authors
- Bishop, D. V. M.
- Affiliations
- University of Oxford (GB)
- Corresponding author
- Bishop, D. V. M.
- ORCID
- Bishop, D. V. M.
- Venue
- Behavior Genetics
- Published
- 2010-07-18
- Volume
- 40
- Issue
- 5
- Pages
- 618-629
- ISSN
- 0001-8244 (ISSN-L)
- 1573-3297
- PMC
- PMC2921070
- OpenAlex
- W2001905680
- Cited by
- 169
- References
- 59
- Citations by year
- 2026: 2 · 2025: 10 · 2024: 11 · 2023: 29 · 2022: 8 · 2021: 12 · 2020: 7 · 2019: 9 · 2018: 8 · 2017: 11 · 2016: 9 · 2015: 8 · 2014: 13 · 2013: 15 · 2012: 8
- FWCI
- 6.21
- Type
- journal article
- Language
- en
- Open access
- hybrid
- doi.org
- Licence
- cc-by-nc
- Locations
- Behavior Genetics (publishedVersion, cc-by-nc)
- PubMed Central (publishedVersion, cc-by-nc)
- PubMed (publishedVersion)
- Oxford University Research Archive (ORA) (University of Oxford) (submittedVersion, cc-by-nc)
- Funders
- Wellcome Trust (082498/Z/07/Z, 082498)
- Topics
- Life Sciences › Neuroscience › Cognitive Neuroscience › Autism Spectrum Disorder Research
- Social Sciences › Psychology › Developmental and Educational Psychology › Language Development and Disorders
- Life Sciences › Biochemistry, Genetics and Molecular Biology › Genetics › Genetics and Neurodevelopmental Disorders
- Keywords
- autism spectrum disorder, specific language impairment, comorbidities, shared etiology, epistasis, gene-gene interaction, pleiotropy
- MeSH terms
- Autistic Disorder, Epistasis, Genetic, Humans, Language Disorders, Models, Theoretical, Software, Comorbidity
About these checks
Registry, retraction, Cites and statistics results are computed, not judged, with one exception: a printed reference that no index lists is read once by a model before it counts as a citation error. Claims are extracted by a model and kept only when their quote appears verbatim in the text; each cited source is then checked, with a model’s help, for whether it says what the claim relies on. Those verdicts can be wrong — read the claim’s quote and the cited source before relying on one.
Statistics and arithmetic are recomputed, not judged.
Confidence bands are shown only for fields calibrated on our annotated test set. None is calibrated yet, so no band is shown.
What counts as a claim ›How we measure confidence ›How we check this ›
Are you an author, or do you see a problem with this page? Request a review
