

The DOI matches its Crossref record; 48 of the 48 references it cites were found in a registry or an index.
The great time series classification bake off: a review and experimental evaluation of recent algorithmic advances
Open accessAbstract
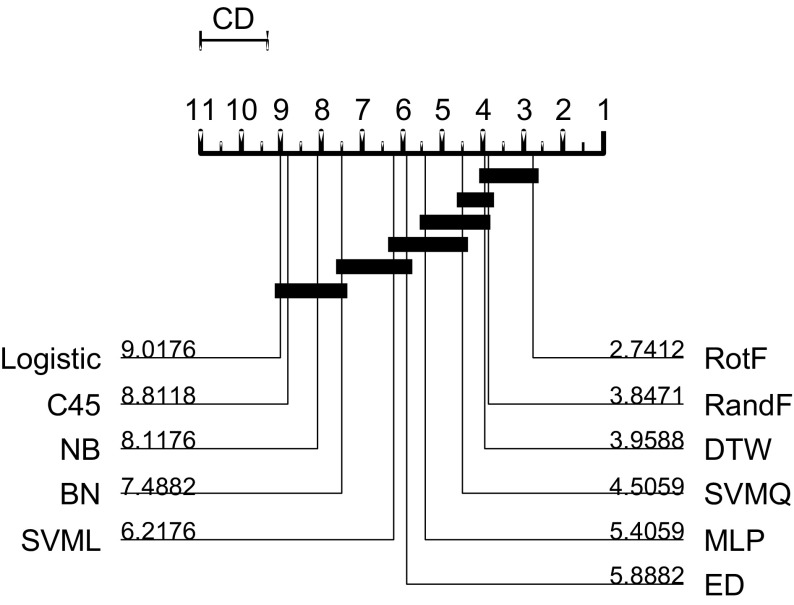
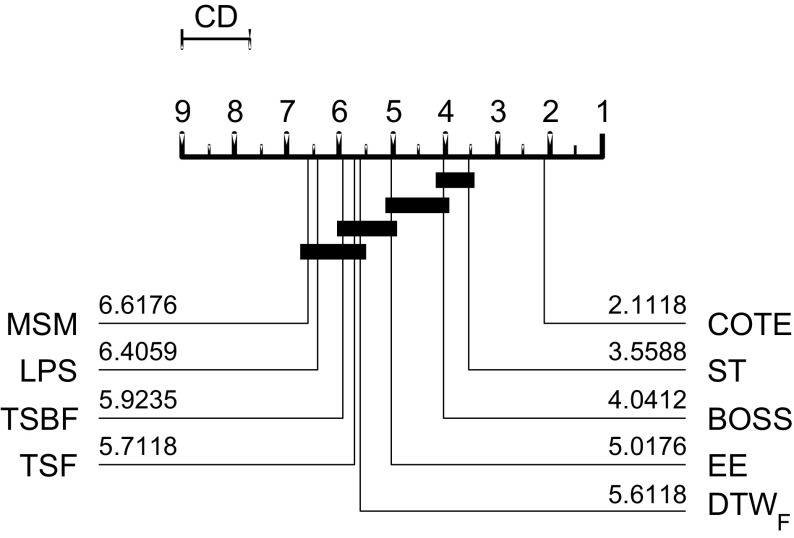
In the last 5 years there have been a large number of new time series classification algorithms proposed in the literature. These algorithms have been evaluated on subsets of the 47 data sets in the University of California, Riverside time series classification archive. The archive has recently been expanded to 85 data sets, over half of which have been donated by researchers at the University of East Anglia. Aspects of previous evaluations have made comparisons between algorithms difficult. For example, several different programming languages have been used, experiments involved a single train/test split and some used normalised data whilst others did not. The relaunch of the archive provides a timely opportunity to thoroughly evaluate algorithms on a larger number of datasets. We have implemented 18 recently proposed algorithms in a common Java framework and compared them against two standard benchmark classifiers (and each other) by performing 100 resampling experiments on each of the 85 datasets. We use these results to test several hypotheses relating to whether the algorithms are significantly more accurate than the benchmarks and each other. Our results indicate that only nine of these algorithms are significantly more accurate than both benchmarks and that one classifier, the collective of transformation ensembles, is significantly more accurate than all of the others. All of our experiments and results are reproducible: we release all of our code, results and experimental details and we hope these experiments form the basis for more robust testing of new algorithms in the future.
Overview
The claims and statistics of this paper haven’t been checked yet.
Run the check — free, no account needed. It reads the open-access text and checks the sources it cites.
Integrity signals
Registry
Cites
Statistics
Figures
Verification
Claims the paper makes
The claims and statistics of this paper haven’t been checked yet.
Run the check — free, no account needed. It reads the open-access text and checks the sources it cites.
Claims other papers make about this one
Each is checked against this paper’s own text: does it say what the citing paper says it does?
In the citing paper
“HIVE-COTE is currently considered the state-of-the-art algorithm for time series classification (Bagnall et al., 2017) when evaluated over the 85 datasets from the UCR/UEA archive.”
From Deep learning for time series classification: a review (2019) · cites this paper as Bagnall et al., 2017
In the citing paper
“To achieve its high accuracy, HIVE-COTE becomes hugely computationally intensive and impractical to run on a real big data mining problem (Bagnall et al., 2017).”
From Deep learning for time series classification: a review (2019) · cites this paper as Bagnall et al., 2017
In the citing paper
“Among these methods, only a few have considered Deep Neural Networks (DNNs) to perform this task.”
From Deep learning for time series classification: a review (2019) · cites this paper as Bagnall et al., 2017
In the citing paper
“Similarly to Bagnall et al. (2017), in order to have a fair comparison between the tested approaches, we developed a common framework in Python, Keras (Chollet, 2015) and Tensorflow (Abadi et al., 2015) to train the deep learning models on a cluster of more than 60 GPUs.”
From Deep learning for time series classification: a review (2019) · cites this paper as Bagnall et al., 2017
In the citing paper
“Note that the time series in this archive are already z-normalized (Bagnall et al., 2017).”
From Deep learning for time series classification: a review (2019) · cites this paper as Bagnall et al., 2017
In the citing paper
“This archive also exhibits datasets with different characteristics such as the length of the time series which, unlike the UCR/UEA archive, varies among the same dataset. This is due to the fact that the datasets in the UCR/UEA archive are already re-scaled to have an equal length among one dataset (Bagnall et al., 2017).”
From Deep learning for time series classification: a review (2019) · cites this paper as Bagnall et al., 2017
In the citing paper
“In order to have a thorough and fair experimental evaluation of all approaches, we tested each algorithm on the whole UCR/UEA archive (Chen et al., 2015b; Bagnall et al., 2017) which contains 85 univariate time series datasets.”
From Deep learning for time series classification: a review (2019) · cites this paper as Bagnall et al., 2017
In the citing paper
“The informal consensus in the literature is that generative models are usually less accurate than direct discriminative models (Bagnall et al., 2017; Nguyen et al., 2017);”
From Deep learning for time series classification: a review (2019) · cites this paper as Bagnall et al., 2017
In the citing paper
“To measure the performance of the model on the test data (generalization), we adopted the accuracy measure (similarly to Bagnall et al. (2017)).”
From Deep learning for time series classification: a review (2019) · cites this paper as Bagnall et al., 2017
In the citing paper
“However, given the small sample size (only 7 datasets), we cannot conclude that FCN will almost always outperform the ResNet model for ECG datasets (Bagnall et al., 2017).”
From Deep learning for time series classification: a review (2019) · cites this paper as Bagnall et al., 2017
In the citing paper
“This straightforward approach supposes that the ED is able to strongly separate the raw time series, which is usually not the case evident by the low accuracy of the nearest neighbor when coupled with ED (Bagnall et al., 2017).”
From Deep learning for time series classification: a review (2019) · cites this paper as Bagnall et al., 2017
Self-check
Percentages, sums and reported differences re-computed from the paper’s own numbers.
The self-check needs the paper’s full text.
Citations
Cites
The WEKA data mining software: an update
Hall, M., Frank, E., Holmes, G., Pfahringer, B., Reutemann, P., & Witten, I. H. (2009) · ACM SIGKDD Explorations Newsletter · doi:10.1145/1656274.1656278 · Cited by 17,750
Statistical Comparisons of Classifiers over Multiple Data Sets
Demšar, J. (2006) · doi:10.5555/1248547.1248548 · Cited by 12,051
Domain-Adversarial Training of Neural Networks
Ganin, Y., Ustinova, E., Ajakan, H., Germain, P., Larochelle, H., Laviolette, F., Marchand, M., & Lempitsky, V. (2017) · Advances in Computer Vision and Pattern Recognition · doi:10.1007/978-3-319-58347-1_10 · Cited by 8,318
Experiencing SAX: A novel symbolic representation of time series
Lin, J., Keogh, E., Wei, L., & Lonardi, S. (2007) · Data Mining and Knowledge Discovery · doi:10.1007/s10618-007-0064-z · Cited by 1,618
Self-citationQuerying and mining of time series data
Ding, H., Trajcevski, G., Scheuermann, P., Wang, X., & Keogh, E. (2008) · Proceedings of the VLDB Endowment · doi:10.14778/1454159.1454226 · Cited by 1,353
Self-citationGarcía, S., & Herrera, F. (2008) · Cited by 1,277
On the Need for Time Series Data Mining Benchmarks: A Survey and Empirical Demonstration
Keogh, E., & Kasetty, S. (2003) · Data Mining and Knowledge Discovery · doi:10.1023/a:1024988512476 · Cited by 860
Self-citationExperimental comparison of representation methods and distance measures for time series data
Wang, X., Mueen, A., Ding, H., Trajcevski, G., Scheuermann, P., & Keogh, E. (2012) · Data Mining and Knowledge Discovery · doi:10.1007/s10618-012-0250-5 · Cited by 846
Self-citationOn The Marriage of Lp-norms and Edit Distance
Chen, L., & Ng, R. T. (2004) · Elsevier eBooks · doi:10.1016/b978-012088469-8.50070-x · Cited by 792
Algorithms for the Longest Common Subsequence Problem
Hirschberg, D. S. (1977) · Journal of the ACM · doi:10.1145/322033.322044 · Cited by 752
Cited by
Sorted by citations
Items 401–500 of 1,000
Attentional Gated Res2Net for Multivariate Time Series Classification
Yang, C., Wang, X., Yao, L., Long, G., Jiang, J. B., & Xu, G. (2022) · Neural Processing Letters · doi:10.1007/s11063-022-10944-0 · Cited by 19
Monitoring Arm Movements Post-Stroke for Applications in Rehabilitation and Home Settings
Arrunátegui, G., Eng, J. J., & Hodgson, A. J. (2022) · IEEE Transactions on Neural Systems and Rehabilitation Engineering · doi:10.1109/tnsre.2022.3197993 · Cited by 17
Yu, Y., Kruyff, D., Jiao, J., Becker, T., & Behrisch, M. (2022) · IEEE Transactions on Visualization and Computer Graphics · doi:10.1109/tvcg.2022.3209431 · Cited by 17
In-situ animal behavior classification using knowledge distillation and fixed-point quantization
Arablouei, R., Wang, L., Phillips, C., Currie, L., Yates, J., & Bishop-Hurley, G. J. (2022) · Smart Agricultural Technology · doi:10.1016/j.atech.2022.100159 · Cited by 17
Zhang, H., Li, T., Jing, A., & Yang, S. (2024) · Advanced Engineering Informatics · doi:10.1016/j.aei.2024.102976 · Cited by 16
Qi, Z., Wang, Y., Liu, Z., Chao, Z., Dong, Z., & Wang, H. (2026) · Engineering Applications of Artificial Intelligence · doi:10.1016/j.engappai.2026.113789 · Cited by 16
Liang, Z., & Wang, H. (2022) · Proceedings of the VLDB Endowment · doi:10.14778/3554821.3554875 · Cited by 16
Scalable classifier-agnostic channel selection for multivariate time series classification
Dhariyal, B., Nguyen, T. L., & Ifrim, G. (2023) · Data Mining and Knowledge Discovery · doi:10.1007/s10618-022-00909-1 · Cited by 16
Nizovtseva, I. G., Palmin, V., Simkin, I. V., Стародумов, И. О., Mikushin, P., Nozik, A., Khamitov, T., Ivanov, S., Vikharev, S., Zinovev, A., et al. (2023) · Algorithms · doi:10.3390/a16030125 · Cited by 16
Tian, X., Bai, Y., Li, G., Yang, X., Huang, J., & Chen, Z. (2023) · Remote Sensing · doi:10.3390/rs15081990 · Cited by 16
Machine-Learning-Based Fault Detection in Electric Vehicle Powertrains Using a Digital Twin
Dettinger, F., Jazdi, N., Weyrich, M., Brandl, L., Reuss, H.-C., Pecha, U., Parspour, N., Li, S., Frey, M., Gauterin, F., et al. (2023) · SAE technical papers on CD-ROM/SAE technical paper series · doi:10.4271/2023-01-1214 · Cited by 16
An exhaustive comparison of distance measures in the classification of time series with 1NN method
Górecki, T., Łuczak, M., & Piasecki, P. (2024) · Journal of Computational Science · doi:10.1016/j.jocs.2024.102235 · Cited by 16
CCAnalyzer: An Efficient and Nearly-Passive Congestion Control Classifier
Ware, R., Philip, A. A., Hungria, N., Kothari, Y., Sherry, J., & Seshan, S. (2024) · ACM SIGCOMM Conference (SIGCOMM) · doi:10.1145/3651890.3672255 · Cited by 16
AI-driven Java Performance Testing: Balancing Result Quality with Testing Time
Traini, L., Menna, F. D., & Cortellessa, V. (2024) · IEEE/ACM International Conference on Automated Software Engineering (ASE) · doi:10.1145/3691620.3695017 · Cited by 18
Framework for traffic event detection using Shapelet Transform
Al-Dhanhani, A., Damiani, E., Mizouni, R., & Wang, D. (2019) · Engineering Applications of Artificial Intelligence · doi:10.1016/j.engappai.2019.04.002 · Cited by 16
A flight maneuver recognition method based on multi-strategy affine canonical time warping
Wei, Z., Ding, D., Zhou, H., Zhang, Z., Xie, L., & Wang, L. (2020) · Applied Soft Computing · doi:10.1016/j.asoc.2020.106527 · Cited by 16
Time Series Averaging Using Multi-Tasking Autoencoder
Debella, T. T., Devanne, M., Weber, J., Hailemariam, D., & Forestier, G. (2020) · IEEE International Conference on Tools with Artificial Intelligence (ICTAI) · doi:10.1109/ictai50040.2020.00163 · Cited by 16
Coevolution of remaining useful lifetime estimation pipelines for automated predictive maintenance
Tornede, T., Tornede, A., Wever, M., & Hüllermeier, E. (2021) · Genetic and Evolutionary Computation Conference (GECCO) · doi:10.1145/3449639.3459395 · Cited by 16
Random pairwise shapelets forest: an effective classifier for time series
Yuan, J., Shi, M., Wang, Z., Liu, H., & Li, J. (2022) · Knowledge and Information Systems · doi:10.1007/s10115-021-01630-z · Cited by 16
Time series-based detection and impact analysis of firmware attacks in microgrids
Zografopoulos, I., Kuruvila, A. P., Basu, K., & Konstantinou, C. (2022) · Energy Reports · doi:10.1016/j.egyr.2022.08.270 · Cited by 16
Grasp heuristic for time series compression with piecewise aggregate approximation
Fotso, V. S. S., Nguifo, E. M., & Vaslin, P. (2018) · RAIRO - Operations Research · doi:10.1051/ro/2018089 · Cited by 16
Time Series Similarity Measure via Siamese Convolutional Neural Network
Hou, L., Jin, X., & Zhao, Z. (2019) · International Congress on Image and Signal Processing (CISP) · doi:10.1109/cisp-bmei48845.2019.8966048 · Cited by 15
Gundersen, K., Alendal, G., Oleynik, A., & Blaser, N. (2020) · Algorithms · doi:10.3390/a13060145 · Cited by 15
Fahle, S., Gläser, T., Kneissler, A., & Kuhlenkötter, B. (2021) · Production Engineering · doi:10.1007/s11740-021-01075-x · Cited by 15
Tahan, M. H., Ghasemzadeh, M., & Asadi, S. (2022) · IEEE Transactions on Industrial Informatics · doi:10.1109/tii.2022.3188839 · Cited by 15
Hybrid static-sensory data modeling for prediction tasks in basic oxygen furnace process
Sala, D. A., Deyne, A. V. Y.-D., Mannens, E., & Jalalvand, A. (2022) · Applied Intelligence · doi:10.1007/s10489-022-04293-7 · Cited by 16
Sung, Y., Lim, H. G., Kim, J. K., Won, J., & Choi, H. (2023) · CATENA · doi:10.1016/j.catena.2023.107639 · Cited by 15
He, C., Huo, X., Jiang, Y., & Zhu, C. (2025) · IEEE Transactions on Systems Man and Cybernetics Systems · doi:10.1109/tsmc.2025.3548662 · Cited by 15
Can the global modeling technique be used for crop classification?
Mangiarotti, S., Sharma, A. K., Corgne, S., Hubert‐Moy, L., Ruiz, L., Sekhar, M., & Kerr, Y. H. (2017) · Chaos Solitons & Fractals · doi:10.1016/j.chaos.2017.12.003 · Cited by 15
A Comprehensive Comparison of Distance Measures for Time Series Classification
Górecki, T., & Piasecki, P. (2019) · Springer proceedings in mathematics & statistics · doi:10.1007/978-3-030-28665-1_31 · Cited by 15
A Feature Selection Method for Multi-dimension Time-Series Data
Kathirgamanathan, B., & Cunningham, P. (2020) · Lecture notes in computer science · doi:10.1007/978-3-030-65742-0_15 · Cited by 15
Frizzarin, M., Bevilacqua, A., Dhariyal, B., Domijan, K., Ferraccioli, F., Hayes, E., Ifrim, G., Konkolewska, A., Nguyen, T. L., Mbaka, U., et al. (2021) · Chemometrics and Intelligent Laboratory Systems · doi:10.1016/j.chemolab.2021.104442 · Cited by 15
Salience-CAM: Visual Explanations from Convolutional Neural Networks via Salience Score
Zhou, L., Ma, C., Shi, X., Zhang, D., Li, W., & Wu, L. (2021) · International Joint Conference on Neural Networks (IJCNN) · doi:10.1109/ijcnn52387.2021.9534419 · Cited by 15
Parmezan, A. R. S., Souza, V. M. A., & Batista, G. E. A. P. A. (2022) · IEEE Access · doi:10.1109/access.2022.3192849 · Cited by 15
Proximity forest 2.0: a new effective and scalable similarity-based classifier for time series
Tan, C. W., Herrmann, M., Salehi, M., & Webb, G. I. (2025) · Data Mining and Knowledge Discovery · doi:10.1007/s10618-024-01085-0 · Cited by 15
Incremental and Adaptive Feature Exploration over Time Series Stream
Zuo, J., Zeitouni, K., & Taher, Y. (2019) · IEEE International Conference on Big Data (BigData) · doi:10.1109/bigdata47090.2019.9005660 · Cited by 15
Janyalikit, T., & Ratanamahatana, C. A. (2022) · IEEE Access · doi:10.1109/access.2022.3167703 · Cited by 14
Multichannel convolution neural network for gas mixture classification
Oh, Y., Lim, C., Lee, J., Kim, S., & Kim, S. (2022) · Annals of Operations Research · doi:10.1007/s10479-022-04715-2 · Cited by 14
IPS: Instance Profile for Shapelet Discovery for Time Series Classification
Li, G., Choi, B. K. K., Xu, J., Bhowmick, S. S., Mah, D. N., & Wong, G. L. H. (2022) · IEEE International Conference on Data Engineering (ICDE) · doi:10.1109/icde53745.2022.00179 · Cited by 14
Qiu, X., Shi, S., Tan, X., Qu, C. Y., Fang, Z., Wang, H., Gao, Y., Wu, P., & Li, H. (2023) · IEEE/CVF International Conference on Computer Vision (ICCV) · doi:10.1109/iccv51070.2023.01951 · Cited by 14
Chen, S., Sun, W., Huang, L., Li, X. P., Wang, Q., & John, D. (2024) · Knowledge-Based Systems · doi:10.1016/j.knosys.2024.112253 · Cited by 14
Convolutional- and Deep Learning-Based Techniques for Time Series Ordinal Classification
Ayllón-Gavilán, R., Guijo-Rubio, D., Gutiérrez, P. A., Bagnall, A. J., & Hervás‐Martínez, C. (2024) · IEEE Transactions on Cybernetics · doi:10.1109/tcyb.2024.3498100 · Cited by 14
Self-citationTowards Multi-resolution Spatiotemporal Graph Learning for Medical Time Series Classification
Fan, W., Fei, J., Guo, D., Yi, K., Song, X., Xiang, H., Ye, H., & Li, M. (2025) · International World Wide Web Conference (WWW) · doi:10.1145/3696410.3714514 · Cited by 14
Making the dynamic time warping distance warping-invariant
Jain, B. J. (2019) · Pattern Recognition · doi:10.1016/j.patcog.2019.05.016 · Cited by 14
Khodnenko, I., Ivanov, S. V., Perets, D. S., & Simonov, M. (2019) · Procedia Computer Science · doi:10.1016/j.procs.2019.08.206 · Cited by 14
Self-learning of multivariate time series using perceptually important points
Lintonen, T., & Räty, T. (2019) · IEEE/CAA Journal of Automatica Sinica · doi:10.1109/jas.2019.1911777 · Cited by 14
Constrained Distance-Based Clustering for Satellite Image Time-Series
Lampert, T. A., Lafabrègue, B., Dao, T.-B.-H., Serrette, N., Vrain, C., & Gançarski, P. (2019) · IEEE Journal of Selected Topics in Applied Earth Observations and Remote Sensing · doi:10.1109/jstars.2019.2950406 · Cited by 14
Automatic Detection of Manufacturing Equipment Cycles Using Time Series
Seevers, J.-P., Jurczyk, K., Meschede, H., Hesselbach, J., & Sutherland, J. W. (2020) · Journal of Computing and Information Science in Engineering · doi:10.1115/1.4046208 · Cited by 14
Cuesta–Frau, D. (2020) · Entropy · doi:10.3390/e22050494 · Cited by 14
An empirical evaluation of kernels for time series
Badiane, M., & Cunningham, P. (2021) · Artificial Intelligence Review · doi:10.1007/s10462-021-10050-y · Cited by 14
Shape-Sphere: A metric space for analysing time series by their shape
Kowsar, Y., Moshtaghi, M., Velloso, E., Bezdek, J. C., Kulik, L., & Leckie, C. A. (2021) · Information Sciences · doi:10.1016/j.ins.2021.08.101 · Cited by 14
Benefit-aware early prediction of health outcomes on multivariate EEG time series
Shekhar, S., Eswaran, D., Hooi, B., Elmer, J., Faloutsos, C., & Akoglu, L. (2023) · Journal of Biomedical Informatics · doi:10.1016/j.jbi.2023.104296 · Cited by 16
Time series classifier recommendation by a meta-learning approach
Abanda, A., Mori, U., & Lozano, J. A. (2022) · Pattern Recognition · doi:10.1016/j.patcog.2022.108671 · Cited by 14
KDCTime: Knowledge distillation with calibration on InceptionTime for time-series classification
Gong, X., Si, Y., Tian, Y., Lin, C., Zhang, X., & Liu, X. (2022) · Information Sciences · doi:10.1016/j.ins.2022.08.057 · Cited by 14
Adaptive similarity search for the retrieval of rare events from large time series databases
Schlegl, T., Schlegl, S., Tomaselli, D., West, N., & Deuse, J. (2022) · Advanced Engineering Informatics · doi:10.1016/j.aei.2022.101629 · Cited by 14
Zhou, Y., Xu, K., He, F., & Zhang, Z. (2022) · Journal of the Taiwan Institute of Chemical Engineers · doi:10.1016/j.jtice.2022.104445 · Cited by 14
Portaz, M., Corbí, A., Casas-Ortiz, A., & Santos, O. C. (2024) · User Modeling and User-Adapted Interaction · doi:10.1007/s11257-024-09393-2 · Cited by 14
PLATYPUS: A Multiple—View Learning Predictive Framework for Cancer Drug Sensitivity Prediction
Graim, K. S., Friedl, V., Houlahan, K. E., & Stuart, J. M. (2018) · Pacific Symposium on Biocomputing (PSB) · doi:10.1142/9789813279827_0013 · Cited by 14
Li, H., Lin, C., Wan, X., & Li, Z. (2019) · IEEE Access · doi:10.1109/access.2019.2915602 · Cited by 14
Cuesta–Frau, D., Molina, Á., Vargas, B., & González, P. (2019) · Entropy · doi:10.3390/e21101013 · Cited by 14
DriverRep: Driver identification through driving behavior embeddings
Azadani, M. N., & Boukerche, A. (2022) · Journal of Parallel and Distributed Computing · doi:10.1016/j.jpdc.2022.01.010 · Cited by 14
COBRASTS: A New Approach to Semi-supervised Clustering of Time Series
Craenendonck, T. V., Meert, W., Dumančić, S., & Blockeel, H. (2018) · Lecture notes in computer science · doi:10.1007/978-3-030-01771-2_12 · Cited by 14
XAI Methods for Neural Time Series Classification: A Brief ReviewPreprint
Šimić, I., Sabol, V., & Veas, E. E. (2021) · arXiv (Cornell University) · doi:10.48550/arxiv.2108.08009 · Cited by 23
Wang, Z., Cui, Q., Gong, Z., Shi, L., Gao, J., & Zhong, J. (2024) · Processes · doi:10.3390/pr12040690 · Cited by 13
Abbasi, M., & Saeedi, P. (2024) · IEEE Access · doi:10.1109/access.2024.3397783 · Cited by 13
Deep learning in standard least-squares theory of linear models: Perspective, development and vision
Amiri-Simkooei, A., Tiberius, C. C. J. M., & Lindenbergh, R. (2024) · Engineering Applications of Artificial Intelligence · doi:10.1016/j.engappai.2024.109376 · Cited by 13
Extracting interpretable signatures of whole-brain dynamics through systematic comparison
Bryant, A. G., Aquino, K. M., Parkes, L., Fornito, A., & Fulcher, B. (2024) · PLoS Computational Biology · doi:10.1371/journal.pcbi.1012692 · Cited by 13
King, T., Zhou, Y., Röddiger, T., & Beigl, M. (2025) · Scientific Reports · doi:10.1038/s41598-025-90764-z · Cited by 17
A multi-breakpoints approach for symbolic discretization of time series
Márquez-Grajales, A., Acosta‐Mesa, H., Mezura‐Montes, E., & Graff, M. (2020) · Knowledge and Information Systems · doi:10.1007/s10115-020-01437-4 · Cited by 13
An Approach to Time Series Classification Using Binary Distribution Tree
Ma, C., Shi, X., Zhu, W., Li, W., Cui, X., & Gui, H. (2019) · International Conference on Mobile Ad-Hoc and Sensor Networks (MSN) · doi:10.1109/msn48538.2019.00082 · Cited by 13
Oregi, I., Ser, J. D., Pérez, A., & Lozano, J. A. (2020) · Neural Networks · doi:10.1016/j.neunet.2020.04.030 · Cited by 13
Medico, R., Ruyssinck, J., Deschrijver, D., & Dhaene, T. (2021) · Advances in Data Analysis and Classification · doi:10.1007/s11634-021-00437-8 · Cited by 13
Time Series Classification via Enhanced Temporal Representation Learning
Wang, K., Wang, C., Wang, Y., Luo, W., Zhan, P., Hu, Y., & Li, X. (2021) · IEEE International Conference on Big Data Analytics (ICBDA) · doi:10.1109/icbda51983.2021.9403177 · Cited by 13
Explainable Credit Card Fraud Detection with Image Conversion
Terzi, D. S., Demi̇rezen, M. U., & Sağıroğlu, Ş. (2021) · ADCAIJ ADVANCES IN DISTRIBUTED COMPUTING AND ARTIFICIAL INTELLIGENCE JOURNAL · doi:10.14201/adcaij20211016376 · Cited by 13
Deep-STaR: Classification of image time series based on spatio-temporal representations
Chelali, M., Kurtz, C., Puissant, A., & Vincent, N. (2021) · Computer Vision and Image Understanding · doi:10.1016/j.cviu.2021.103221 · Cited by 13
Wedler, M., Stender, M., Klein, M., Ehlers, S., & Hoffmann, N. (2022) · Neural Networks · doi:10.1016/j.neunet.2022.09.023 · Cited by 16
Tahkola, M., & Guangrong, Z. (2022) · IEEE Access · doi:10.1109/access.2022.3166525 · Cited by 15
Dimensionality reduction and ensemble of LSTMs for antimicrobial resistance prediction
Carnerero, À. H., Sànchez–Marrè, M., Mora-Jiménez, I., Soguero-Ruíz, C., Martínez-Agüero, S., & Álvarez-Rodríguez, J. (2023) · Artificial Intelligence in Medicine · doi:10.1016/j.artmed.2023.102508 · Cited by 14
Time Series Data Mining for Sport Data: a Review
Komitova, R., Raabe, D., Rein, R., & Memmert, D. (2022) · Int. J. Comput. Sci. Sport · doi:10.2478/ijcss-2022-0008 · Cited by 13
Identifying bird species by their calls in Soundscapes
Maclean, K., & Triguero, I. (2023) · Applied Intelligence · doi:10.1007/s10489-023-04486-8 · Cited by 13
A New Method of Time-Series Event Prediction Based on Sequence Labeling
Zhong, Z., Lv, S., & Shi, K. (2023) · Applied Sciences · doi:10.3390/app13095329 · Cited by 13
Back to Basics: A Sanity Check on Modern Time Series Classification Algorithms
Dhariyal, B., Nguyen, T. L., & Ifrim, G. (2023) · Lecture notes in computer science · doi:10.1007/978-3-031-49896-1_14 · Cited by 13
AMIE: Automatic Monitoring of Indoor Exercises
Decroos, T., Schütte, K., Beéck, T. O. D., Vanwanseele, B., & Davis, J. J. (2019) · Lecture notes in computer science · doi:10.1007/978-3-030-10997-4_26 · Cited by 13
Identification and micro-motion parameter estimation of non-cooperative UAV targets
Yang, J., Zhang, Z., Mao, W., & Yue, Y. (2021) · Physical Communication · doi:10.1016/j.phycom.2021.101314 · Cited by 13
Learning Interpretable Shapelets for Time Series Classification through Adversarial RegularizationPreprint
Wang, Y., Emonet, R., Fromont, É., Malinowski, S., Ménager, E., Mosser, L., & Tavenard, R. (2019) · arXiv (Cornell University) · doi:10.48550/arxiv.1906.00917 · Cited by 13
Benchmarking time series classification -- Functional data vs machine learning approachesPreprint
Pfisterer, F., Beggel, L., Sun, X., Scheipl, F., & Bischl, B. (2019) · arXiv (Cornell University) · doi:10.48550/arxiv.1911.07511 · Cited by 18
Active Feature Acquisition with Generative Surrogate ModelsPreprint
Li, Y., & Oliva, J. B. (2020) · arXiv (Cornell University) · doi:10.48550/arxiv.2010.02433 · Cited by 13
MrSQM: Fast Time Series Classification with Symbolic RepresentationsPreprint
Nguyen, T. L., & Ifrim, G. (2021) · arXiv (Cornell University) · doi:10.48550/arxiv.2109.01036 · Cited by 13
Prototype Learning for Medical Time Series Classification via Human–Machine Collaboration
Xie, J., Wang, Z., Yu, Z., Ding, Y., & Guo, B. (2024) · Sensors · doi:10.3390/s24082655 · Cited by 12
Fast, Interpretable, and Deterministic Time Series Classification With a Bag-of-Receptive-Fields
Spinnato, F., Guidotti, R., Monreale, A., & Nanni, M. (2024) · IEEE Access · doi:10.1109/access.2024.3464743 · Cited by 12
Unsupervised clustering of longitudinal clinical measurements in electronic health records
Mariam, A., Javidi, H., Zabor, E. C., Zhao, R., Radivoyevitch, T., & Rotroff, D. M. (2024) · PLOS Digital Health · doi:10.1371/journal.pdig.0000628 · Cited by 12
SPARTAN: Data-Adaptive Symbolic Time-Series Approximation
Yang, F., & Paparrizos, J. (2025) · Proceedings of the ACM on Management of Data · doi:10.1145/3725357 · Cited by 15
TrSAX—An improved time series symbolic representation for classification
Ruan, H., Hu, X., Xiao, J., & Zhang, G. (2019) · ISA Transactions · doi:10.1016/j.isatra.2019.11.018 · Cited by 12
Deep Neural Networks for the Classification of Pure and Impure Strawberry Purees
Zheng, Z., Zhang, X., Yu, J., Guo, R., & Zhangzhong, L. (2020) · Sensors · doi:10.3390/s20041223 · Cited by 12
Analysing Head-Thorax Choreography During Free-Flights in Bumblebees
Odenthal, L., Doussot, C., Meyer, S., & Bertrand, O. J. N. (2021) · Frontiers in Behavioral Neuroscience · doi:10.3389/fnbeh.2020.610029 · Cited by 12
A Systematic Review of Packages for Time Series Analysis
Siebert, J., Groß, J., & Schroth, C. (2021) · International Conference on Time Series and Forecasting (ITISE) · doi:10.3390/engproc2021005022 · Cited by 12
Fast Channel Selection for Scalable Multivariate Time Series Classification
Dhariyal, B., Nguyen, T. L., & Ifrim, G. (2021) · Lecture notes in computer science · doi:10.1007/978-3-030-91445-5_3 · Cited by 12
A k-means method for trends of time series
Watanabe, N. (2022) · Japanese Journal of Statistics and Data Science · doi:10.1007/s42081-022-00148-0 · Cited by 12
Time Series Classification with Shapelet and Canonical Features
Liu, H., Gao, Z.-Z., Wang, Z., & Deng, Y.-H. (2022) · Applied Sciences · doi:10.3390/app12178685 · Cited by 12
Metadata
- Authors
- Bagnall, A., Lines, J., Bostrom, A., Large, J., & Keogh, E.
- Affiliations
- University of East Anglia (GB)
- University of California, Riverside (US)
- Corresponding author
- Bagnall, Anthony
- Venue
- Data Mining and Knowledge Discovery
- Published
- 2016-11-23
- Volume
- 31
- Issue
- 3
- Pages
- 606-660
- ISSN
- 1384-5810 (ISSN-L)
- 1573-756X
- PMC
- PMC6404674
- OpenAlex
- W2555077524
- Cited by
- 1,377
- References
- 48
- Citations by year
- 2026: 90 · 2025: 133 · 2024: 166 · 2023: 185 · 2022: 187 · 2021: 195 · 2020: 199 · 2019: 130 · 2018: 69 · 2017: 21 · 2016: 1
- FWCI
- 81.75
- Type
- journal article
- Language
- en
- Open access
- hybrid
- doi.org
- Licence
- Locations
- Data Mining and Knowledge Discovery (publishedVersion, cc-by)
- Europe PMC (PubMed Central) (publishedVersion, other-oa)
- PubMed Central (publishedVersion, cc-by)
- PubMed (publishedVersion)
- UEA Digital Repository (University of East Anglia) (submittedVersion, cc-by)
- eScholarship (California Digital Library) (submittedVersion)
- eScholarship (California Digital Library) (submittedVersion, cc-by)
- Funders
- Engineering and Physical Sciences Research Council (EP/M015087/1)
- Topics
- Physical Sciences › Computer Science › Signal Processing › Time Series Analysis and Forecasting
- Physical Sciences › Computer Science › Signal Processing › Music and Audio Processing
- Physical Sciences › Computer Science › Computer Vision and Pattern Recognition › Image Retrieval and Classification Techniques
- Keywords
- time series classification, benchmark dataset, algorithm comparison, classification accuracy, reproducibility, Java implementation
About these checks
Registry, retraction, Cites and statistics results are computed, not judged, with one exception: a printed reference that no index lists is read once by a model before it counts as a citation error. Claims are extracted by a model and kept only when their quote appears verbatim in the text; each cited source is then checked, with a model’s help, for whether it says what the claim relies on. Those verdicts can be wrong — read the claim’s quote and the cited source before relying on one.
Statistics and arithmetic are recomputed, not judged.
Confidence bands are shown only for fields calibrated on our annotated test set. None is calibrated yet, so no band is shown.
What counts as a claim ›How we measure confidence ›How we check this ›
Are you an author, or do you see a problem with this page? Request a review
