

The DOI matches its Crossref record; 72 of the 72 references it cites were found in a registry or an index.
Numerical Solution of the Parametric Diffusion Equation by Deep Neural Networks
Abstract
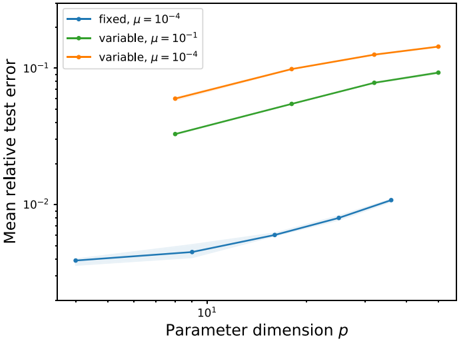
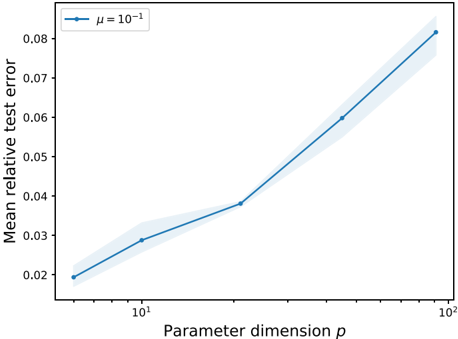
We perform a comprehensive numerical study of the effect of approximation-theoretical results for neural networks on practical learning problems in the context of numerical analysis. As the underlying model, we study the machine-learning-based solution of parametric partial differential equations. Here, approximation theory for fully-connected neural networks predicts that the performance of the model should depend only very mildly on the dimension of the parameter space and is determined by the intrinsic dimension of the solution manifold of the parametric partial differential equation. We use various methods to establish comparability between test-cases by minimizing the effect of the choice of test-cases on the optimization and sampling aspects of the learning problem. We find strong support for the hypothesis that approximation-theoretical effects heavily influence the practical behavior of learning problems in numerical analysis. Turning to practically more successful and modern architectures, at the end of this study we derive improved error bounds by focusing on convolutional neural networks.
Overview
The claims and statistics of this paper haven’t been checked yet.
Run the check — free, no account needed. It reads the open-access text and checks the sources it cites.
Integrity signals
Registry
Cites
Statistics
Figures
Verification
Claims the paper makes
The claims and statistics of this paper haven’t been checked yet.
Run the check — free, no account needed. It reads the open-access text and checks the sources it cites.
Claims other papers make about this one
Each is checked against this paper’s own text: does it say what the citing paper says it does?
In the citing paper
“Incorporating the current 2σ bound on the tensor/scalar ratio r [75, 76] requires roughly H/M P < 10 -7 .”
From Hyperbolic compactification of M-theory and de Sitter quantum gravity (2022) · cites this paper as [76]
Self-check
Percentages, sums and reported differences re-computed from the paper’s own numbers.
The self-check needs the paper’s full text.
Citations
Cites
Adam: A Method for Stochastic Optimization
Kingma, D. P., & Ba, J. (2014) · arXiv · doi:10.48550/arxiv.1412.6980 · Cited by 98,946
Gradient-based learning applied to document recognition
Lecun, Y., Bottou, L., Bengio, Y., & Haffner, P. (1998) · Proceedings of the IEEE · doi:10.1109/5.726791 · Cited by 58,805
Universal approximation bounds for superpositions of a sigmoidal function
Barron, A. R. (1993) · IEEE Transactions on Information Theory · doi:10.1109/18.256500 · Cited by 2,804
DeepXDE: A Deep Learning Library for Solving Differential Equations
Lu, L., Meng, X., Mao, Z., & Karniadakis, G. E. (2021) · SIAM Review · doi:10.1137/19m1274067 · Cited by 2,512
Artificial neural networks for solving ordinary and partial differential equations
Lagaris, I. E., Likas, A., & Fotiadis, D. I. (1998) · IEEE Transactions on Neural Networks · doi:10.1109/72.712178 · Cited by 2,412
SchNet – A deep learning architecture for molecules and materials
Schütt, K. T., Sauceda, H. E., Kindermans, P.-J., Tkatchenko, A., & Müller, K.-R. (2018) · The Journal of Chemical Physics · doi:10.1063/1.5019779 · Cited by 2,217
DGM: A deep learning algorithm for solving partial differential equations
Sirignano, J., & Spiliopoulos, K. (2018) · Journal of Computational Physics · doi:10.1016/j.jcp.2018.08.029 · Cited by 2,208
Samaniego, E., Anitescu, C., Goswami, S., Nguyen-Thanh, V. M., Guo, H., Hamdia, K., Zhuang, X., & Rabczuk, T. (2020) · Computer Methods in Applied Mechanics and Engineering · doi:10.1016/j.cma.2019.112790 · Cited by 2,104
The FEniCS Project Version 1.5
Alnæs, M. S., Blechta, J., Hake, J. E., Johansson, A., Kehlet, B., Logg, A., Richardson, C., Ring, J., Rognes, M. E., & Wells, G. N. (2015) · Department of Earth Sciences EPrints Repository · doi:10.11588/ans.2015.100.20553 · Cited by 1,877
Solving high-dimensional partial differential equations using deep learning
Han, J., Jentzen, A., & E, W. (2018) · Proceedings of the National Academy of Sciences · doi:10.1073/pnas.1718942115 · Cited by 1,722
Research works printed but not linked: 8
- Adcock, B., Brugiapaglia, S., Dexter, N., Moraga, S.: Deep neural networks are effective at learning high-dimensional Hilbert-valued functions from limited data. arXiv preprint arXiv:2012.06081 (2020) · arXiv
- Berner, J., Grohs, P., Jentzen, A.: Analysis of the generalization error: empirical risk minimization over deep artificial neural networks overcomes the curse of dimensionality in the numerical approximation of Black-Scholes partial differential equations. arXiv preprint arXiv:1809.03062 (2018) · arXiv
- Bhattacharya, K., Hosseini, B., Kovachki, N.B., Stuart, A.M.: Model reduction and neural networks for parametric PDEs. arXiv preprintarXiv:2005.03180 (2020)
- Brevis, I., Muga, I., van der Zee, K.G.: Data-driven finite elements methods: machine learning acceleration of goal-oriented computations. arXiv preprint arXiv:2003.04485 (2020) · arXiv
- Jentzen, A., Salimova, D., Welti, T.: A proof that deep artificial neural networks overcome the curse of dimensionality in the numerical approximation of Kolmogorov partial differential equations with constant diffusion and nonlinear drift coefficients. arXiv preprintarXiv:1809.07321 (2018)
- Khoo, Y., Lu, J., Ying, L.: Solving parametric PDE problems with artificial neural networks. arXiv preprint arXiv:1707.03351 (2017) · arXiv
- Marcati, C., Opschoor, J.A., Petersen, P.C., Schwab, C.: Exponential relu neural network approximation rates for point and edge singularities. arXiv preprint arXiv:2010.12217 (2020) · arXiv
- Raissi, M., Perdikaris, P., Karniadakis, G.E.: Physics informed deep learning (part ii): data-driven discovery of nonlinear partial differential equations. arxiv. arXiv preprint arXiv:1711.10561, (2017) · arXiv
Cited by
Hyperbolic compactification of M-theory and de Sitter quantum gravity
De Luca, G. B., Silverstein, E., & Torroba, G. (2022) · SciPost Physics · doi:10.21468/scipostphys.12.3.083 · Cited by 39
Metadata
- Authors
- Geist, M., Petersen, P., Raslan, M., Schneider, R., & Kutyniok, G.
- Venue
- Journal of Scientific Computing
- Published
- 2021-06-05
- Volume
- 88
- Issue
- 1
- ISSN
- 0885-7474
- 1573-7691
- Cited by
- 57
- References
- 72
- Language
- en
- Licence
- creativecommons.org/licenses/by/4.0 (tdm)
- creativecommons.org/licenses/by/4.0 (vor)
- Funders
- University of Vienna
About these checks
Registry, retraction, Cites and statistics results are computed, not judged, with one exception: a printed reference that no index lists is read once by a model before it counts as a citation error. Claims are extracted by a model and kept only when their quote appears verbatim in the text; each cited source is then checked, with a model’s help, for whether it says what the claim relies on. Those verdicts can be wrong — read the claim’s quote and the cited source before relying on one.
Statistics and arithmetic are recomputed, not judged.
Confidence bands are shown only for fields calibrated on our annotated test set. None is calibrated yet, so no band is shown.
What counts as a claim ›How we measure confidence ›How we check this ›
Are you an author, or do you see a problem with this page? Request a review
Data sources
Bibliographic data: Semantic Scholar, OpenAlex, Crossref.
Contains information from the Semantic Scholar Academic Graph Datasets, made available under the ODC Attribution License (ODC-BY 1.0).
Semantic Scholar’s data is described in: Kinney, R., et al. (2023). The Semantic Scholar Open Data Platform. arXiv:2301.10140.
