

The DOI matches its Crossref record; 2 of the 2 references it cites were found in a registry or an index.
Variations in population vulnerability to tectonic and landslide-related tsunami hazards in Alaska
Overview
The claims and statistics of this paper haven’t been checked yet.
Run the check — free, no account needed. It reads the open-access text and checks the sources it cites.
Integrity signals
Registry
Cites
Statistics
Figures
Verification
Claims the paper makes
The claims and statistics of this paper haven’t been checked yet.
Run the check — free, no account needed. It reads the open-access text and checks the sources it cites.
Claims other papers make about this one
Each is checked against this paper’s own text: does it say what the citing paper says it does?
In the citing paper
“Therefore, most LCD studies suggested a slow walk speed of evacuees for the mixed population (age, health, gender, physical mobility, etc.) (Wood and Schmidtlein 2012, 2013; Wood and Peters 2015).”
From Pedestrian evacuation time calculation against tsunami hazard for southern coasts of bodrum peninsula (2023) · cites this paper as Wood and Peters 2015
In the citing paper
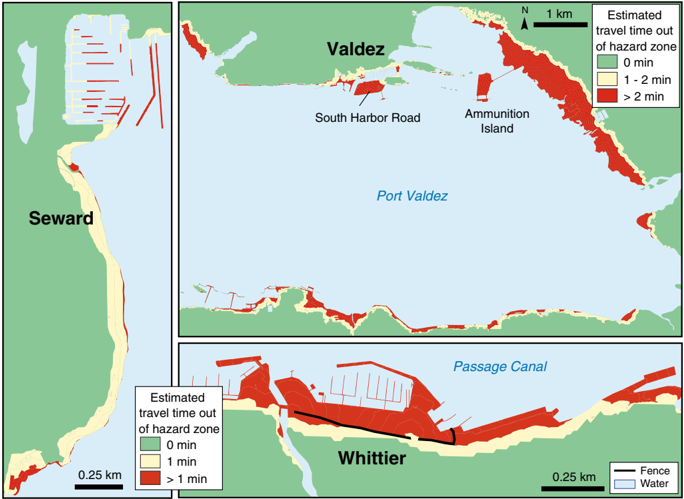
“The routes in docks and breakwaters are where evacuations are di cult since there is only one narrow path to reach the safe zone (Wood and Peters 2015).”
From Pedestrian evacuation time calculation against tsunami hazard for southern coasts of bodrum peninsula (2023) · cites this paper as Wood and Peters 2015
Self-check
Percentages, sums and reported differences re-computed from the paper’s own numbers.
The self-check needs the paper’s full text.
Citations
Cites
Terrain coefficients for energy cost prediction.
Soule, R. G., & Goldman, R. F. (1972) · Journal of Applied Physiology · doi:10.1152/jappl.1972.32.5.706 · Cited by 202
Wood, N. J., & Schmidtlein, M. C. (2012) · Natural Hazards · doi:10.1007/s11069-011-9994-2 · Cited by 133
Self-citation
Research works printed but not linked: 23
- Coulter H, Migliaccio R (1966) Effects of the earthquake of March 27, 1964 at Valdez, Alaska. U.S. Geological Survey Professional Paper 542-C. United States Government Printing Office, Washington, DC · DOI
- Freire S, Aubrecht C, Wegscheider S (2013) Advancing tsunami risk assessment by improving spatio-temporal population exposure and evacuation modeling. Nat Hazards 68:1311–1324 · DOI
- Grantz A, Plafker G, Kachadoorian R (1964) Alaska’s Good Friday Earthquake, March 27, 1964, a preliminary geologic evaluation, Geological Survey Circular 491, United States Government Printing Office, Washington, DC · DOI
- Hansen W, Eckel E, Schaem W, Lyle R, George W, Chance G (1966) The Alaska Earthquake March 27, 1964—field investigations and reconstruction effort, U.S. Geological Survey Professional Paper 541. United States Government Printing Office, Washington, DC · DOI
- Hubbard T, Wolken G, Stevens D, Combellick R (2013) High-resolution lidar data for the Whittier area, Passage Canal, and Portage Lake, Alaska, in DGGS Staff, LiDAR Datasets of Alaska. Alaska Division of Geological & Geophysical Surveys Raw Data File 2013-3, 5 p. doi: 10.14509/24976 · DOI
- Jonkmann S, Vrijling J, Vrouwenvelder A (2008) Methods for the estimation of loss of life due to floods: a literature review and a proposal for a new method. Nat Hazards 46:353–389 · DOI
- Lemke R (1967) Effects of the earthquake of March 27, 1964, at Seward, Alaska. Geological Survey Professional Paper 542-E. United States Government Printing Office, Washington, DC · DOI
- Lovholt F, Glimsdal S, Harbitz C, Zamora N, Nadim F, Peduzzi P, Dao H, Smebye H (2012) Tsunami hazard and exposure on the global scale. Earth Sci Rev 110(1–4):58–73 · DOI
- National Research Council (2011) Tsunami warning and preparedness: an assessment of the US Tsunami Program and the Nation’s preparedness efforts, Committee on the review of the tsunami warning and forecast system and overview of the nation’s tsunami preparedness. The National Academies Press, Washington, DC
- Nicolsky D, Suleimani E, Combellick R, Hansen R (2011) Tsunami inundation maps of Whittier and western Passage Canal, Alaska. Alaska Division of Geological & Geophysical Surveys Report of Investigation 2011-7, 65 p · DOI
- Nicolsky D, Suleimani E, Haeussler P, Ryan H, Koehler R, Combellick R, Hansen R (2013) Tsunami inundation maps of Port Valdez, Alaska. Alaska Division of Geological & Geophysical Surveys Report of Investigation 2013-1, 77 p, 1 sheet, scale 1:12,500 · DOI
- Nicolsky D, Suleimani E, Koehler R (2014) Tsunami inundation maps of Cordova and Tatitlek, Alaska. Alaska Division of Geological & Geophysical Surveys Report of Investigation 2014-1, 49 p · DOI
- Park S, van de Lindt J, Gupta R, Cox D (2012) Method to determine the locations of tsunami vertical evacuation shelters. Nat Hazard 63:891–908 · DOI
- Post J, Wegscheider S, Muck M, Zosseder K, Kiefl R, Steinmetz T, Strunz G (2009) Assessment of human immediate response capability related to tsunami threats in Indonesia at a sub-national scale. Nat Hazards Earth Syst Sci 9:1075–1086 · DOI · Paper page
- Rogers G (1970) Economic effects of the earthquake. The great Alaska earthquake of 1964—human ecology. National Academy of Sciences, Washington, DC, pp 58–76
- Suleimani E, Hansen R, Combellick R, Carver G (2002) Tsunami hazard maps of the Kodiak area, Alaska. Alaska Division of Geological & Geophysical Surveys Report of Investigation 2002-1, 16 p, 4 sheets, scale 1:12,500 · DOI
- Suleimani E, Nicolsky D, West D, Combellick R, Hansen R (2010) Tsunami inundation maps of Seward and northern Resurrection Bay, Alaska. Alaska Division of Geological & Geophysical Surveys Report of Investigation 2010-1, 47 p, 3 sheets, scale 1:12,500 · DOI
- Wilson R, Barberopoulou A, Miller K, Goltz J, Synolakis C (2008) New maximum tsunami inundation maps for use by local emergency planners in the State of California, USA: EOS, Transactions of the American Geophysical Union, v. 89, no. 53, Fall Meeting Supplement, Abstract OS43D-1343
- Wood N (2007) Variations in community exposure and sensitivity to tsunami hazards in Oregon. Reston, Va., USGS Scientific Investigations Report 2007-5283, 43 p · DOI
- Wood N, Good J (2005) Perceptions of earthquake and tsunami issues in U.S. Pacific Northwest port and harbor communities. Int J Mass Emerg Disasters 23(3):103–138 · DOI
- Wood N, Schmidtlein M (2013) Community variations in population exposure to near-field tsunami hazards as a function of pedestrian travel time to safety. Nat Hazards 65(3):1603–1628 · DOI
- Wood N, Burton C, Cutter S (2010) Community variations in social vulnerability to Cascadia-related tsunamis in the U.S. Pacific Northwest. Nat Hazards 52(2):369–389 · DOI
- Wood N, Jones J, Schelling J, Schmidtlein M (2014) Tsunami vertical-evacuation planning in the U.S. Pacific Northwest as a geospatial, multi-criteria decision problem. Int J Disaster Risk Reduct 9:68–83 · DOI
Cited by
Sorted by citations
Celikbas, B., Tufekci-Enginar, D., Dogan, G. G., Kolat, C., Santini, M., Annunziato, A., Necmioglu, O., Yalciner, A. C., & Suzen, M. L. (2023) · Natural Hazards · doi:10.1007/s11069-023-06034-6 · Cited by 5
Metadata
- Authors
- Wood, N. J., & Peters, J.
- Venue
- Natural Hazards
- Published
- 2014-09-07
- Volume
- 75
- Issue
- 2
- Pages
- 1811-1831
- ISSN
- 0921-030X
- 1573-0840
- Cited by
- 14
- References
- 2
- Language
- en
About these checks
Registry, retraction, Cites and statistics results are computed, not judged, with one exception: a printed reference that no index lists is read once by a model before it counts as a citation error. Claims are extracted by a model and kept only when their quote appears verbatim in the text; each cited source is then checked, with a model’s help, for whether it says what the claim relies on. Those verdicts can be wrong — read the claim’s quote and the cited source before relying on one.
Statistics and arithmetic are recomputed, not judged.
Confidence bands are shown only for fields calibrated on our annotated test set. None is calibrated yet, so no band is shown.
What counts as a claim ›How we measure confidence ›How we check this ›
Are you an author, or do you see a problem with this page? Request a review
