

The DOI matches its Crossref record; 51 of the 51 references it cites were found in a registry or an index; 7 of the 27 sources its claims cite were checked for support.
Mitigating bus bunching with real-time crowding information
Open accessAbstract
A common problem in public transport systems is bus bunching, characterized by a negative feedback loop between service headways, number of boarding passengers and dwell times. In this study, we examine whether providing real-time crowding information (RTCI) at the stop regarding the two next vehicle departures can stimulate passengers to wait for a less-crowded departure, and thus alleviate the bunching effect. To this end, we leverage on results from own stated-preference survey and develop a boarding choice model. The model accounts for the presence of RTCI and is implemented within dynamic public transport simulation framework. Application to the case-study model of a major bus corridor in Warsaw (Poland) reveals that RTCI can induce a significant probability (30–70%) of intentionally skipping an overcrowded bus and waiting for a later departure instead. This behaviour, in turn, results in significantly lower vehicle headway and load variations, without deteriorations in total waiting utility. Overall, journey experience improves by 6%, and crucially—the prevalence of denial-of-boarding and excessive on-board overcrowding is substantially reduced, by ca. 40%. Results of our study indicate that the willingness to wait induced by RTCI can be a potential demand management strategy in counteracting bunching, with benefits already attainable at limited RTCI response rates.
Overview
CoChat Summary
TL;DR
This study models how real-time crowding information (RTCI) on the next two bus departures can induce passengers to wait for a less-crowded bus and thereby mitigate bus bunching. Applied to a busy Warsaw bus corridor, RTCI reduced headway variability, overcrowding, and denial-of-boarding while improving journey experience.
Key findings
- RTCI induced a 30–70% probability of intentionally skipping an overcrowded bus and waiting for a later departure; the WTW share peaked at 60–70% at stops no. 111–112.
- Headway coefficient of variation was capped at 0.2–0.3 in the RTCI scenario, versus 0.8–1.0 without RTCI, and progression to “full bunching” was suppressed.
- Total perceived journey time fell by 4.7%, in-vehicle time disutility by 6.2%, waiting-time disutility due to denied boarding by 45.5%, and mean absolute journey time by 1.8%; time in the highest overcrowding level fell by 40%.
- Benefits appeared at limited RTCI penetration: at 25% penetration, total PJT fell 1.9% and denied-boarding disutility fell 43.6%; at 50%, PJT fell 4.6%.
Methods
- The authors developed a binary logit boarding-choice model with RTCI for the next two vehicle departures, using willingness-to-wait thresholds from their own stated-preference survey, and implemented it in the BusMezzo agent-based dynamic public transport assignment model.
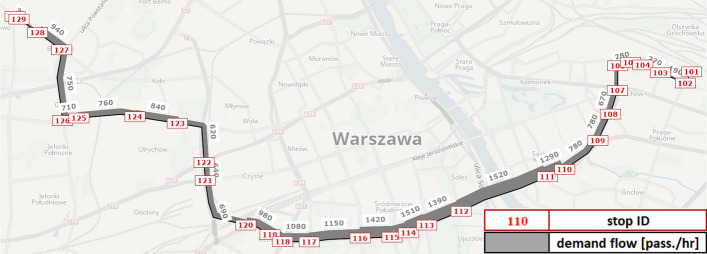
- Case study: westbound bus line no. 523 in Warsaw, 30 stops, 12 buses/hour, nominal headway 5 min, alternate trips initially delayed by +90 s, total demand 3,650 pass./h, vehicle seat capacity 60 and total capacity 150.
- Scenarios compared no RTCI with RTCI and RTCI penetration rates of 25%, 50%, 75%, and 100%; outputs averaged over 30 simulation replications, with metrics including perceived journey time, headway variation, and passenger loads.
Limitations
- Stated in the paper: the study considers localized stop-level RTCI only, not pre-trip information; future work should test different crowding prediction rules, accuracy, and combinations with holding or expressing strategies, and real-world applications are needed for calibration and validation.
- Evident from the text: findings come from a simulation of a single Warsaw bus corridor rather than a field deployment, and the WTW thresholds rely on the authors’ own stated-preference survey.
- Evident from the text: results depend on assumed dwell-time functions, capacities, demand levels, and the imposed initial delay, so transferability to other networks or operating conditions is not established.
Model-written summary. Check it against the paper before relying on it.
Integrity signals
Registry
Cites
Statistics
Figures



Verification
Claims the paper makes
4 Valid · 2 Not valid · 13 Not checked · 118 Own results and interpretations
Every source the paper cites for this claim was checked and supports it.
In the paper
“The BusMezzo model enforces strict capacity constraints (Cats et al. 2016; Gavriilidou and Cats 2019).”
§ Mitigating bus bunching with real-time crowding information > Method > Simulation model environment—BusMezzo
What the sources say
- Supportedcites Cats et al. 2016 source
The paper’s boarding-decision formulation caps the number of passengers boarding at the vehicle’s residual capacity. Its discussion of denied boarding says passengers unable to board because of capacity constraints remain waiting, supporting the claim that BusMezzo enforces strict capacity limits. (LLM, conf=0.94)
- Supportedcites Gavriilidou and Cats 2019 source
Section 3.3 (Implementation) explicitly says BusMezzo enforces vehicle capacity limitations regardless of the control logic applied and retains passengers who cannot board in the waiting flow. This supports the claim that its capacity constraints are strict. (LLM, conf=0.94)
plain- Asserted: passes — The authors put it forward as true.
- Checkable: passes — It can be checked against evidence.
- Load-bearing: passes — The paper’s conclusions depend on it.
- Based: passes — The paper gives a reason why it holds.
- Supported
A result the paper reports from its own data — it cites no other source for it, so there is none to check. The quote shows it is in the paper.
In the paper
“Conversely, the prevalence of WTW behaviour in the RTCI scenario results in a substantially different bus trajectory pattern. As projected in the Fig. 4 (right), this is especially observable from the beginning of high-demand line segment.”
§ Mitigating bus bunching with real-time crowding information > Application and results > Effects on service performance
plainstates a cause- Asserted: passes — The authors put it forward as true.
- Checkable: passes — It can be checked against evidence.
- Load-bearing: passes — The paper’s conclusions depend on it.
- Based: passes — The paper gives a reason why it holds.
- Rests on 3 assumptions not shown here.
A result the paper reports from its own data — it cites no other source for it, so there is none to check. The quote shows it is in the paper.
In the paper
“Travel experience benefits are attainable already with limited responsiveness to RTCI, while higher RTCI utilization among passengers can also foster the service regularity.”
§ Mitigating bus bunching with real-time crowding information > Introduction > Objective and contribution
plainstates a possible causeSingle case- Asserted: passes — The authors put it forward as true.
- Checkable: passes — It can be checked against evidence.
- Load-bearing: passes — The paper’s conclusions depend on it.
- Based: passes — The paper gives a reason why it holds.
A result the paper states — it cites no source for it, so there is none to check. The quote shows it is in the paper.
In the paper
“However, from this point onwards, average PJT savings exhibit a downward trend in the RTCI scenario—from 4% for users boarding at stops no. 115 to even 14–16% for those at stops no. 121–125.”
§ Mitigating bus bunching with real-time crowding information > Application and results > Effects on journey experience
plainstates an association- Asserted: passes — The authors put it forward as true.
- Checkable: passes — It can be checked against evidence.
- Load-bearing: unclear — It is unclear whether the paper’s conclusions depend on it.
- Based: passes — The paper gives a reason why it holds.
A result the paper states — it cites no source for it, so there is none to check. The quote shows it is in the paper.
In the paper
“On average, the PJT changes induced by RTCI are equivalent to welfare benefits of ca. 0.2 EUR (0.9 PLN) per each passenger trip.”
§ Mitigating bus bunching with real-time crowding information > Application and results > Effects on journey experience
plainstates a cause- Asserted: passes — The authors put it forward as true.
- Checkable: passes — It can be checked against evidence.
- Load-bearing: passes — The paper’s conclusions depend on it.
- Based: passes — The paper gives a reason why it holds.
- Rests on 3 assumptions not shown here.
81 more claims
Create a free account to see all 137 claims and every source verdict.
- It may state two separate claims as one. 42
- Probably not a substantial claim. 13
Claims other papers make about this one
Each is checked against this paper’s own text: does it say what the citing paper says it does?
The cited source says what the claim attributes to it.
In the citing paper
“In particular, it is shown in [59] and [60] that providing RTCI at bus stops might help reduce the deleterious “bus bunching” effect [61].”
From Sensing Technologies for Crowd Management, Adaptation, and Information Dissemination in Public Transportation Systems: A Review (2023) · cites this paper as [60]
Self-check
Percentages, sums and reported differences re-computed from the paper’s own numbers.
Each contradiction between two passages listed here was confirmed by an independent check.
Rated minor: it would not touch a result — a value no result rests on, a p-value that stays on the same side of the significance level, or a conflict that is clerical, resolved elsewhere in the paper, or outside its own findings.
In the paper
§ Mitigating bus bunching with real-time crowding information > Method > Model extension—willingness to wait with RTCI
“| Severe overcrowding, possible denial-of-boarding risk | > 1.0 | ≤ 1.0 |”
§ Mitigating bus bunching with real-time crowding information > Method > Model extension—willingness to wait with RTCI
“| Moderate crowding, no seats, but can stand and move freely inside | > 1.0 | ≤ 0.8 |”
Rated minor: it would not touch a result — a value no result rests on, a p-value that stays on the same side of the significance level, or a conflict that is clerical, resolved elsewhere in the paper, or outside its own findings.
In the paper
§ Mitigating bus bunching with real-time crowding information > Application and results > Experimental set-up
“We model the westbound direction, which is particularly busy and susceptible to bunching during the morning peak period.”
§ Mitigating bus bunching with real-time crowding information > Application and results > Effects on journey experience
“Once projected in annual terms, total welfare benefits—attainable for this single bus line during a single PM peak hour only—would amount to ca. 223 k EUR (1.0 m PLN).”
Rated minor: it would not touch a result — a value no result rests on, a p-value that stays on the same side of the significance level, or a conflict that is clerical, resolved elsewhere in the paper, or outside its own findings.
In the paper
§ Mitigating bus bunching with real-time crowding information > Application and results > Effects on journey experience
“Total perceived IVT reduces by 7.5% in the RTCI scenario”
§ Mitigating bus bunching with real-time crowding information > Application and results > Effects on journey experience
“| In-vehicle time (IVT)—total | In-vehicle time (IVT)—total | 1376.0 | 1290.8 | − 6.2% |”
Rated minor: it would not touch a result — a value no result rests on, a p-value that stays on the same side of the significance level, or a conflict that is clerical, resolved elsewhere in the paper, or outside its own findings.
In the paper
§ Mitigating bus bunching with real-time crowding information > Application and results > Experimental set-up
“assuming the conversion rate of 4.6 [EUR/PLN]”
§ Mitigating bus bunching with real-time crowding information > Application and results > Effects on journey experience
“ca. 0.2 EUR (0.9 PLN) per each passenger trip”
Rated minor: it would not touch a result — a value no result rests on, a p-value that stays on the same side of the significance level, or a conflict that is clerical, resolved elsewhere in the paper, or outside its own findings.
In the paper
§ Mitigating bus bunching with real-time crowding information > Method > Model extension—willingness to wait with RTCI
“No crowding, more than 50% of seats available”
§ Mitigating bus bunching with real-time crowding information > Method > Model extension—willingness to wait with RTCI
“| ≤ 0.8 | ≤ 0.8 |”
Citations
Cites
Tirachini, A., Hensher, D. A., & Rose, J. M. (2013) · Transportation Research Part A: Policy and Practice · doi:10.1016/j.tra.2013.06.005 · Cited by 385
Reducing bunching with bus-to-bus cooperation
Daganzo, C. F., & Pilachowski, J. (2011) · Transportation Research Part B: Methodological · doi:10.1016/j.trb.2010.06.005 · Cited by 325
How much can holding and/or limiting boarding improve transit performance?
Delgado, F., Munoz, J. C., & Giesen, R. (2012) · Transportation Research Part B: Methodological · doi:10.1016/j.trb.2012.04.005 · Cited by 264
A self-coördinating bus route to resist bus bunching
Bartholdi, J. J., & Eisenstein, D. D. (2012) · Transportation Research Part B: Methodological · doi:10.1016/j.trb.2011.11.001 · Cited by 239
Real-Time Optimization Model for Dynamic Scheduling of Transit Operations
Fu, L., Liu, Q., & Calamai, P. (2003) · Transportation Research Record: Journal of the Transportation Research Board · doi:10.3141/1857-06 · Cited by 199
Cats, O., & Jenelius, E. (2014) · Networks and Spatial Economics · doi:10.1007/s11067-014-9237-7 · Cited by 187
Self-citationThe Real–Time Stop–Skipping Problem
SUN, A., & HICKMAN, M. (2005) · Journal of Intelligent Transportation Systems · doi:10.1080/15472450590934642 · Cited by 177
Wu, W., Liu, R., & Jin, W. (2017) · Transportation Research Part B: Methodological · doi:10.1016/j.trb.2017.06.019 · Cited by 177
A real-time bus dispatching policy to minimize passenger wait on a high frequency route
Berrebi, S., Watkins, K. E., & Laval, J. A. (2015) · Transportation Research Part B Methodological · doi:10.1016/j.trb.2015.05.012 · Cited by 137
Discomfort in mass transit and its implication for scheduling and pricing
de Palma, A., Kilani, M., & Proost, S. V. (2014) · Transportation Research Part B Methodological · doi:10.1016/j.trb.2014.10.001 · Cited by 136
Research works printed but not linked: 3
- Cats, O.: Dynamic modelling of transit operations and passenger decisions. Doctoral dissertation. KTH Royal Institute of Technology, Stockholm (2011)
- Newell, G.F., Potts, R.B.: Maintaining a bus schedule. In: Australian Road Research Board (ARRB) conference, vol. 2, Melbourne (1964)
- TCRP: Transit capacity and quality of service manual (TCQSM) 2nd edition. Transportation Research Board, TCRP report 100. Washington, DC (2013)
Cited by
Darsena, D., Gelli, G., Iudice, I., & Verde, F. (2023) · IEEE Sensors Journal · doi:10.1109/jsen.2022.3223297 · Cited by 71
Ziedan, A., Brakewood, C., & Watkins, K. E. (2023) · Journal of Public Transportation · doi:10.1016/j.jpubtr.2023.100046 · Cited by 47
Drabicki, A., Cats, O., Kucharski, R., Fonzone, A., & Szarata, A. (2023) · Research in Transportation Business & Management · doi:10.1016/j.rtbm.2023.100963 · Cited by 44
Self-citationBus bunching: a comprehensive review from demand, supply, and decision-making perspectives
Rezazada, M., Nassir, N., Tanin, E., & Ceder, A. (. (2024) · Transport Reviews · doi:10.1080/01441647.2024.2313969 · Cited by 26
Alleviating bus bunching via modular vehicles
Liu, Y., Chen, Z., & Wang, X. (2024) · Transportation Research Part B Methodological · doi:10.1016/j.trb.2024.103051 · Cited by 19
Metadata
- Authors
- Drabicki, A., Kucharski, R., & Cats, O.
- Affiliations
- Cracow University of Technology (PL)
- Jagiellonian University (PL)
- Delft University of Technology (NL)
- Corresponding author
- Drabicki, Arkadiusz
- Venue
- Transportation
- Published
- 2022-03-04
- Volume
- 50
- Issue
- 3
- Pages
- 1003-1030
- ISSN
- 0049-4488 (ISSN-L)
- 1572-9435
- PMC
- PMC8895103
- OpenAlex
- W4214931511
- Semantic Scholar
- e05dd1cb9516d3ba14f4667112b0667b67bf5e21
- Cited by
- 30
- References
- 43
- Citations by year
- 2026: 8 · 2025: 5 · 2024: 8 · 2023: 6 · 2022: 3
- FWCI
- 3.63
- Type
- journal article
- Language
- en
- Open access
- hybrid
- doi.org
- Licence
- cc-by
- creativecommons.org/licenses/by/4.0 (tdm)
- creativecommons.org/licenses/by/4.0 (vor)
- Locations
- Transportation (publishedVersion, cc-by)
- PubMed Central (publishedVersion, cc-by)
- PubMed (publishedVersion)
- Homo Politicus (Academy of Humanities and Economics in Lodz) (submittedVersion, cc-by-nc-nd)
- RePEc: Research Papers in Economics (submittedVersion)
- Research Repository (Delft University of Technology) (submittedVersion, cc-by)
- Data Archiving and Networked Services (DANS) (submittedVersion, other-oa)
- Funders
- NAWA - Polish National Agency for Academic Exchange (PPN/IWA/2018/1/00084)
- Topics
- Social Sciences › Transportation › Transportation Planning and Optimization
- Social Sciences › Transportation › Transportation and Mobility Innovations
- Physical Sciences › Engineering › Control and Systems Engineering › Traffic control and management
- Keywords
- bus bunching, vehicle headway, dwell time, overcrowding, willingness to wait, demand management, stated preference, bus corridors, Warsaw
About these checks
Registry, retraction, Cites and statistics results are computed, not judged, with one exception: a printed reference that no index lists is read once by a model before it counts as a citation error. Claims are extracted by a model and kept only when their quote appears verbatim in the text; each cited source is then checked, with a model’s help, for whether it says what the claim relies on. Those verdicts can be wrong — read the claim’s quote and the cited source before relying on one.
The claim verdicts this report counts are experimental: their accuracy is not yet measured.
A language model drew the claims from the paper on 2026-11-05, under version 3 of the claim definition (model deepseek-v4.1-flash, prompt extract-v3).
A second model labelled each claim on 2026-11-05 (model jev-1.13-20260917, definition revision gold-guideline-v0.2).
Cited sources are checked with a language model’s help (gpt-6-sol).
Statistics and arithmetic are recomputed, not judged.
Confidence bands are shown only for fields calibrated on our annotated test set. None is calibrated yet, so no band is shown.
What counts as a claim ›How we measure confidence ›How we check this ›
Are you an author, or do you see a problem with this page? Request a review
How to cite
Cite CoChat for the checks on this page, and the paper for its own findings.
- This page
- CoChat. (2026). Citation check: Mitigating bus bunching with real-time crowding information. https://app.cochat.ai/papers/10.1007/s11116-022-10270-3
- The paper
- Drabicki, A., Kucharski, R., & Cats, O. (2023). Mitigating bus bunching with real-time crowding information. Transportation. https://doi.org/10.1007/s11116-022-10270-3
Data sources
Bibliographic data: Semantic Scholar, OpenAlex, Crossref.
Contains information from the Semantic Scholar Academic Graph Datasets, made available under the ODC Attribution License (ODC-BY 1.0).
Semantic Scholar’s data is described in: Kinney, R., et al. (2023). The Semantic Scholar Open Data Platform. arXiv:2301.10140.
