CoChat

How Molecules Became Signs

Open access
Deacon, Terrence W. · 2021 · Biosemiotics

The DOI matches its Crossref record; 31 of the 33 references it cites were found in a registry or an index.

Abstract

To explore how molecules became signs I will ask: “What sort of process is necessary and sufficient to treat a molecule as a sign?” This requires focusing on the interpreting system and its interpretive competence. To avoid assuming any properties that need to be explained I develop what I consider to be a simplest possible molecular model system which only assumes known physics and chemistry but nevertheless exemplifies the interpretive properties of interest. Three progressively more complex variants of this model of interpretive competence are developed that roughly parallel an icon-index-symbol hierarchic scaffolding logic. The implication of this analysis is a reversal of the current dogma of molecular and evolutionary biology which treats molecules like DNA and RNA as the original sources of biological information. Instead I argue that the structural characteristics of these molecules have provided semiotic affordances that the interpretive dynamics of viruses and cells have taken advantage of. These molecules are not the source of biological information but are instead semiotic artifacts onto which dynamical functional constraints have been progressively offloaded during the course of evolution.

Overview

The claims and statistics of this paper haven’t been checked yet.

Free: it reads the open-access text and checks the first 5 claims that cite a source we can check. Create a free account to check every claim.

A few free checks a day · papers already verified open instantly · results are public

Integrity signals

Registry

Crossref · 10.1007/s12304-021-09453-9

Cites

31 of 31 references verified0 citation errors · 0 not checkable

Statistics

Figures

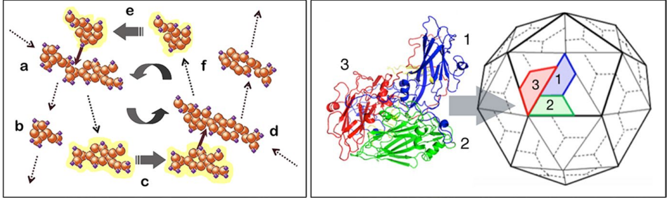
Fig. 1 Two molecular processes that are widely represented in essentially all life forms: reciprocal catalysis (left) and self-assembly (right). The example of self-assembly depicts the construction of a polyhedral viral capsid (shell) in which a complex of 3 proteins (1, 2, 3) form a symmetric facet of an icosahedral capsid
Fig. 1 Two molecular processes that are widely represented in essentially all life forms: reciprocal catalysis (left) and self-assembly (right). The example of self-assembly depicts the construction of a polyhedral viral capsid (shell) in which a complex of 3 proteins (1, 2, 3) form a symmetric facet of an icosahedral capsidCC-BY · From the PDF
Fig. 2 Depictions of two hypothetical forms of simple autogenetic (i.e. self-reproducing) viruses with polyhedral (left panel) and tubular (middle panel) capsid structure. The chemical logic of simple autogenesis is depicted in the diagram in the right panel. Molecule a is modified by catalyst f to produce catalyst c plus side product n and catalyst c modifies substrate molecule d to produce catalyst f and side product g which tends to self assemble onto a capsid and will thereby tend to encapsulate catalysts c and f and prevent them from diffusing away from one another
Fig. 2 Depictions of two hypothetical forms of simple autogenetic (i.e. self-reproducing) viruses with polyhedral (left panel) and tubular (middle panel) capsid structure. The chemical logic of simple autogenesis is depicted in the diagram in the right panel. Molecule a is modified by catalyst f to produce catalyst c plus side product n and catalyst c modifies substrate molecule d to produce catalyst f and side product g which tends to self assemble onto a capsid and will thereby tend to encapsulate catalysts c and f and prevent them from diffusing away from one anotherCC-BY · From the PDF
Fig. 3 Diagrams depicting the steps of the autogenic work cycle (left panel) highlighting the reciprocity of the codependent self-organizing dynamics (reciprocal catalysis and self-assembling capsid) and a simplification that highlights the way that each of these processes provides the critical boundary constraints that supports the other (right panel)
Fig. 3 Diagrams depicting the steps of the autogenic work cycle (left panel) highlighting the reciprocity of the codependent self-organizing dynamics (reciprocal catalysis and self-assembling capsid) and a simplification that highlights the way that each of these processes provides the critical boundary constraints that supports the other (right panel)CC-BY · From the PDF
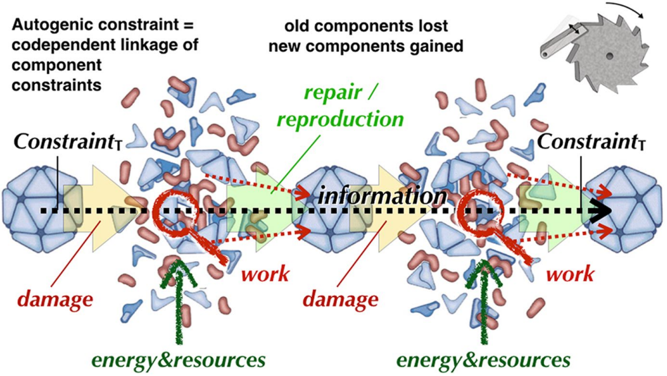
Fig. 4 This diagram depicts two cycles of damage and self-repair in which integrity is temporarily lost but the intrinsic constraints distributed in co-localized molecules enables the recruitment of energy and new substrates from the environment to reconstitute autogenic integrity. As a result the constraints embodied in the first inert autogen are maintained throughout. They remain continuously present despite old molecular substrates being replaced by newly synthesized ones. In this way information in the form of these constraints is inherited by future materially independent replicas and 'instructs' their formation
Fig. 4 This diagram depicts two cycles of damage and self-repair in which integrity is temporarily lost but the intrinsic constraints distributed in co-localized molecules enables the recruitment of energy and new substrates from the environment to reconstitute autogenic integrity. As a result the constraints embodied in the first inert autogen are maintained throughout. They remain continuously present despite old molecular substrates being replaced by newly synthesized ones. In this way information in the form of these constraints is inherited by future materially independent replicas and 'instructs' their formationCC-BY · From the PDF
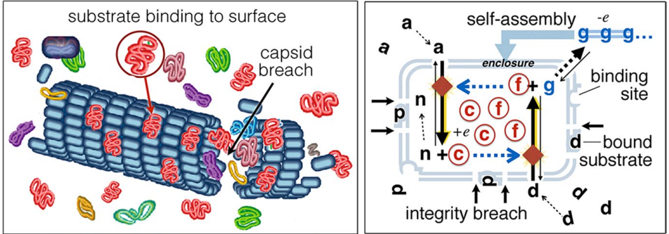
Fig. 5 This slightly more complicated autogenic system that is capable of assaying its environment is depicted on the left (as a tubular autogen) and its reaction network structure is diagrammed on the right. This complication of the basic autogenic model system involves 1. a capsid surface with protruding features (epitopes) shaped in such a way that substrate molecules (indicated by molecules of type d in the diagram) will tend to bind to them; and 2. capsid molecule cohesion that is weakened in proportion to the number of surface-bound substrates, to the point that containment can be more easily be disrupted when surface binding is extensive. Notice that substrate binding is mediated by a similarity (isometry) relation and containment is weakened in correlation with the concentration of substrates in the environment (i.e. with respect to their physical contiguity and quantity)
Fig. 5 This slightly more complicated autogenic system that is capable of assaying its environment is depicted on the left (as a tubular autogen) and its reaction network structure is diagrammed on the right. This complication of the basic autogenic model system involves 1. a capsid surface with protruding features (epitopes) shaped in such a way that substrate molecules (indicated by molecules of type d in the diagram) will tend to bind to them; and 2. capsid molecule cohesion that is weakened in proportion to the number of surface-bound substrates, to the point that containment can be more easily be disrupted when surface binding is extensive. Notice that substrate binding is mediated by a similarity (isometry) relation and containment is weakened in correlation with the concentration of substrates in the environment (i.e. with respect to their physical contiguity and quantity)CC-BY · From the PDF
Fig. 6 An energy-assisted autogenic reaction network. The diagram shows a side-product ( n ) of one of the catalytic steps that is a nucleotide-like molecule that is able to capture energy in the form of phosphate molecules ( p ) and transfer the energy to facilitate other catalytic reactions. On the right side of the diagram nucleotides stripped of their high-energy phosphates are shown linked into a polymer
Fig. 6 An energy-assisted autogenic reaction network. The diagram shows a side-product ( n ) of one of the catalytic steps that is a nucleotide-like molecule that is able to capture energy in the form of phosphate molecules ( p ) and transfer the energy to facilitate other catalytic reactions. On the right side of the diagram nucleotides stripped of their high-energy phosphates are shown linked into a polymerCC-BY · From the PDF
Fig. 7 Three steps demonstrating how a nucleic acid template can regulate the reaction constraints of a complex autogenic process. The left panel depicts the weak binding of a protein (catalyst molecule) to a section of the nucleic acid double helix by virtue of their complementary shapes. The central panel abstractly depicts the binding of three catalysts on a nucleic acid template so that their tendency to interact with one another is determined by their relative proximity (blue = low probability, red = high probability). The right panel depicts the autogenically useful interactions as solid lines and the suppressed potentially disadvantageous interactions as dotted lines
Fig. 7 Three steps demonstrating how a nucleic acid template can regulate the reaction constraints of a complex autogenic process. The left panel depicts the weak binding of a protein (catalyst molecule) to a section of the nucleic acid double helix by virtue of their complementary shapes. The central panel abstractly depicts the binding of three catalysts on a nucleic acid template so that their tendency to interact with one another is determined by their relative proximity (blue = low probability, red = high probability). The right panel depicts the autogenically useful interactions as solid lines and the suppressed potentially disadvantageous interactions as dotted linesCC-BY · From the PDF
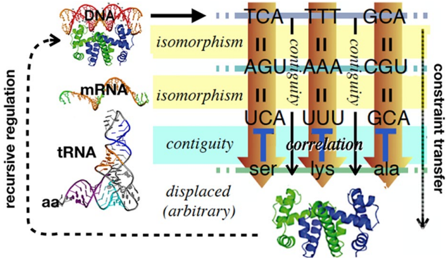
Fig. 8 A diagram of the 'genetic code' depicting how constraint in the form of a nucleotide sequence is re-presented in the order of amino acids constituting a synthesized protein and how a protein can bind to the DNA template in a position determined by a specific nucleotide sequence at that position. The information continuity between DNA and protein is mediated by a combination of similarity and correlation (contiguity) relationships that preserves constraint (via iconism between nucleotide sequence and amino acid sequence) while transferring it to an otherwise unrelated molecular form. The material difference in sign vehicle makes possible recursive control of gene expression by virtue of the structural match between the 3 dimensional structure of a protein and the 3 dimensional difference in the local 'twist' of the DNA molecule. Thus sequence constraints are transferred to 3 dimensional structural constraints which regulate the expression of sequence constraints, and so forth
Fig. 8 A diagram of the 'genetic code' depicting how constraint in the form of a nucleotide sequence is re-presented in the order of amino acids constituting a synthesized protein and how a protein can bind to the DNA template in a position determined by a specific nucleotide sequence at that position. The information continuity between DNA and protein is mediated by a combination of similarity and correlation (contiguity) relationships that preserves constraint (via iconism between nucleotide sequence and amino acid sequence) while transferring it to an otherwise unrelated molecular form. The material difference in sign vehicle makes possible recursive control of gene expression by virtue of the structural match between the 3 dimensional structure of a protein and the 3 dimensional difference in the local 'twist' of the DNA molecule. Thus sequence constraints are transferred to 3 dimensional structural constraints which regulate the expression of sequence constraints, and so forthCC-BY · From the PDF
Fig. 9 The recursive relationship between gene sequence and protein structure that makes recursive gene regulation possible is the basis for higher order epigenetic recursive processes to evolve. Regulatory genes can thus influence the expression of whole suites of other genes by virtue of isomorphic binding sites (top left). Duplicated variants of regulatory genes which have slightly variant binding specificity can produce differences in the timing and location of expression, as well as differences in which genes are and are not expressed (exemplified by Hox gene duplications in different animal lineages; bottom left). This additionally allows a yet higher order recursion, as cells in different locales in the developing body can influence the expression of genes of cells in other locales. The result of this recursive iteration is that the theme and variation logic of regulatory gene information can be re-expressed in the quite different 3 dimensional structure of multi celled body plans (right panels). Arrows marked 1 in these images indicate theme and variation within an organism. Arrows marked 2 indicate theme and variation between different lineages
Fig. 9 The recursive relationship between gene sequence and protein structure that makes recursive gene regulation possible is the basis for higher order epigenetic recursive processes to evolve. Regulatory genes can thus influence the expression of whole suites of other genes by virtue of isomorphic binding sites (top left). Duplicated variants of regulatory genes which have slightly variant binding specificity can produce differences in the timing and location of expression, as well as differences in which genes are and are not expressed (exemplified by Hox gene duplications in different animal lineages; bottom left). This additionally allows a yet higher order recursion, as cells in different locales in the developing body can influence the expression of genes of cells in other locales. The result of this recursive iteration is that the theme and variation logic of regulatory gene information can be re-expressed in the quite different 3 dimensional structure of multi celled body plans (right panels). Arrows marked 1 in these images indicate theme and variation within an organism. Arrows marked 2 indicate theme and variation between different lineagesCC-BY · From the PDF

Verification

Claims the paper makes

The claims and statistics of this paper haven’t been checked yet.

Free: it reads the open-access text and checks the first 5 claims that cite a source we can check. Create a free account to check every claim.

A few free checks a day · papers already verified open instantly · results are public

Claims other papers make about this one

Each is checked against this paper’s own text: does it say what the citing paper says it does?

Self-check

Percentages, sums and reported differences re-computed from the paper’s own numbers.

The self-check needs the paper’s full text.

Citations

Cites

Show all 31 references

Research works printed but not linked: 1

  1. Peirce, Charles S. (1931–1935). Collected Papers of Charles Sanders Peirce, Vol. 1–6. C. Hartshorne & P. Weiss (Eds.). Harvard University Press.

Cited by

See all 94

Metadata

Authors
Deacon, T. W.
Affiliations
University of California, Berkeley (US)
Corresponding author
Deacon, Terrence W.
Venue
Biosemiotics
Published
2021-09-25
Volume
14
Issue
3
Pages
537-559
ISSN
  • 1875-1342 (ISSN-L)
  • 1875-1350
OpenAlex
W3204423972
Cited by
81
References
33
Citations by year
2026: 11 · 2025: 21 · 2024: 13 · 2023: 19 · 2022: 2 · 2021: 14
FWCI
49.64
Type
journal article
Language
en
Open access
Licence
Locations
  • Biosemiotics (publishedVersion, cc-by)
  • eScholarship (California Digital Library) (submittedVersion)
Topics
  • Social Sciences › Arts and Humanities › History and Philosophy of Science › Philosophy of Biology and Scientific Explanation
  • Social Sciences › Arts and Humanities › Literature and Literary Theory › Semiotics and Representation Studies
  • Life Sciences › Biochemistry, Genetics and Molecular Biology › Molecular Biology › RNA and protein synthesis mechanisms
Keywords
semiotic competence, biological information, viruses, cells

About these checks

Registry, retraction, Cites and statistics results are computed, not judged, with one exception: a printed reference that no index lists is read once by a model before it counts as a citation error. Claims are extracted by a model and kept only when their quote appears verbatim in the text; each cited source is then checked, with a model’s help, for whether it says what the claim relies on. Those verdicts can be wrong — read the claim’s quote and the cited source before relying on one.

Statistics and arithmetic are recomputed, not judged.

Confidence bands are shown only for fields calibrated on our annotated test set. None is calibrated yet, so no band is shown.

What counts as a claim ›How we measure confidence ›How we check this ›

Are you an author, or do you see a problem with this page? Request a review

How to cite

Cite CoChat for the checks on this page, and the paper for its own findings.

This page
CoChat. (2026). Citation check: How Molecules Became Signs. https://app.cochat.ai/papers/10.1007/s12304-021-09453-9
The paper
Deacon, T. W. (2021). How Molecules Became Signs. Biosemiotics. https://doi.org/10.1007/s12304-021-09453-9

Data sources

Bibliographic data: Semantic Scholar, OpenAlex, Crossref.

Contains information from the Semantic Scholar Academic Graph Datasets, made available under the ODC Attribution License (ODC-BY 1.0).

Semantic Scholar’s data is described in: Kinney, R., et al. (2023). The Semantic Scholar Open Data Platform. arXiv:2301.10140.