

The DOI matches its Crossref record; 83 of the 85 references it cites were found in a registry or an index; none of the 100 sources its claims cite is checked for support yet.
Magnetic resonance imaging of sellar and juxtasellar abnormalities in the paediatric population: an imaging review
Open accessAbstract
The sellar and juxtasellar regions in the paediatric population are complex both anatomically and pathologically, with magnetic resonance imaging (MRI) being the "gold standard" imaging modality due to the high contrast of detail. Assessment requires a detailed understanding of the anatomy, embryology, pathophysiology and normal signal characteristics of the pituitary gland and surrounding structures in order to appropriately characterise abnormalities. This article aims to provide an overview of the imaging characteristics of developmental/congenital and acquired disease processes which affect the sellar and juxtasellar region in the paediatric population. Main Messages • The sellar region is anatomically complex and covers a wide pathology spectrum. • MRI is the key imaging modality to assess sellar and juxtasellar pathology. • Numerous developmental anomalies may not be discovered until adulthood. • Knowledge of pathology alerts and guides the clinician towards appropriate management.
Overview
CoChat Summary
TL;DR
This narrative imaging review summarises the MRI features of congenital/developmental and acquired sellar and juxtasellar abnormalities in children, framing MRI as the "gold standard" modality because of its high contrast resolution. It provides entity-by-entity imaging descriptions (signal characteristics, enhancement, location) alongside brief clinical, embryological and epidemiological context.
Key findings
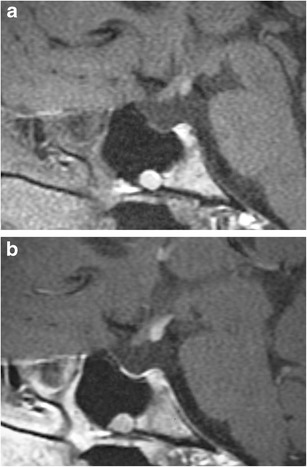
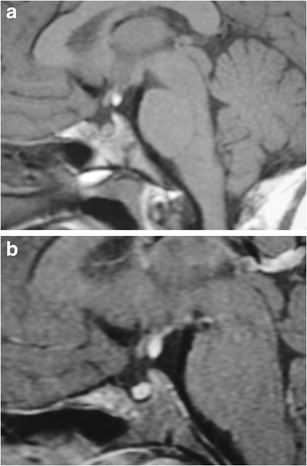
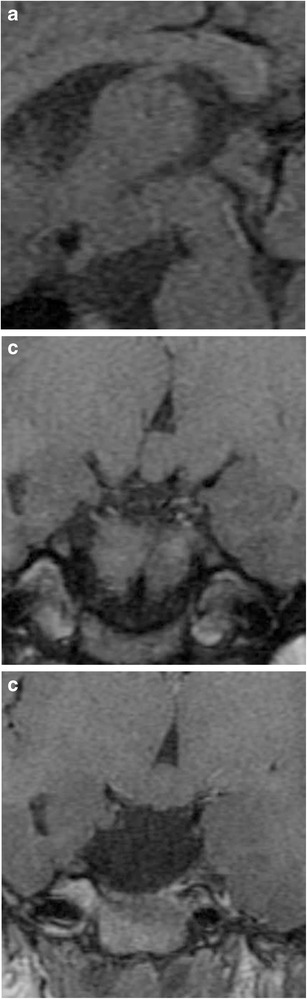
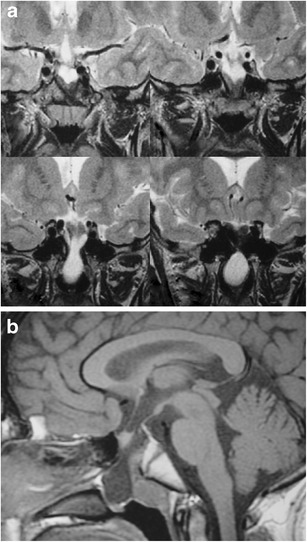
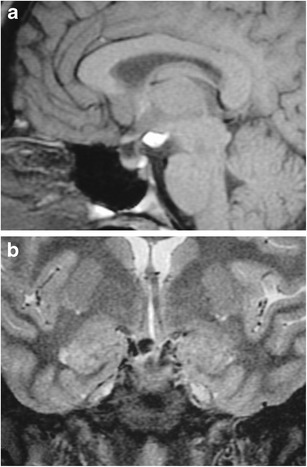
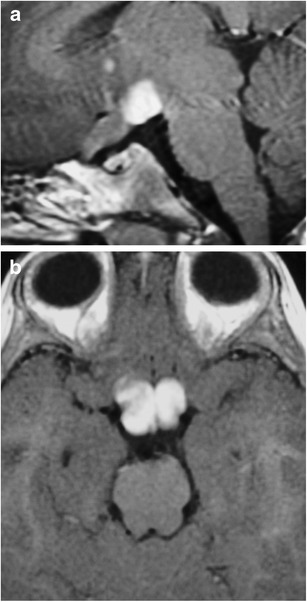
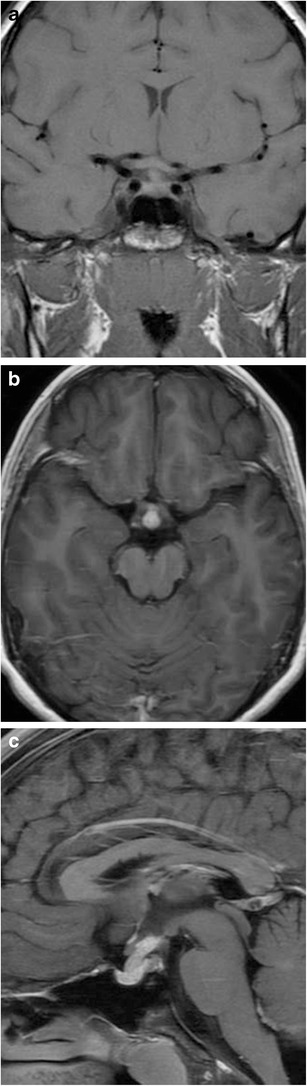
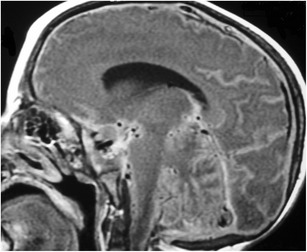
- Normal paediatric pituitary imaging evolves: both lobes are T1-hyperintense at birth, with the anterior lobe dropping to near isointensity with the posterior pons by 6 weeks of age, while the posterior lobe retains T1 hyperintensity throughout adulthood. Normal pituitary height is typically 2–6 mm during childhood and up to 10 mm or slightly higher at puberty; preterm infants have taller glands than term infants.
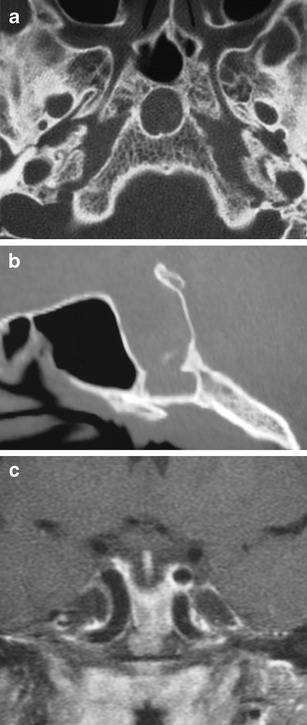
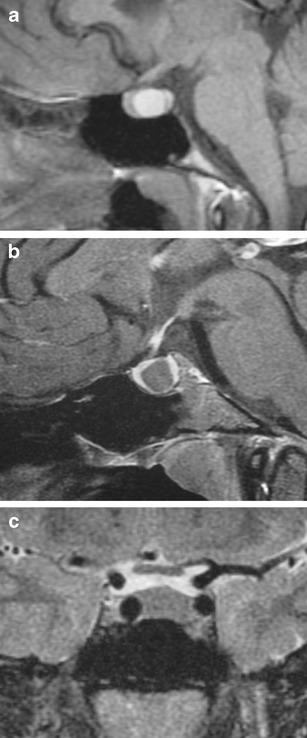
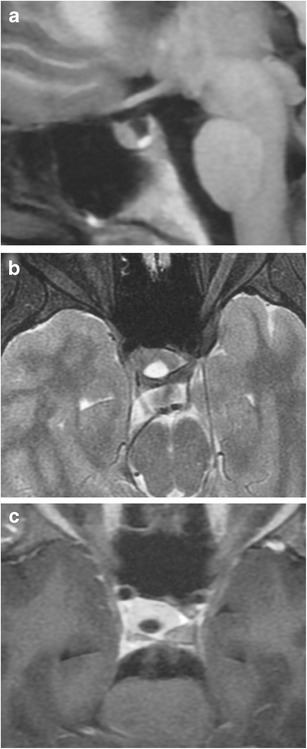
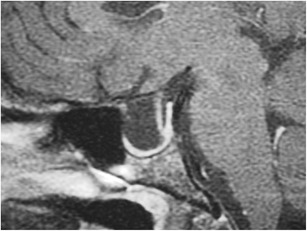
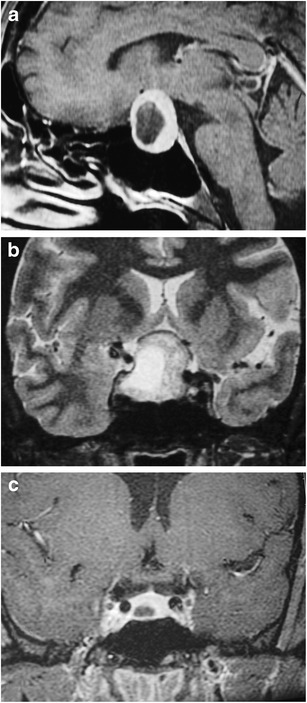
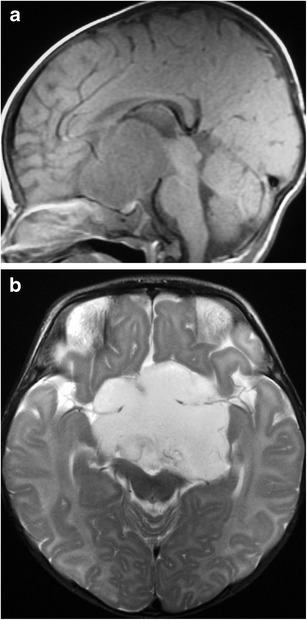
- Developmental anomalies covered include adenohypophyseal agenesis and hypoplasia, ectopic posterior pituitary, pituitary duplication, hypothalamic hamartoma, persistent craniopharyngeal canal, Rathke's cleft cyst, cephaloceles, epidermoid/dermoid, arachnoid cyst, lipoma and empty sella. Reported frequencies include Rathke's cleft cysts on MRI in childhood at 1.2%, arachnoid cysts in 0.16% of all newborns with 9–15% in the sellar region, and trans-sphenoidal meningoencephaloceles at 1 per 700,000 live births.
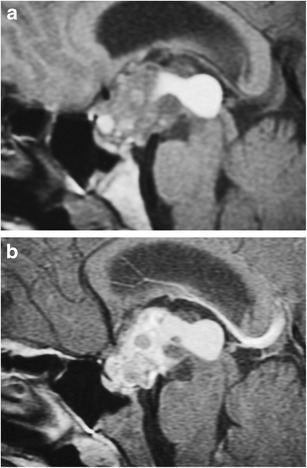
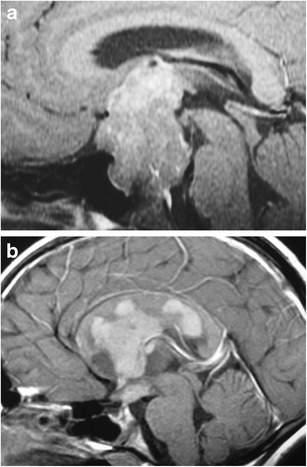
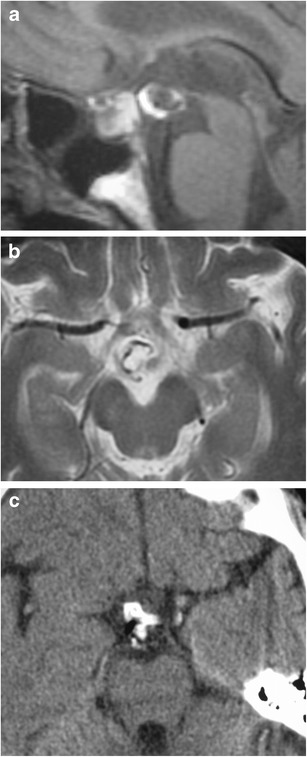
- Neoplastic and inflammatory entities reviewed include pituitary adenoma (≈2.7% of all supratentorial tumours in children; only 3–6% non-functioning versus one-third in adults), craniopharyngioma (3% of all intracranial tumours), optic pathway glioma (4–6% of paediatric brain tumours, median diagnosis 5–9 years, ~half with NF1), pilomyxoid astrocytoma, germinoma and teratoma, tuberculous meningitis, osteosarcoma, Ewing sarcoma, esthesioneuroblastoma, fibrous dysplasia/McCune-Albright, Langerhans' cell histiocytosis (2 per 100,000 children under 15), lymphocytic hypophysitis, Rosai-Dorfman disease, leptomeningeal lymphoma and vascular malformations.
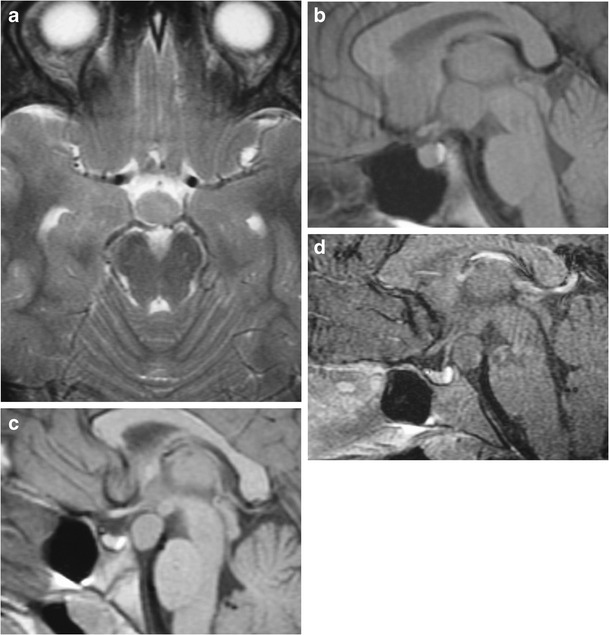
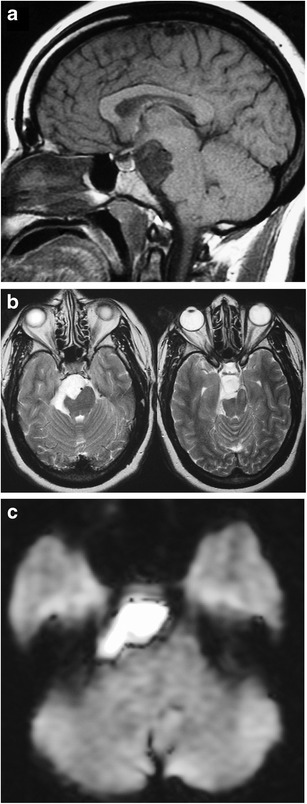
- Several discriminating features are highlighted: non-enhancing T2-hyperintense lesions suggest hypothalamic hamartoma or Rathke's cleft cyst; restricted diffusion distinguishes epidermoid from arachnoid cyst; intra-tumoural haemorrhage favours pilomyxoid over pilocytic astrocytoma (25% vs 8%); a parasellar T2 dark sign helps separate lymphocytic hypophysitis from adenoma; stalk thickness >3 mm with loss of posterior pituitary T1 bright spot suggests LCH.
Methods
- Design: narrative, image-based educational review; no systematic search strategy, inclusion criteria, or evidence grading is described.
- Data: no patient cohort or primary data; the article is illustrated with numbered figures (Figs. 1–31) of example cases and synthesises published literature, with 79 cited references.
- Analysis: qualitative synthesis organised by anatomical/embryological background, normal paediatric imaging characteristics, developmental anomalies, pituitary lesions, and juxtasellar lesions.
Limitations
- The paper states no limitations explicitly.
- Evident from the text: as a narrative review there is no stated search strategy, study selection, or critical appraisal of the cited literature; epidemiological figures are quoted from heterogeneous prior series without quality assessment.
- Also evident: illustration is via selected single-institution example images rather than systematic imaging–pathology correlation, and the review does not address diagnostic accuracy, sensitivity/specificity, or comparative performance of MRI against other modalities.
Model-written summary. Check it against the paper before relying on it.
Integrity signals
Registry
Cites
Statistics
Figures
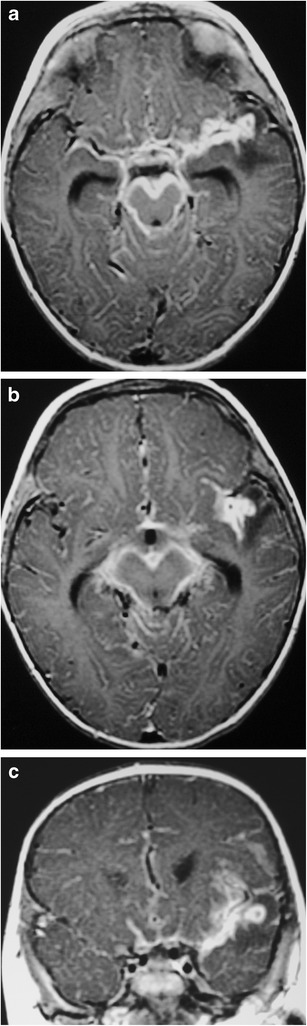
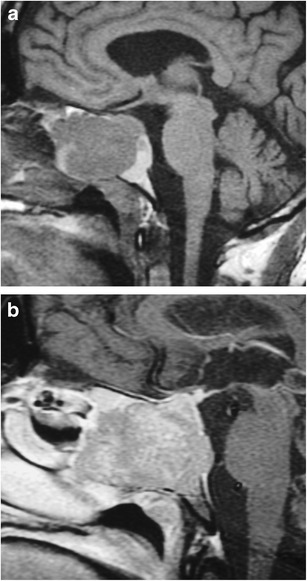
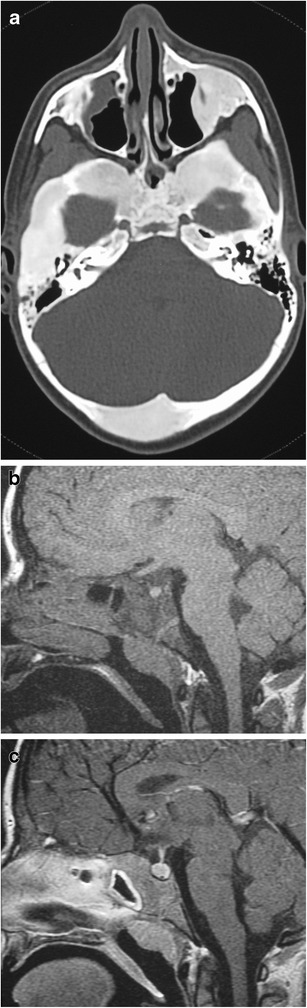
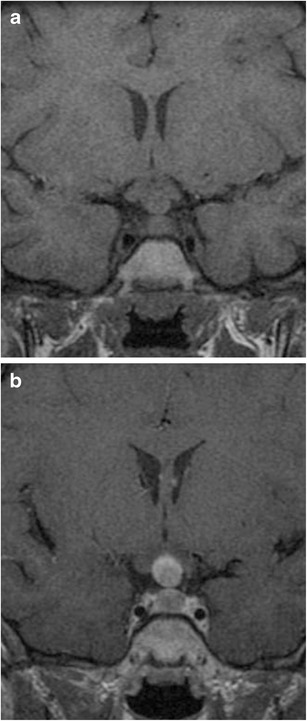
Verification
Claims the paper makes
0 Valid · 0 Not valid · 70 Not checked · 1 Own results and interpretations
A result the paper states — it cites no source for it, so there is none to check. The quote shows it is in the paper.
In the paper
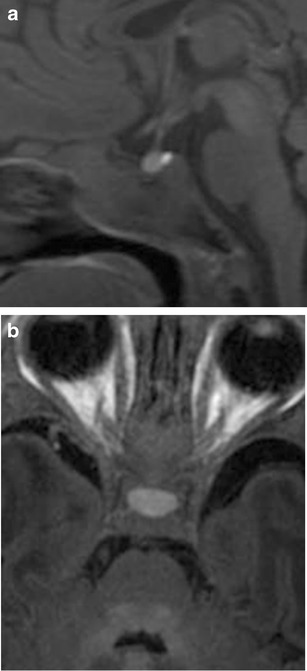
“At birth, both the anterior and posterior pituitary gland have high signal intensity on T1-weighted images (Fig. 3).”
§ Magnetic resonance imaging of sellar and juxtasellar abnormalities in the paediatric population: an imaging review > Imaging characteristics in the paediatric population
plain- Asserted: passes — The authors put it forward as true.
- Checkable: passes — It can be checked against evidence.
- Load-bearing: unclear — It is unclear whether the paper’s conclusions depend on it.
- Based: passes — The paper gives a reason why it holds.
None of the sources cited for this claim have been checked yet.
In the paper
“The posterior pituitary gland retains its high signal intensity on T1-weighted images throughout adulthood, with several papers supporting that this high signal results from neurosecretory granules or the protein neurophysin [3–5].”
§ Magnetic resonance imaging of sellar and juxtasellar abnormalities in the paediatric population: an imaging review > Imaging characteristics in the paediatric population
What the sources say
- Not checked yetcites [3] Fujisawa I, Asato R, Nishimura K et al (1987) Anterior and posterior lobes of the pituitary gland: assessment by 1.5 T MR imaging. J Comput Assist Tomogr 11:214–220 source
- Not checked yetcites [4] Nishimura K, Fujisawa I, Togashi K et al (1986) Posterior lobe of the pituitary: identification by lack of chemical shift artifact in MR imaging. J Comput Assist Tomogr 10:899–902 source
- Not checked yetcites [5] Fujisawa I, Asato R, Kawata M et al (1989) Hyperintense signal of the posterior pituitary on T1-weighted MR images: an experimental study. J Comput Assist Tomogr 13:371–377 source
plain- Asserted: passes — The authors put it forward as true.
- Checkable: passes — It can be checked against evidence.
- Load-bearing: unclear — It is unclear whether the paper’s conclusions depend on it.
- Based: passes — The paper gives a reason why it holds.
None of the sources cited for this claim have been checked yet.
In the paper
“The posterior pituitary gland retains its high signal intensity on T1-weighted images throughout adulthood, with several papers supporting that this high signal results from neurosecretory granules or the protein neurophysin [3–5].”
§ Magnetic resonance imaging of sellar and juxtasellar abnormalities in the paediatric population: an imaging review > Imaging characteristics in the paediatric population
What the sources say
- Not checked yetcites [3] Fujisawa I, Asato R, Nishimura K et al (1987) Anterior and posterior lobes of the pituitary gland: assessment by 1.5 T MR imaging. J Comput Assist Tomogr 11:214–220 source
- Not checked yetcites [4] Nishimura K, Fujisawa I, Togashi K et al (1986) Posterior lobe of the pituitary: identification by lack of chemical shift artifact in MR imaging. J Comput Assist Tomogr 10:899–902 source
- Not checked yetcites [5] Fujisawa I, Asato R, Kawata M et al (1989) Hyperintense signal of the posterior pituitary on T1-weighted MR images: an experimental study. J Comput Assist Tomogr 13:371–377 source
plainstates a cause- Asserted: passes — The authors put it forward as true.
- Checkable: passes — It can be checked against evidence.
- Load-bearing: unclear — It is unclear whether the paper’s conclusions depend on it.
- Based: passes — The paper gives a reason why it holds.
In the paper
“In preterm infants, the gland is taller than in normal-term infants, even when correcting for gestational age.”
§ Magnetic resonance imaging of sellar and juxtasellar abnormalities in the paediatric population: an imaging review > Imaging characteristics in the paediatric population
What the sources say
- Not checked yetcites [6] Kiortsis D, Xydis V, Drougia AG et al (2004) The height of the pituitary in preterm infants during the first 2 years of life: An MRI study. Neuroradiology 46:224–226 source
plainstates an association- Asserted: passes — The authors put it forward as true.
- Checkable: passes — It can be checked against evidence.
- Load-bearing: unclear — It is unclear whether the paper’s conclusions depend on it.
- Based: passes — The paper gives a reason why it holds.
None of the sources cited for this claim have been checked yet.
In the paper
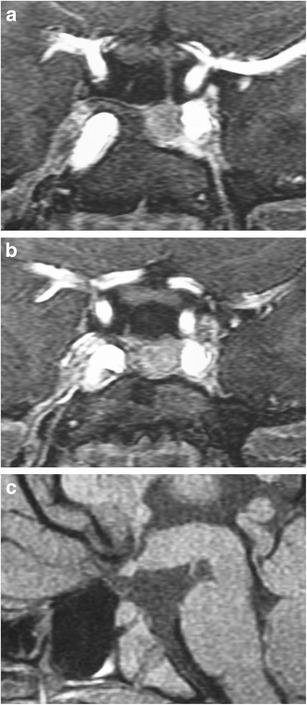
“MRI findings include duplicated pituitary stalks and glands within separate pituitary fossa in the sphenoid bone.”
§ Magnetic resonance imaging of sellar and juxtasellar abnormalities in the paediatric population: an imaging review > Developmental anomalies of the pituitary gland > Pituitary duplication (Fig. 7)
What the sources say
- Not checked yetcites [16] Slavotinek A, Parisi M, Heike C et al (2005) Craniofacial defects of blastogenesis: duplication of pituitary with cleft palate and orophgaryngeal tumors. Am J Med Genet A 135:13–20 source
- Not checked yetcites [18] Manjila S, Miller EA, Vadera S et al (2012) Duplication of the pituitary gland associated with multiple blastogenesis defects: duplication of the pituitary gland (DPG)-plus syndrome. Case report and review of literature. Surg Neurol Int 3:23 source
plain- Asserted: passes — The authors put it forward as true.
- Checkable: passes — It can be checked against evidence.
- Load-bearing: unclear — It is unclear whether the paper’s conclusions depend on it.
- Based: passes — The paper gives a reason why it holds.
19 more claims
Create a free account to see all 71 claims and to verify the 99 references still open.
- It may state two separate claims as one. 33
- Probably not a substantial claim. 24
Citations
Cites
The 2007 WHO Classification of Tumours of the Central Nervous System
Louis, D. N., Ohgaki, H., Wiestler, O. D., Cavenee, W. K., Burger, P. C., Jouvet, A., Scheithauer, B. W., & Kleihues, P. (2007) · Acta Neuropathologica · doi:10.1007/s00401-007-0243-4 · Cited by 15,397
Cotterill, S. J., Ahrens, S., Paulussen, M., Jürgens, H. F., Voûte, P. A., Gadner, H., & Craft, A. W. (2000) · Journal of Clinical Oncology · doi:10.1200/jco.2000.18.17.3108 · Cited by 1,040
Intracranial germ-cell tumors: natural history and pathogenesis
Jennings, M. T., Gelman, R., & Hochberg, F. (1985) · Journal of Neurosurgery · doi:10.3171/jns.1985.63.2.0155 · Cited by 839
Rosaí, J., & Dorfman, R. F. (1972) · Cancer · Cited by 600
Central Diabetes Insipidus in Children and Young Adults
Maghnie, M., Cosi, G., Genovese, E., Manca-Bitti, M. L., Cohen, A., Zecca, S., Tinelli, C., Gallucci, M., Bernasconi, S., Boscherini, B., et al. (2000) · New England Journal of Medicine · doi:10.1056/nejm200010053431403 · Cited by 483
Tuberculosis of the central nervous system: overview of neuroradiological findings
Bernaerts, A., Vanhoenacker, F. M., Parizel, P. M., Van Goethem, J. W. M., van Altena, R., Laridon, A., De Roeck, J., Coeman, V., & De Schepper, A. M. (2003) · European Radiology · doi:10.1007/s00330-002-1608-7 · Cited by 421
Case Report and Review of Literature
Maher, A. A., & Hennawy, A. E. (1994) · Cited by 413
Batchelor, T., & Loeffler, J. S. (2006) · Journal of Clinical Oncology · doi:10.1200/jco.2005.04.8819 · Cited by 362
Ultrastructure and Pathogenesis of Intracranial Arachnoid Cysts
Rengachary, S. S., & Watanabe, I. (1981) · Journal of Neuropathology and Experimental Neurology · doi:10.1097/00005072-198101000-00007 · Cited by 351
(1996) · Archives of Disease in Childhood · doi:10.1136/adc.75.1.17 · Cited by 294
Cited by
Imaging of the Sella and Parasellar Region in the Pediatric Population
Seeburg, D. P., Dremmen, M. H. G., & Huisman, T. A. G. M. (2016) · Neuroimaging Clinics of North America · doi:10.1016/j.nic.2016.08.004 · Cited by 28
Prevalence of pituitary cysts in children using modern magnetic resonance imaging techniques
Mahdi, E. S., Webb, R. L., & Whitehead, M. T. (2019) · Pediatric Radiology · doi:10.1007/s00247-019-04479-1 · Cited by 17
Wang, F., Han, J., Shang, X., & Li, G. (2019) · BMC Pediatrics · doi:10.1186/s12887-019-1819-6 · Cited by 15
Pituitary Stalk Interruption Syndrome: Report of Two Cases and Literature Review
Lichiardopol, C., & Albulescu, D. M. (2017) · Acta Endocrinologica (Bucharest) · doi:10.4183/aeb.2017.96 · Cited by 13
Diagnosing and treating anterior pituitary hormone deficiency in pediatric patients
Rey, R. A., Bergadá, I., Ballerini, M. G., Braslavsky, D. G., Chiesa, A. E., Freire, A. V., Grinspon, R. P., Keselman, A. C., & Arcari, A. J. (2023) · Reviews in Endocrine and Metabolic Disorders · doi:10.1007/s11154-023-09868-4 · Cited by 12
Metadata
- Authors
- Shields, R., Mangla, R., Almast, J., & Meyers, S.
- Affiliations
- University of Rochester Medicine (US)
- Corresponding author
- Shields, Rachel
- Venue
- Insights into Imaging
- Published
- 2015-03-21
- Volume
- 6
- Issue
- 2
- Pages
- 241-260
- ISSN
- 1869-4101 (ISSN-L)
- PMC
- PMC4376809
- OpenAlex
- W2125454623
- Cited by
- 18
- References
- 85
- Citations by year
- 2026: 3 · 2025: 1 · 2024: 1 · 2023: 5 · 2022: 1 · 2020: 1 · 2019: 4 · 2017: 1 · 2016: 1
- FWCI
- 0.44
- Type
- journal article
- Language
- en
- Open access
- gold
- doi.org
- Locations
- Insights into Imaging (publishedVersion, cc-by)
- PubMed (publishedVersion)
- PubMed Central (publishedVersion, cc-by)
- Topics
- Health Sciences › Medicine › Endocrinology, Diabetes and Metabolism › Pituitary Gland Disorders and Treatments
- Health Sciences › Medicine › Pediatrics, Perinatology and Child Health › Fetal and Pediatric Neurological Disorders
- Health Sciences › Medicine › Surgery › Head and Neck Surgical Oncology
- Keywords
- sellar region, congenital pituitary anomaly, developmental anomalies, MRI signal characteristics
About these checks
Registry, retraction, Cites and statistics results are computed, not judged, with one exception: a printed reference that no index lists is read once by a model before it counts as a citation error. Claims are extracted by a model and kept only when their quote appears verbatim in the text; each cited source is then checked, with a model’s help, for whether it says what the claim relies on. Those verdicts can be wrong — read the claim’s quote and the cited source before relying on one.
A language model drew the claims from the paper on 2026-11-14, under version 3 of the claim definition (model deepseek-v4.1-flash, prompt extract-v3).
A second model labelled each claim on 2026-11-14 (model jev-1.13-20260917, definition revision gold-guideline-v0.2).
Statistics and arithmetic are recomputed, not judged.
Confidence bands are shown only for fields calibrated on our annotated test set. None is calibrated yet, so no band is shown.
What counts as a claim ›How we measure confidence ›How we check this ›
Are you an author, or do you see a problem with this page? Request a review
Data sources
Bibliographic data: Semantic Scholar, OpenAlex, Crossref.
Contains information from the Semantic Scholar Academic Graph Datasets, made available under the ODC Attribution License (ODC-BY 1.0).
Semantic Scholar’s data is described in: Kinney, R., et al. (2023). The Semantic Scholar Open Data Platform. arXiv:2301.10140.
