

The DOI matches its Crossref record; 2 of the 2 references it cites were found in a registry or an index.
Nucleus size and its effect on nucleosome stability in living cells
Open accessPublished version of a preprint
Abstract
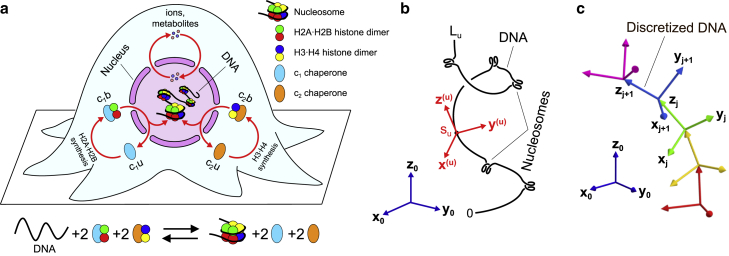
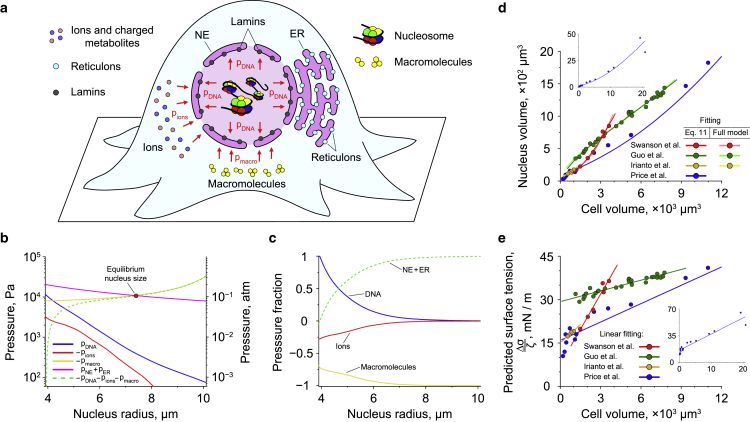
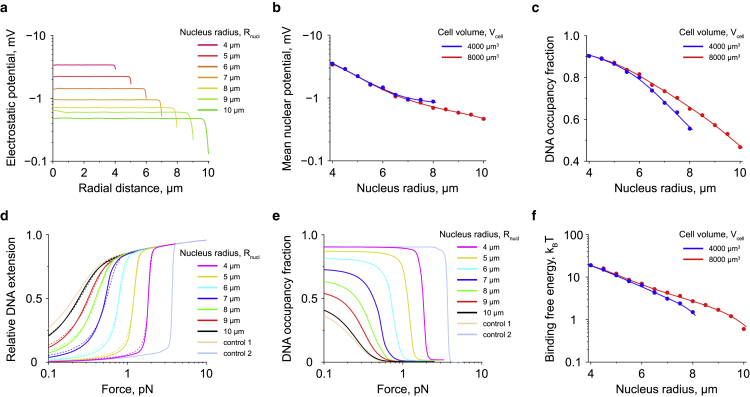
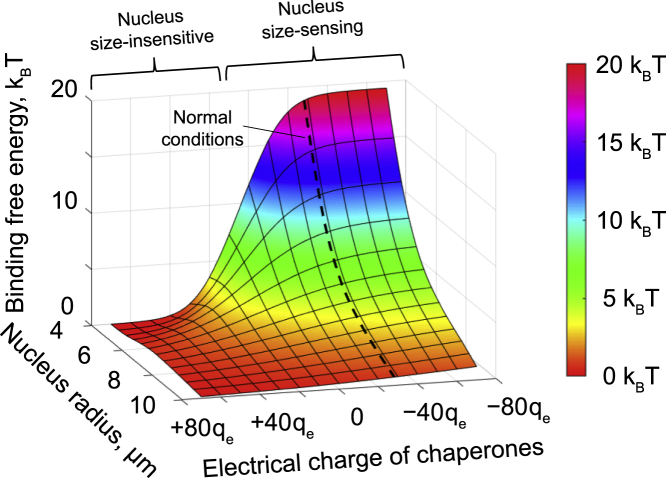
DNA architectural proteins play a major role in organization of chromosomal DNA in living cells by packaging it into chromatin, whose spatial conformation is determined by an intricate interplay between the DNA-binding properties of architectural proteins and physical constraints applied to the DNA by a tight nuclear space. Yet, the exact effects of the nucleus size on DNA-protein interactions and chromatin structure currently remain obscure. Furthermore, there is even no clear understanding of molecular mechanisms responsible for the nucleus size regulation in living cells. To find answers to these questions, we developed a general theoretical framework based on a combination of polymer field theory and transfer-matrix calculations, which showed that the nucleus size is mainly determined by the difference between the surface tensions of the nuclear envelope and the endoplasmic reticulum membrane as well as the osmotic pressure exerted by cytosolic macromolecules on the nucleus. In addition, the model demonstrated that the cell nucleus functions as a piezoelectric element, changing its electrostatic potential in a size-dependent manner. This effect has been found to have a profound impact on stability of nucleosomes, revealing a previously unknown link between the nucleus size and chromatin structure. Overall, our study provides new insights into the molecular mechanisms responsible for regulation of the nucleus size, as well as the potential role of nuclear organization in shaping the cell response to environmental cues.
Overview
The claims and statistics of this paper haven’t been checked yet.
Run the check — free, no account needed. It reads the open-access text and checks the sources it cites.
Integrity signals
Registry
Cites
Statistics
Figures
Verification
Claims the paper makes
The claims and statistics of this paper haven’t been checked yet.
Run the check — free, no account needed. It reads the open-access text and checks the sources it cites.
Self-check
Percentages, sums and reported differences re-computed from the paper’s own numbers.
The self-check needs the paper’s full text.
Citations
Cites
Numerical Methods for Large Eigenvalue Problems: Revised Edition
Saad, Y. (2011) · doi:10.1137/1.9781611970739 · Cited by 2,364
Milo, R. (2013) · BioEssays · doi:10.1002/bies.201300066 · Cited by 614
Research works printed but not linked: 112
- Webster, 2009, Sizing up the nucleus: nuclear shape, size and nuclear-envelope assembly, J. Cell Sci., 122, 1477, 10.1242/jcs.037333 · DOI
- Jevtić, 2014, Sizing and shaping the nucleus: mechanisms and significance, Curr. Opin. Cell Biol., 28, 16, 10.1016/j.ceb.2014.01.003 · DOI
- Walters, 2012, Shaping the nucleus: factors and forces, J. Cell. Biochem., 113, 2813, 10.1002/jcb.24178 · DOI
- Mukherjee, 2016, Recent advances in understanding nuclear size and shape, Nucleus, 7, 167, 10.1080/19491034.2016.1162933 · DOI
- Cantwell, 2019, Unravelling nuclear size control, Curr. Genet., 65, 1281, 10.1007/s00294-019-00999-3 · DOI
- Martinov, 1999, Volume stabilization in human erythrocytes: combined effects of Ca2+-dependent potassium channels and adenylate metabolism, Biophys. Chem., 80, 199, 10.1016/S0301-4622(99)00079-4 · DOI
- Kay, 2017, How cells can control their size by pumping ions, Front. Cell Dev. Biol., 5, 41, 10.3389/fcell.2017.00041 · DOI
- Dahl, 2004, The nuclear envelope lamina network has elasticity and a compressibility limit suggestive of a molecular shock absorber, J. Cell Sci., 117, 4779, 10.1242/jcs.01357 · DOI
- Mazumder, 2008, Dynamics of chromatin decondensation reveals the structural integrity of a mechanically prestressed nucleus, Biophys. J., 95, 3028, 10.1529/biophysj.108.132274 · DOI
- Finan, 2009, Nonlinear osmotic properties of the cell nucleus, Ann. Biomed. Eng., 37, 477, 10.1007/s10439-008-9618-5 · DOI
- Stephens, 2017, Chromatin and lamin A determine two different mechanical response regimes of the cell nucleus, Mol. Biol. Cell, 28, 1984, 10.1091/mbc.e16-09-0653 · DOI
- Aebi, 1986, The nuclear lamina is a meshwork of intermediate-type filaments, Nature, 323, 560, 10.1038/323560a0 · DOI
- Newport, 1990, A lamin-independent pathway for nuclear envelope assembly, J. Cell Biol., 111, 2247, 10.1083/jcb.111.6.2247 · DOI
- Yang, 1997, Lamin-binding fragment of LAP2 inhibits increase in nuclear volume during the cell cycle and progression into S phase, J. Cell Biol., 139, 1077, 10.1083/jcb.139.5.1077 · DOI
- Goldberg, 2008, Filaments made from A- and B-type lamins differ in structure and organization, J. Cell Sci., 121, 215, 10.1242/jcs.022020 · DOI
- Anderson, 2008, Reshaping of the endoplasmic reticulum limits the rate for nuclear envelope formation, J. Cell Biol., 182, 911, 10.1083/jcb.200805140 · DOI
- Lu, 2012, Nesprin interchain associations control nuclear size, Cell. Mol. Life Sci., 69, 3493, 10.1007/s00018-012-1034-1 · DOI
- Price, 1973, Correlations between nuclear volume, cell volume and DNA content in meristematic cells of herbaceous angiosperms, Experientia, 29, 1028, 10.1007/BF01930444 · DOI
- Swanson, 1991, Cellular dimensions affecting the nucleocytoplasmic volume ratio, J. Cell Biol., 115, 941, 10.1083/jcb.115.4.941 · DOI
- Neumann, 2007, Nuclear size control in fission yeast, J. Cell Biol., 179, 593, 10.1083/jcb.200708054 · DOI
- Guo, 2017, Cell volume change through water efflux impacts cell stiffness and stem cell fate, Proc. Natl. Acad. Sci. USA, 114, E8618, 10.1073/pnas.1705179114 · DOI
- Delpire, 1985, Effects of osmotic shocks on the ultrastructure of different tissues and cell types, Exp. Cell Res., 160, 106, 10.1016/0014-4827(85)90240-X · DOI
- Hancock, 2004, A role for macromolecular crowding effects in the assembly and function of compartments in the nucleus, J. Struct. Biol., 146, 281, 10.1016/j.jsb.2003.12.008 · DOI
- Irianto, 2013, Osmotic challenge drives rapid and reversible chromatin condensation in chondrocytes, Biophys. J., 104, 759, 10.1016/j.bpj.2013.01.006 · DOI
- Damodaran, 2018, Compressive force induces reversible chromatin condensation and cell geometry-dependent transcriptional response, Mol. Biol. Cell, 29, 3039, 10.1091/mbc.E18-04-0256 · DOI
- Harris, 1967, The reactivation of the red cell nucleus, J. Cell Sci., 2, 23, 10.1242/jcs.2.1.23 · DOI
- Sato, 1994, Transcription and motoneuron size, J. Neurochem., 63, 1609, 10.1046/j.1471-4159.1994.63051609.x · DOI
- Solovei, 2009, Nuclear architecture of rod photoreceptor cells adapts to vision in mammalian evolution, Cell, 137, 356, 10.1016/j.cell.2009.01.052 · DOI
- Sachs, 1995, A random-walk/giant-loop model for interphase chromosomes, Proc. Natl. Acad. Sci. USA, 92, 2710, 10.1073/pnas.92.7.2710 · DOI
- Rosa, 2008, Structure and dynamics of interphase chromosomes, PLoS Comput. Biol., 4, e1000153, 10.1371/journal.pcbi.1000153 · DOI
- Lieberman-Aiden, 2009, Comprehensive mapping of long-range interactions reveals folding principles of the human genome, Science, 326, 289, 10.1126/science.1181369 · DOI · Paper page
- Kim, 2011, Crowding-induced structural alterations of random-loop chromosome model, Phys. Rev. Lett., 106, 168102, 10.1103/PhysRevLett.106.168102 · DOI
- Mirny, 2011, The fractal globule as a model of chromatin architecture in the cell, Chromosome Res., 19, 37, 10.1007/s10577-010-9177-0 · DOI
- Barbieri, 2012, Complexity of chromatin folding is captured by the strings and binders switch model, Proc. Natl. Acad. Sci. USA, 109, 16173, 10.1073/pnas.1204799109 · DOI · Paper page
- Benedetti, 2014, Models that include supercoiling of topological domains reproduce several known features of interphase chromosomes, Nucleic Acids Res., 42, 2848, 10.1093/nar/gkt1353 · DOI · Paper page
- Chiariello, 2016, Polymer physics of chromosome large-scale 3D organisation, Sci. Rep., 6, 29775, 10.1038/srep29775 · DOI
- Pierro, 2016, Transferable model for chromosome architecture, Proc. Natl. Acad. Sci. USA, 113, 12168, 10.1073/pnas.1613607113 · DOI
- Pierro, 2017, De novo prediction of human chromosome structures: epigenetic marking patterns encode genome architecture, Proc. Natl. Acad. Sci. USA, 114, 12126, 10.1073/pnas.1714980114 · DOI
- Nuebler, 2018, Chromatin organization by an interplay of loop extrusion and compartmental segregation, Proc. Natl. Acad. Sci. USA, 115, E6697, 10.1073/pnas.1717730115 · DOI
- Knoch, 2019, Simulation of different three-dimensional polymer models of interphase chromosomes compared to experiments – an evaluation and review framework of the 3D genome organization, Semin. Cell Dev. Biol., 90, 19, 10.1016/j.semcdb.2018.07.012 · DOI
- Blank, 1995, Electrostatic mechanism of nucleosome spacing, J. Mol. Biol., 252, 305, 10.1006/jmbi.1995.0498 · DOI
- Engelhardt, 2004, Condensation of chromatin in situ by cation-dependent charge shielding and aggregation, Biochem. Biophys. Res. Commun., 324, 1210, 10.1016/j.bbrc.2004.09.175 · DOI
- Dahl, 2005, Power-law rheology of isolated nuclei with deformation mapping of nuclear substructures, Biophys. J., 89, 2855, 10.1529/biophysj.105.062554 · DOI
- Pajerowski, 2007, Physical plasticity of the nucleus in stem cell differentiation, Proc. Natl. Acad. Sci. USA, 104, 15619, 10.1073/pnas.0702576104 · DOI
- Allahverdi, 2015, Chromatin compaction under mixed salt conditions: opposite effects of sodium and potassium ions on nucleosome array folding, Sci. Rep., 5, 8512, 10.1038/srep08512 · DOI
- Efremov, 2016, Transfer-matrix calculation of DNA polymer micromechanics under tension and torque constraints, Phys. Rev. E, 94, 032404, 10.1103/PhysRevE.94.032404 · DOI
- Efremov, 2017, Theoretical methods for studying DNA structural transitions under applied mechanical constraints, Polymers, 9, 74, 10.3390/polym9020074 · DOI
- Efremov, 2018, Transfer-matrix calculations of the effects of tension and torque constraints on DNA-protein interactions, Nucleic Acids Res., 46, 6504, 10.1093/nar/gky478 · DOI
- Mazurkiewicz, 2006, On the mechanism of nucleosome assembly by histone chaperone NAP1, J. Biol. Chem., 281, 16462, 10.1074/jbc.M511619200 · DOI
- Andrews, 2008, A thermodynamic model for Nap1-histone interactions, J. Biol. Chem., 283, 32412, 10.1074/jbc.M805918200 · DOI
- Andrews, 2010, The histone chaperone Nap1 promotes nucleosome assembly by eliminating nonnucleosomal histone DNA interactions, Mol. Cell, 37, 834, 10.1016/j.molcel.2010.01.037 · DOI
- De Koning, 2007, Histone chaperones: an escort network regulating histone traffic, Nat. Struct. Mol. Biol., 14, 997, 10.1038/nsmb1318 · DOI
- Hammond, 2017, Histone chaperone networks shaping chromatin function, Nat. Rev. Mol. Cell Biol., 18, 141, 10.1038/nrm.2016.159 · DOI
- Keck, 2012, Histone chaperones link histone nuclear import and chromatin assembly, Biochim. Biophys. Acta, 1819, 277, 10.1016/j.bbagrm.2011.09.007 · DOI
- Lee, 2000, Chondrocyte deformation within compressed agarose constructs at the cellular and sub-cellular levels, J. Biomech., 33, 81, 10.1016/S0021-9290(99)00160-8 · DOI
- Century, 1970, The concentrations of water, sodium and potassium in the nucleus and cytoplasm of amphibian oocytes, J. Cell Sci., 7, 5, 10.1242/jcs.7.1.5 · DOI
- Oberleithner, 1992, Patchy accumulation of apical Na+ transporters allows cross talk between extracellular space and cell nucleus, Proc. Natl. Acad. Sci. USA, 89, 241, 10.1073/pnas.89.1.241 · DOI
- Fazelkhah, 2018, Quantitative model for ion transport and cytoplasm conductivity of Chinese hamster ovary cells, Sci. Rep., 8, 17818, 10.1038/s41598-018-36127-3 · DOI
- Luger, 1997, Crystal structure of the nucleosome core particle at 2.8Å resolution, Nature, 389, 251, 10.1038/38444 · DOI · Paper page
- Harp, 2000, Asymmetries in the nucleosome core particle at 2.5Å resolution, Acta Crystallogr. Sect. D - Biol. Crystallogr., D56, 1513, 10.1107/S0907444900011847 · DOI
- McCormack, 2021, Effects of size, cooperativity and competitive binding on protein positioning on DNA, Biophys. J., 120, 2040, 10.1016/j.bpj.2021.03.016 · DOI
- Segal, 2006, A genomic code for nucleosome positioning, Nature, 442, 772, 10.1038/nature04979 · DOI
- Field, 2008, Distinct modes of regulation by chromatin encoded through nucleosome positioning signals, PLoS Comput. Biol., 4, e1000216, 10.1371/journal.pcbi.1000216 · DOI
- Kaplan, 2009, The DNA-encoded nucleosome organization of a eukaryotic genome, Nature, 458, 362, 10.1038/nature07667 · DOI
- Möbius, 2010, Quantitative test of the barrier nucleosome model for statistical positioning of nucleosomes up- and downstream of transcription start sites, PLoS Comput. Biol., 6, e1000891, 10.1371/journal.pcbi.1000891 · DOI
- Beshnova, 2014, Regulation of the nucleosome repeat length in vivo by the DNA sequence, protein concentrations and long-range interactions, PLoS Comput. Biol., 10, e1003698, 10.1371/journal.pcbi.1003698 · DOI
- MacPherson, 2018, Bottom-up modeling of chromatin segregation due to epigenetic modifications, Proc. Natl. Acad. Sci. USA, 115, 12739, 10.1073/pnas.1812268115 · DOI
- MacPherson, 2020, Chromatin compaction leads to a preference for peripheral heterochromatin, Biophys. J., 118, 1479, 10.1016/j.bpj.2020.01.034 · DOI
- Lagarias, 1998, Convergence properties of the Nelder-Mead simplex method in low dimensions, SIAM J. Optim., 9, 112, 10.1137/S1052623496303470 · DOI
- Bustamante, 1994, Entropic elasticity of lambda-phage DNA, Science, 265, 1599, 10.1126/science.8079175 · DOI
- Wang, 1997, Stretching DNA with optical tweezers, Biophys. J., 72, 1335, 10.1016/S0006-3495(97)78780-0 · DOI
- Kindt, 2001, DNA packaging and ejection forces in bacteriophage, Proc. Natl. Acad. Sci. USA, 98, 13671, 10.1073/pnas.241486298 · DOI
- Spakowitz, 2005, DNA packaging in bacteriophage: is twist important?, Biophys. J., 88, 3912, 10.1529/biophysj.104.052738 · DOI
- Lander, 2006, The structure of an infectious P22 virion shows the signal for headful DNA packaging, Science, 312, 1791, 10.1126/science.1127981 · DOI
- Morrison, 2009, Semiflexible chains in confined spaces, Phys. Rev. E, 79, 011924, 10.1103/PhysRevE.79.011924 · DOI
- Liu, 2014, Solid-to-fluid–like DNA transition in viruses facilitates infection, Proc. Natl. Acad. Sci. USA, 111, 14675, 10.1073/pnas.1321637111 · DOI
- Evilevitch, 2003, Osmotic pressure inhibition of DNA ejection from phage, Proc. Natl. Acad. Sci. USA, 100, 9292, 10.1073/pnas.1233721100 · DOI
- Grayson, 2006, The effect of genome length on ejection forces in bacteriophage lambda, Virology, 348, 430, 10.1016/j.virol.2006.01.003 · DOI
- Qiu, 2011, Salt-dependent DNA-DNA spacings in intact bacteriophage λ reflect relative importance of DNA self-repulsion and bending energies, Phys. Rev. Lett., 106, 028102, 10.1103/PhysRevLett.106.028102 · DOI
- Bryant, 2003, Structural transitions and elasticity from torque measurements on DNA, Nature, 424, 338, 10.1038/nature01810 · DOI
- Forth, 2008, Abrupt buckling transition observed during the plectoneme formation of individual DNA molecules, Phys. Rev. Lett., 100, 148301, 10.1103/PhysRevLett.100.148301 · DOI
- Mosconi, 2009, Measurement of the torque on a single stretched and twisted DNA using magnetic tweezers, Phys. Rev. Lett., 102, 078301, 10.1103/PhysRevLett.102.078301 · DOI
- Castro-Villarreal, 2019, Stochastic curvature of enclosed semiflexible polymers, Phys. Rev. E, 100, 012503, 10.1103/PhysRevE.100.012503 · DOI
- Kanno, 1963, A study of the nucleus and cell membranes of oocytes with an intra-cellular electrode, Exp. Cell Res., 31, 149, 10.1016/0014-4827(63)90164-2 · DOI
- Mazzanti, 1990, Ion channels in the nuclear envelope, Nature, 343, 764, 10.1038/343764a0 · DOI
- Zhou, 2009, Universal behavior of the osmotically compressed cell and its analogy to the colloidal glass transition, Proc. Natl. Acad. Sci. USA, 106, 10632, 10.1073/pnas.0901462106 · DOI
- Evans, 1976, Elastic area compressibility modulus of red cell membrane, Biophys. J., 16, 585, 10.1016/S0006-3495(76)85713-X · DOI
- Hategan, 2003, Adhesively-tensed cell membranes: lysis kinetics and atomic force microscopy probing, Biophys. J., 85, 2746, 10.1016/S0006-3495(03)74697-9 · DOI
- Butler, 2009, Changing nuclear landscape and unique PML structures during early epigenetic transitions of human embryonic stem cells, J. Cell. Biochem., 107, 609, 10.1002/jcb.22183 · DOI
- Yan, 2007, Micromanipulation studies of chromatin fibers in Xenopus egg extracts reveal ATP-dependent chromatin assembly dynamics, Mol. Biol. Cell, 18, 464, 10.1091/mbc.e06-09-0800 · DOI
- Meng, 2015, Quantitative analysis of single-molecule force spectroscopy on folded chromatin fibers, Nucleic Acids Res., 43, 3578, 10.1093/nar/gkv215 · DOI
- Levy, 2010, Nuclear size is regulated by importin α and Ntf2 in Xenopus, Cell, 143, 288, 10.1016/j.cell.2010.09.012 · DOI
- Edens, 2014, cPKC regulates interphase nuclear size during Xenopus development, J. Cell Biol., 206, 473, 10.1083/jcb.201406004 · DOI
- Deviri, 2021, Balance of osmotic pressures determines the volume of the cell nucleus, bioRxiv
- Wu, 2022, The correlation between cell and nucleus size is explained by an eukaryotic cell growth model, PLoS Comput. Biol., 18, e1009400, 10.1371/journal.pcbi.1009400 · DOI · Paper page
- Alisafaei, 2019, Regulation of nuclear architecture, mechanics, and nucleocytoplasmic shuttling of epigenetic factors by cell geometric constraints, Proc. Natl. Acad. Sci. USA, 116, 13200, 10.1073/pnas.1902035116 · DOI
- Wang, 2002, Micropatterning tractional forces in living cells, Cell Motil Cytoskeleton, 52, 97, 10.1002/cm.10037 · DOI
- Makhija, 2016, Nuclear deformability and telomere dynamics are regulated by cell geometric constraints, Proc. Natl. Acad. Sci. USA, 113, E32, 10.1073/pnas.1513189113 · DOI
- Chu, 2017, On the origin of shape fluctuations of the cell nucleus, Proc. Natl. Acad. Sci. USA, 114, 10338, 10.1073/pnas.1702226114 · DOI
- Dupont, 2011, Role of YAP/TAZ in mechanotransduction, Nature, 474, 179, 10.1038/nature10137 · DOI · Paper page
- Jain, 2013, Cell geometric constraints induce modular gene-expression patterns via redistribution of HDAC3 regulated by actomyosin contractility, Proc. Natl. Acad. Sci. USA, 110, 11349, 10.1073/pnas.1300801110 · DOI
- Benham-Pyle, 2015, Mechanical strain induces E-cadherin–dependent Yap1 and β-catenin activation to drive cell cycle entry, Science, 348, 1024, 10.1126/science.aaa4559 · DOI
- Buxboim, 2017, Coordinated increase of nuclear tension and lamin-A with matrix stiffness outcompetes lamin-B receptor that favors soft tissue phenotypes, Mol. Biol. Cell, 28, 3333, 10.1091/mbc.e17-06-0393 · DOI
- Weidemann, 2003, Counting nucleosomes in living cells with a combination of fluorescence correlation spectroscopy and confocal imaging, J. Mol. Biol., 334, 229, 10.1016/j.jmb.2003.08.063 · DOI
- Raveh-Sadka, 2012, Manipulating nucleosome disfavoring sequences allows fine-tune regulation of gene expression in yeast, Nat. Genet., 44, 743, 10.1038/ng.2305 · DOI
- Schmidt, 1995, Cell size regulation, a mechanism that controls cellular RNA accumulation: consequences on regulation of the ubiquitous transcription factors Oct1 and NF-Y, and the liver-enriched transcription factor DBP, J. Cell Biol., 128, 467, 10.1083/jcb.128.4.467 · DOI
- Yen, 1979, Role of nuclear size in cell growth initiation, Science, 204, 1315, 10.1126/science.451539 · DOI
- Fidorra, 1981, Cellular and nuclear volume of human cells during the cell cycle, Radiat. Environ. Biophys., 19, 205, 10.1007/BF01324188 · DOI
- Salem, 1998, Changes in the rate of RNA synthesis during the cell cycle, Anat. Rec., 250, 6, 10.1002/(SICI)1097-0185(199801)250:1<6::AID-AR2>3.0.CO;2-4 · DOI
- Mosammaparast, 2002, A role for nucleosome assembly protein 1 in the nuclear transport of histones H2A and H2B, EMBO J., 21, 6527, 10.1093/emboj/cdf647 · DOI
- Mosammaparast, 2002, Pathways mediating the nuclear import of histones H3 and H4 in yeast, J. Biol. Chem., 277, 862, 10.1074/jbc.M106845200 · DOI
- Roy, 2017, Laterally confined growth of cells induces nuclear reprogramming in the absence of exogenous biochemical factors, Proc. Natl. Acad. Sci. USA, 115, E4741
Metadata
- Authors
- Efremov, A. K., Hovan, L., & Yan, J.
- Affiliations
- National University of Singapore (SG)
- University of Geneva (CH)
- Corresponding author
- Efremov, Artem K.
- Venue
- Biophysical Journal
- Publisher
- Elsevier BV
- Published
- 2022-11
- Volume
- 121
- Issue
- 21
- Pages
- 4189-4204
- ISSN
- 0006-3495 (ISSN-L)
- PMC
- PMC9675033
- OpenAlex
- W4296799747
- Cited by
- 21
- References
- 2
- Citations by year
- 2026: 4 · 2025: 6 · 2024: 8 · 2023: 1 · 2022: 2
- FWCI
- 1.39
- Type
- journal article
- Language
- en
- Open access
- hybrid
- doi.org
- Licence
- Locations
- Biophysical Journal (publishedVersion, cc-by)
- bioRxiv (Cold Spring Harbor Laboratory) (acceptedVersion, cc-by)
- PubMed Central (publishedVersion, cc-by)
- PubMed (publishedVersion)
- Funders
- National Research Foundation Singapore
- Ministry of Education - Singapore
- National University of Singapore Mechanobiology Institute
- Shenzhen Bay Laboratory
- Topics
- Life Sciences › Biochemistry, Genetics and Molecular Biology › Molecular Biology › Nuclear Structure and Function
- Life Sciences › Biochemistry, Genetics and Molecular Biology › Molecular Biology › Genomics and Chromatin Dynamics
- Life Sciences › Biochemistry, Genetics and Molecular Biology › Molecular Biology › Protein Structure and Dynamics
- Keywords
- nuclear size, nucleosome stability, chromatin structure, endoplasmic reticulum membrane, osmotic pressure, piezoelectric properties, polymer field theory, nuclear organization
- MeSH terms
- Cell Nucleus, Chromatin, DNA, Nucleosomes, Cell Nucleus Size
About these checks
Registry, retraction, Cites and statistics results are computed, not judged, with one exception: a printed reference that no index lists is read once by a model before it counts as a citation error. Claims are extracted by a model and kept only when their quote appears verbatim in the text; each cited source is then checked, with a model’s help, for whether it says what the claim relies on. Those verdicts can be wrong — read the claim’s quote and the cited source before relying on one.
Statistics and arithmetic are recomputed, not judged.
Confidence bands are shown only for fields calibrated on our annotated test set. None is calibrated yet, so no band is shown.
What counts as a claim ›How we measure confidence ›How we check this ›
Are you an author, or do you see a problem with this page? Request a review
How to cite
Cite CoChat for the checks on this page, and the paper for its own findings.
- This page
- CoChat. (2026). Citation check: Nucleus size and its effect on nucleosome stability in living cells. https://app.cochat.ai/papers/10.1016/j.bpj.2022.09.019
- The paper
- Efremov, A. K., Hovan, L., & Yan, J. (2022). Nucleus size and its effect on nucleosome stability in living cells. Biophysical Journal. https://doi.org/10.1016/j.bpj.2022.09.019
