

The DOI matches its Crossref record; 53 of the 55 references it cites were found in a registry or an index.
Neuronavigation maximizes accuracy and precision in TMS positioning: Evidence from 11,230 distance, angle, and electric field modeling measurements
Open accessAbstract
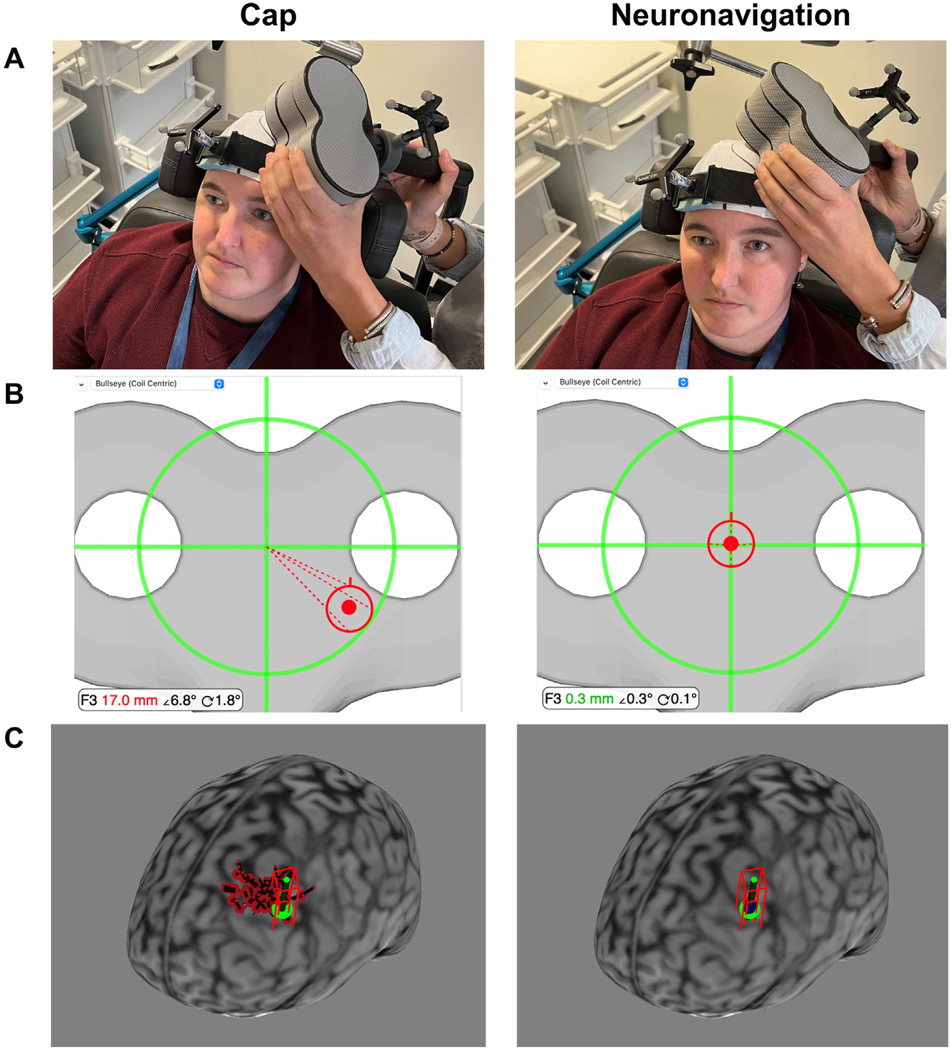
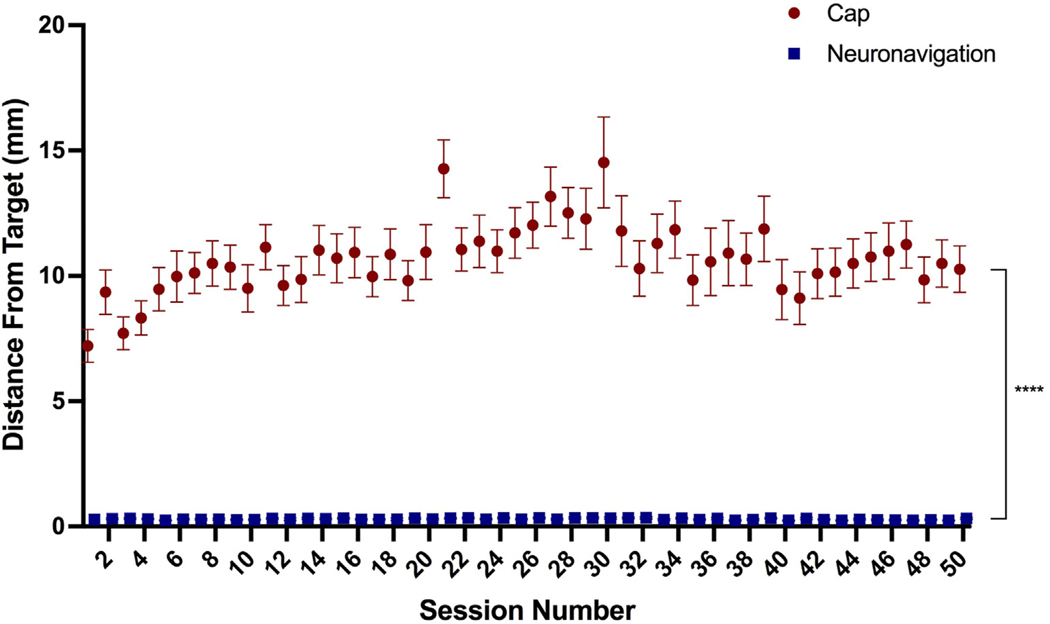
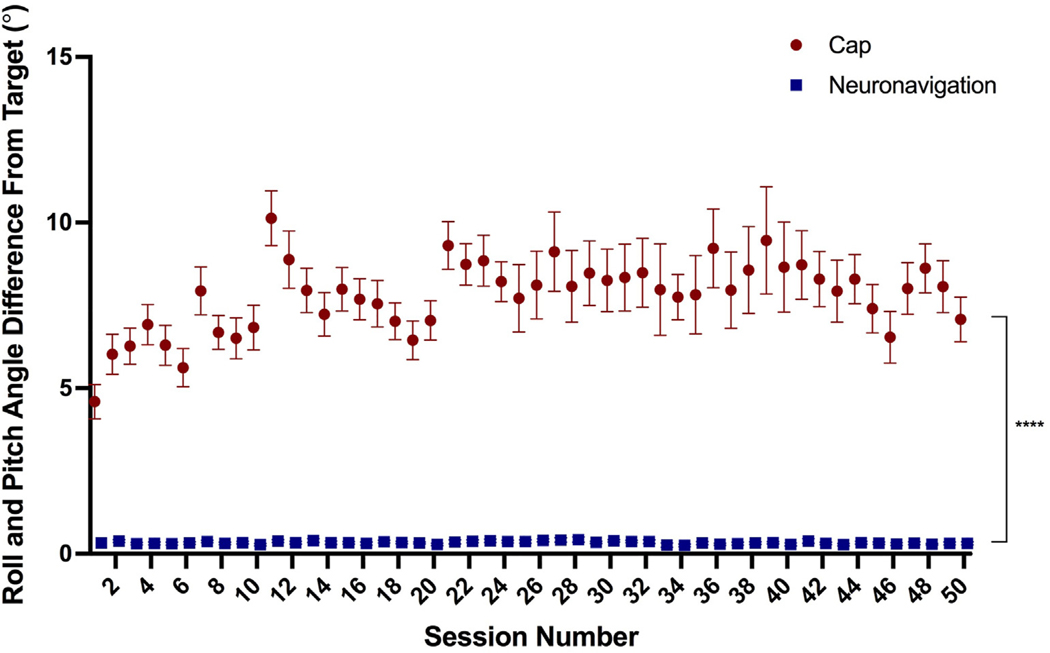
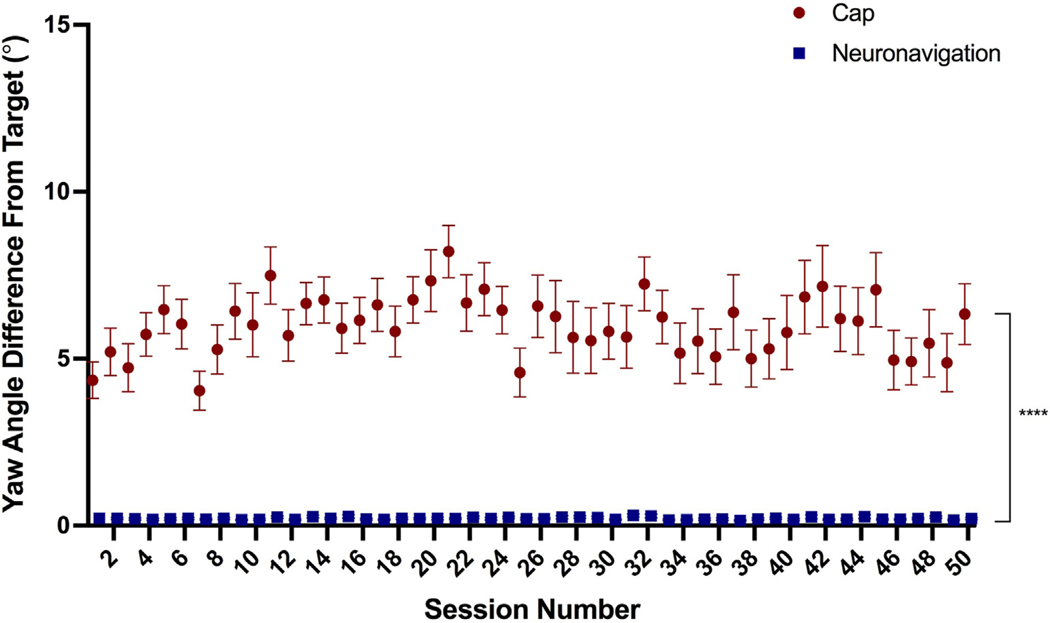
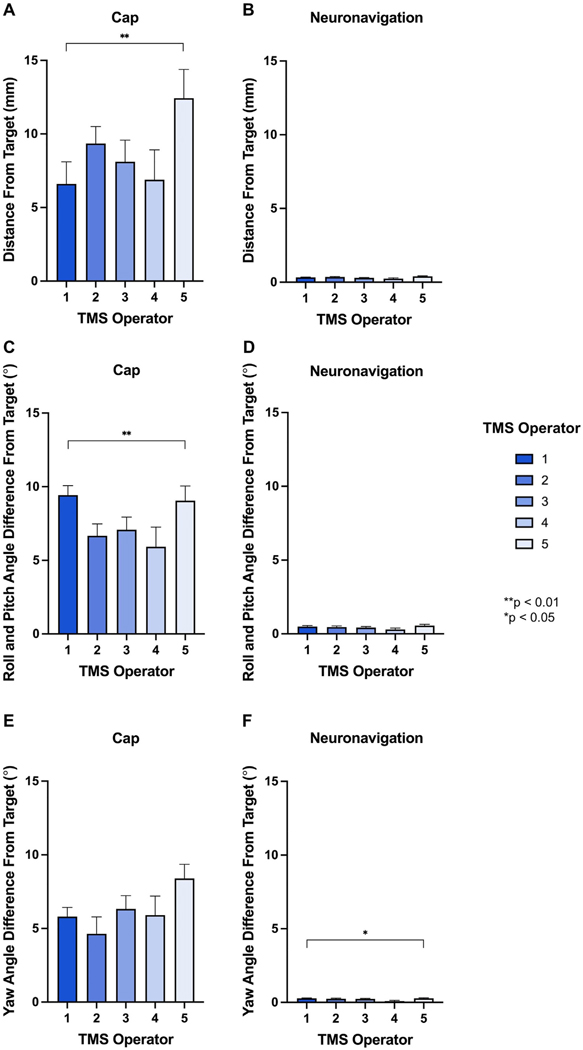
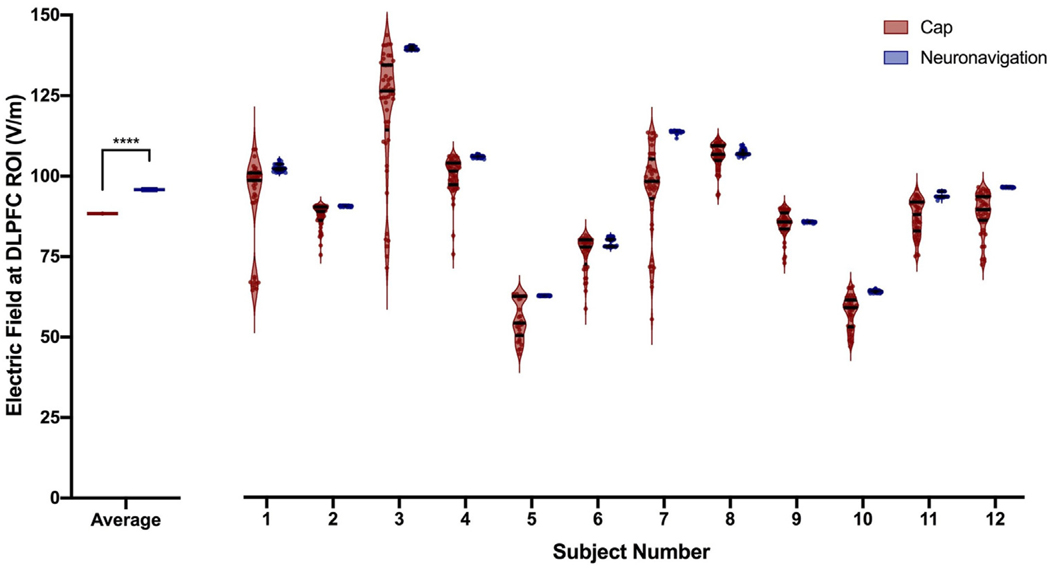
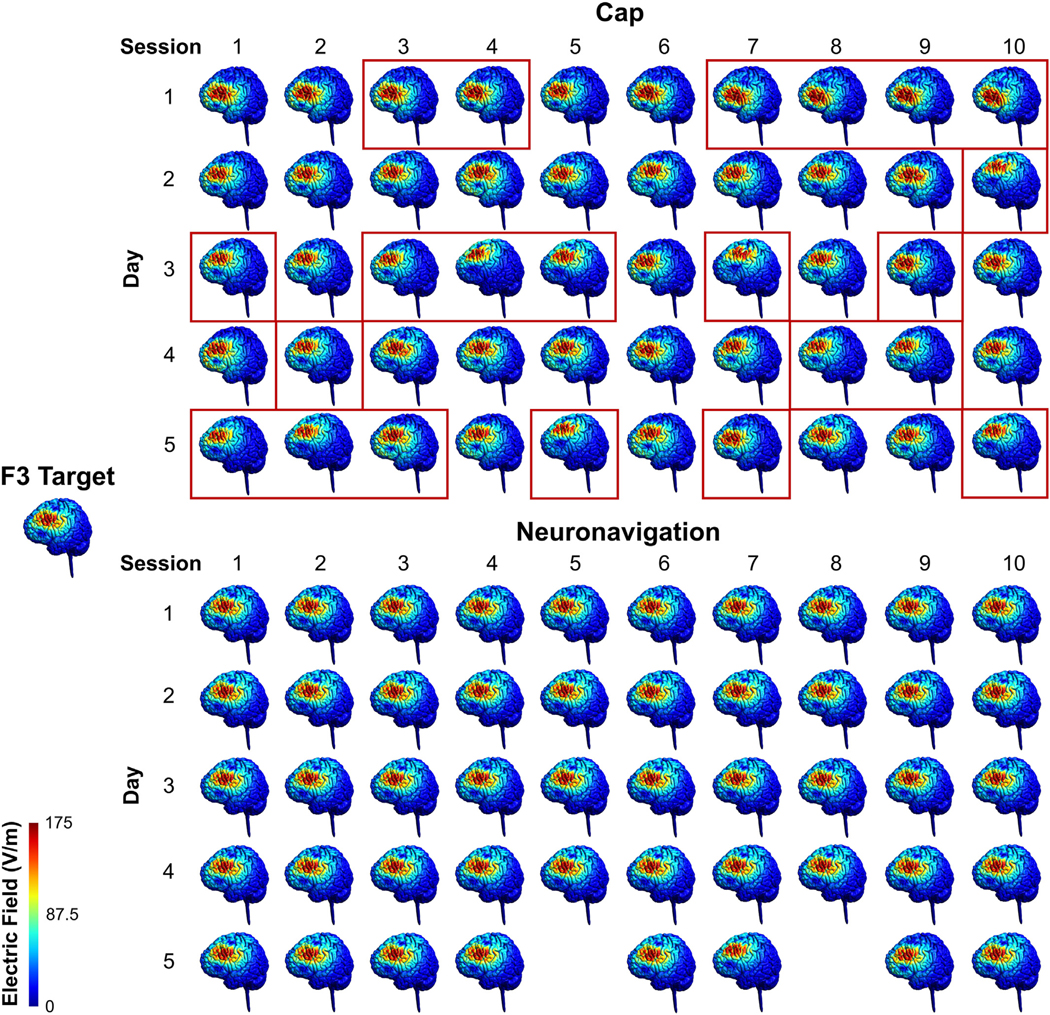
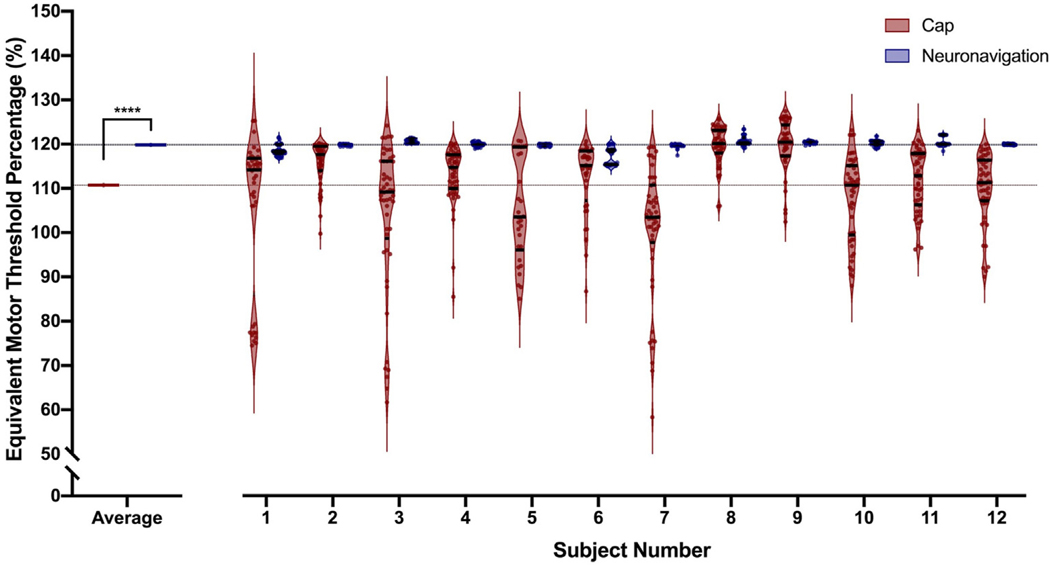
BACKGROUND: Researchers and clinicians have traditionally relied on elastic caps with markings to reposition the transcranial magnetic stimulation (TMS) coil between trains and sessions. Newer neuronavigation technology co-registers the patient's head and structural magnetic resonance imaging (MRI) scan, providing the researcher with real-time feedback about how to adjust the coil to be on-target. However, there has been no head to head comparison of accuracy and precision across treatment sessions. OBJECTIVE: /Hypothesis: In this two-part study, we compared elastic cap and neuronavigation targeting methodologies on distance, angle, and electric field (E-field) magnitude values. METHODS: In 42 participants receiving up to 50 total accelerated rTMS sessions in 5 days, we compared cap and neuronavigation targeting approaches in 3408 distance and 6816 angle measurements. In Experiment 1, TMS administrators saved an on-target neuronavigation location at Beam F3, which served as the landmark for all other measurements. Next, the operators placed the TMS coil based on cap markings or neuronavigation software to measure the distance and angle differences from the on-target sample. In Experiment 2, we saved each XYZ coordinate of the TMS coil from cap and neuronavigation targeting in 12 participants to compare the E-field magnitude differences at the cortical prefrontal target in 1106 cap and neuronavigation models. RESULTS: Cap targeting was significantly off-target for distance, placing the coil an average of 10.66 mm off-target (Standard error of the mean; SEM = 0.19 mm) compared to 0.3 mm (SEM = 0.03 mm) for neuronavigation (p < 0.0001). Cap targeting also significantly deviated for angles off-target, averaging 7.79 roll/pitch degrees (SEM = 1.07°) off-target and 5.99 yaw degrees (SEM = 0.12°) off-target; in comparison, neuronavigation targeting positioned the coil 0.34 roll/pitch degrees (SEM = 0.01°) and 0.22 yaw (SEM = 0.004°) off-target (both p < 0.0001). Further analyses revealed that there were significant inter-operator differences on distance and angle positioning for F3 (all p < 0.05), but not neuronavigation. Lastly, cap targeting resulted in significantly lower E-fields at the intended prefrontal cortical target, with equivalent E-fields as 110.7% motor threshold (MT; range = 58.3-127.4%) stimulation vs. 119.9% MT (range = 115-123.3%) from neuronavigated targeting with 120% MT stimulation applied (p < 0.001). CONCLUSIONS: Cap-based targeting is an inherent source of target variability compared to neuronavigation. Additionally, cap-based coil placement is more prone to differences across operators. Off-target coil placement secondary to cap-based measurements results in significantly lower amounts of stimulation reaching the cortical target, with some individuals receiving only 48.6% of the intended on-target E-field. Neuronavigation technology enables more precise and accurate TMS positioning, resulting in the intended stimulation intensities at the targeted cortical level.
Overview
The claims and statistics of this paper haven’t been checked yet.
Run the check — free, no account needed. It reads the open-access text and checks the sources it cites.
Integrity signals
Registry
Cites
Statistics
Figures
Verification
Claims the paper makes
The claims and statistics of this paper haven’t been checked yet.
Run the check — free, no account needed. It reads the open-access text and checks the sources it cites.
Claims other papers make about this one
Each is checked against this paper’s own text: does it say what the citing paper says it does?
The source backs part of the claim, not all of it — or backs it for a different population, condition or comparison.
In the citing paper
“A Brainsight Neuronavigation system (Version 2.4.8) ensured accuracy, reliability, and reproducibility of coil placement both within and between sessions [35].”
From A phase I trial of accelerated intermittent theta burst rTMS for amnestic MCI (2024) · cites this paper as [35]
Experimental — accuracy not yet measured
Self-check
Percentages, sums and reported differences re-computed from the paper’s own numbers.
The self-check needs the paper’s full text.
Citations
Cites
Nitsche, M. A., & Paulus, W. (2000) · The Journal of Physiology · doi:10.1111/j.1469-7793.2000.t01-1-00633.x · Cited by 5,656
Theta Burst Stimulation of the Human Motor Cortex
Huang, Y.-Z., Edwards, M. J., Rounis, E., Bhatia, K. P., & Rothwell, J. C. (2005) · Neuron · doi:10.1016/j.neuron.2004.12.033 · Cited by 4,158
Resting-state connectivity biomarkers define neurophysiological subtypes of depression
Drysdale, A. T., Grosenick, L., Downar, J., Dunlop, K., Mansouri, F., Meng, Y., Fetcho, R. N., Zebley, B., Oathes, D. J., Etkin, A., et al. (2017) · Nature Medicine · doi:10.1038/nm.4246 · Cited by 2,170
O’Reardon, J. P., Solvason, H. B., Janicak, P. G., Sampson, S., Isenberg, K. E., Nahas, Z., McDonald, W. M., Avery, D., Fitzgerald, P. B., Loo, C., et al. (2007) · Biological Psychiatry · doi:10.1016/j.biopsych.2007.01.018 · Cited by 1,910
Self-citationResponses to rapid-rate transcranial magnetic stimulation of the human motor cortex
Pascual‐Leone, Á., Valls‐Solé, J., Wassermann, E. M., & Hallett, M. (1994) · Brain · doi:10.1093/brain/117.4.847 · Cited by 1,486
George, M. S., Lisanby, S. H., Avery, D., McDonald, W. M., Durkalski, V., Pavlicova, M., Anderson, B., Nahas, Z., Bulow, P., Zarkowski, P., et al. (2010) · Archives of General Psychiatry · doi:10.1001/archgenpsychiatry.2010.46 · Cited by 1,092
Self-citationDaily repetitive transcranial magnetic stimulation (rTMS) improves mood in depression
George, M. S., Wassermann, E. M., Williams, W. A., Callahan, A., Ketter, T. A., Basser, P., Hallett, M., & Post, R. M. (1995) · NeuroReport · doi:10.1097/00001756-199510020-00008 · Cited by 954
Self-citationStanford Accelerated Intelligent Neuromodulation Therapy for Treatment-Resistant Depression
Cole, E. J., Stimpson, K. H., Bentzley, B. S., Gulser, M., Cherian, K., Tischler, C., Nejad, R., Pankow, H., Choi, E., Aaron, H., et al. (2020) · American Journal of Psychiatry · doi:10.1176/appi.ajp.2019.19070720 · Cited by 802
Stanford Neuromodulation Therapy (SNT): A Double-Blind Randomized Controlled Trial
Cole, E. J., Phillips, A. L., Bentzley, B. S., Stimpson, K. H., Nejad, R., Barmak, F., Veerapal, C., Khan, N., Cherian, K., Felber, E., et al. (2022) · American Journal of Psychiatry · doi:10.1176/appi.ajp.2021.20101429 · Cited by 795
Techniques and mechanisms of action of transcranial stimulation of the human motor cortex
Rothwell, J. C. (1997) · Journal of Neuroscience Methods · doi:10.1016/s0165-0270(97)02242-5 · Cited by 649
Research works printed but not linked: 1
- Horvath, 2015, Quantitative review finds No evidence of cognitive effects in healthy populations from single-session transcranial direct current stimulation (tDCS), Brain Stimul, 8, 535, 10.1016/j.brs.2015.01.400 · DOI · Paper page
Cited by
Sorted by citations
Morriss, R., Briley, P. M., Webster, L., Abdelghani, M., Barber, S., Bates, P., Brookes, C., Hall, B., Ingram, L., Kurkar, M., et al. (2024) · Nature Medicine · doi:10.1038/s41591-023-02764-z · Cited by 122
Trapp, N. T., Purgianto, A., Taylor, J. J., Singh, M. K., Oberman, L. M., Mickey, B. J., Youssef, N. A., Solzbacher, D., Zebley, B., Cabrera, L. Y., et al. (2025) · Clinical Neurophysiology · doi:10.1016/j.clinph.2024.12.015 · Cited by 89
Accelerated Theta Burst Stimulation: Safety, Efficacy, and Future Advancements
Cole, E., O’Sullivan, S. J., Tik, M., & Williams, N. R. (2024) · Biological Psychiatry · doi:10.1016/j.biopsych.2023.12.004 · Cited by 79
Ren, J., Ren, W., Zhou, Y. C., Dahmani, L., Duan, X., Fu, X., Wang, Y., Pan, R., Zhao, J., Zhang, P., et al. (2023) · Brain stimulation · doi:10.1016/j.brs.2023.08.023 · Cited by 54
Hoornweder, S. V., Nuyts, M., Frieske, J., Verstraelen, S., Meesen, R., & Caulfield, K. A. (2023) · NeuroImage · doi:10.1016/j.neuroimage.2023.120379 · Cited by 37
Self-citationTang, Z., Huang, J., Zhou, Y., Ren, J., Duan, X., Fu, X., Pan, R., Wang, R., Zhang, P., Ding, M., et al. (2024) · Stroke · doi:10.1161/strokeaha.124.046597 · Cited by 33
Lefaucheur, J., Colzi, C., Hollander, E., Pampaloni, I., Ameringen, M. V., Baeken, C., Fusar‐Poli, P., Arango, C., Fontenelle, L. F., Batail, J.-M. V., et al. (2025) · Neuroscience & Biobehavioral Reviews · doi:10.1016/j.neubiorev.2025.106140 · Cited by 33
Clinical utility and prospective of TMS–EEG: Updated review from an international expert group
Ziemann, U., Bai, Y., Baumer, F. M., Beck, M. M., Belardinelli, P., Belvisi, D., Bender, S., Bergmann, T. O., Bortoletto, M., Casarotto, S., et al. (2026) · Clinical Neurophysiology · doi:10.1016/j.clinph.2025.2111487 · Cited by 46
Chen, X., Lü, B., Wang, Y., Li, X.-Y., Wang, Z., Li, H.-X., Liao, Y., Blumberger, D. M., Castellanos, F. X., Garza‐Villarreal, E. A., et al. (2025) · 中国科学通报:英文版 · doi:10.1016/j.scib.2025.05.042 · Cited by 34
Opportunities and obstacles in non-invasive brain stimulation
Toth, J., Kurtin, D. L., Brosnan, M. B., & Arvaneh, M. (2024) · Frontiers in Human Neuroscience · doi:10.3389/fnhum.2024.1385427 · Cited by 27
Ren, J., Su, W., Zhou, Y. C., Han, K., Pan, R., Duan, X., Liu, J., Lu, H., Zhang, P., Zhang, W., et al. (2025) · Brain stimulation · doi:10.1016/j.brs.2025.02.009 · Cited by 25
Valerio, J., Ramirez‐Velandia, F., Fernandez, M. P., Rea, N. S., & Alvarez-Pinzon, A. M. (2024) · Neurosurgery Open · doi:10.1227/neuprac.0000000000000090 · Cited by 18
TMS-Induced Modulation of EEG Functional Connectivity Is Affected by the E-Field Orientation
Pieramico, G., Guidotti, R., Nieminen, J. O., D’Andrea, A., Basti, A., Souza, V. H., Nieminen, J. O., Lioumis, P., Ilmoniemi, R. J., Romani, G. L., et al. (2023) · Brain Sciences · doi:10.3390/brainsci13030418 · Cited by 17
Ortega‐Robles, E., Cantillo-Negrete, J., Carino-Escobar, R. I., & Arias-Carrión, Ó. (2023) · MethodsX · doi:10.1016/j.mex.2023.102451 · Cited by 17
Tubbs, A., & Vazquez, E. A. (2024) · Brain Sciences · doi:10.3390/brainsci14111092 · Cited by 17
Effects of transcranial magnetic stimulation on reactive response inhibition
Qu, H., Geissler, C. F., Ferrante, M., Hartwigsen, G., & Friehs, M. A. (2024) · Neuroscience & Biobehavioral Reviews · doi:10.1016/j.neubiorev.2023.105532 · Cited by 19
Schmaußer, M., Raab, M., & Laborde, S. (2024) · Psychophysiology · doi:10.1111/psyp.14606 · Cited by 14
Yu, G., Park, C., Jeong, M. G., Jung, G. S., & Kim, K. T. (2024) · Frontiers in Neurology · doi:10.3389/fneur.2024.1423013 · Cited by 12
Capizzi, M., Martín-Signes, M., Coull, J. T., Chica, A. B., & Charras, P. (2023) · Neuropsychologia · doi:10.1016/j.neuropsychologia.2023.108561 · Cited by 14
Kaiser, M., Wang, Y., ten Oever, S., Duecker, F., Sack, A. T., & van de Ven, V. G. (2025) · Communications Psychology · doi:10.1038/s44271-025-00202-z · Cited by 13
A phase I trial of accelerated intermittent theta burst rTMS for amnestic MCI
Aghamoosa, S., Lopez, J., Rbeiz, K., Fleischmann, H. H., Horn, O., Madden, K., Caulfield, K. A., Antonucci, M. U., Revuelta, G., McTeague, L. M., et al. (2024) · Journal of Neurology, Neurosurgery & Psychiatry · doi:10.1136/jnnp-2023-332680 · Cited by 12
Self-citationAdvances in Cerebellar TMS Therapy: An Updated Systematic Review on Multi-Session Interventions
Ciricugno, A., Paternò, S., Barbati, N., Borgatti, R., Cattaneo, Z., & Ferrari, C. (2025) · Biomedicines · doi:10.3390/biomedicines13071578 · Cited by 12
Agboada, D., Osnabruegge, M., Rethwilm, R., Kanig, C., Schwitzgebel, F., Mack, W., Schecklmann, M., Seiberl, W., & Schoisswohl, S. (2023) · Frontiers in Human Neuroscience · doi:10.3389/fnhum.2023.1228859 · Cited by 12
Andrade, S. M., Marques, C. C. D. O., de Lucena, L. C., da Costa, K. V., de Souza, I. C., Machado, C. B. D. S., Queiroz, M. E. B. S., Costa, L. P., & da Silva, S. T. (2024) · Neurological Research · doi:10.1080/01616412.2024.2321779 · Cited by 12
Neuroimaging and neuromodulation of invisible symptoms in multiple sclerosis
Ayache, S., & Chalah, M. (2024) · Frontiers in Human Neuroscience · doi:10.3389/fnhum.2024.1376095 · Cited by 11
Hensel, L., Lüdtke, J., Brouzou, K. O., Eickhoff, S. B., Kamp, D., & Schilbach, L. (2024) · Cerebral Cortex · doi:10.1093/cercor/bhae096 · Cited by 13
Gong, L., Yang, X., He, Y., Li, H., Zhou, W., Liu, D., Zhang, B., & Xi, C. (2025) · NeuroImage Clinical · doi:10.1016/j.nicl.2025.103815 · Cited by 12
Demchenko, I., Al-Shamali, H. F., Rueda, A., Tailor, I., Janssen‐Aguilar, R., Schweizer, T. A., Dunlop, K., Graham, S. J., & Bhat, V. (2025) · Human Brain Mapping · doi:10.1002/hbm.70424 · Cited by 11
Zhang, C., Xiao, S., Shen, B., Xu, Z., Zhan, J., Li, J., Zhou, J., & Fu, W. (2025) · Journal of NeuroEngineering and Rehabilitation · doi:10.1186/s12984-025-01721-w · Cited by 10
It is time to personalize rTMS targeting for the treatment of pain
Lefaucheur, J. (2024) · Neurophysiologie Clinique · doi:10.1016/j.neucli.2024.102950 · Cited by 9
Hamel, R., Pearson, J., Sifi, L., Patel, D. A., Hinder, M. R., Jenkinson, N., & Galea, J. M. (2023) · Brain stimulation · doi:10.1016/j.brs.2023.09.022 · Cited by 9
Elnazali, M., Veerakumar, A., Blair, M., Pearce, E. L., Kim, N., Sebastian, S., Santo, J. B., Rybak, Y. E., & Burhan, A. M. (2024) · Journal of Psychiatric Research · doi:10.1016/j.jpsychires.2024.10.031 · Cited by 11
Scalp surface estimation and head registration using sparse sampling and 3D statistical models
Schlesinger, O., Kundu, R., Isaev, D., Choi, J. Y., Goetz, S. M., Turner, D. A., Sapiro, G., Peterchev, A. V., & Martino, J. M. D. (2024) · Computers in Biology and Medicine · doi:10.1016/j.compbiomed.2024.108689 · Cited by 8
Cho, J. Y., Hoornweder, S. V., Sege, C. T., Antonucci, M. U., McTeague, L. M., & Caulfield, K. A. (2023) · Frontiers in Neural Circuits · doi:10.3389/fncir.2023.1214959 · Cited by 7
Self-citationNovel role for non-invasive neuromodulation techniques in central respiratory dysfunction
Lv, L., Cheng, X., Yang, J., Chen, X., & Ni, J. (2023) · Frontiers in Neuroscience · doi:10.3389/fnins.2023.1226660 · Cited by 7
Chowdhury, N. S., Taseen, K. J., Chiang, A. K., Chang, W., Millard, S. K., Seminowicz, D. A., & Schabrun, S. M. (2024) · Pain · doi:10.1097/j.pain.0000000000003484 · Cited by 9
MRI free targeting of deep brain structures based on facial landmarks
Riis, T. S., Lunt, S., & Kubanek, J. (2025) · Brain stimulation · doi:10.1016/j.brs.2024.12.1478 · Cited by 7
Aghamoosa, S., Nolin, S. A., Chen, A. A., Caulfield, K. A., Lopez, J., Rbeiz, K., Fleischmann, H. H., Horn, O., Madden, K., Antonucci, M., et al. (2025) · Brain Stimulation · doi:10.1016/j.brs.2025.04.012 · Cited by 6
Self-citationDifferential online and offline effects of theta-tACS on memory encoding and retrieval
Paßmann, S., Baselgia, S., Kasten, F. H., Herrmann, C. S., & Rasch, B. (2024) · Cognitive Affective & Behavioral Neuroscience · doi:10.3758/s13415-024-01204-w · Cited by 6
Bilateral intracortical inhibition during unilateral motor preparation and sequence learning
Hamel, R., Waltzing, B. M., Hinder, M. R., McAllister, C. J., Jenkinson, N., & Galea, J. M. (2024) · Brain stimulation · doi:10.1016/j.brs.2024.03.009 · Cited by 6
Mussigmann, T., Bardel, B., Casarotto, S., Senova, S., Rosanova, M., Vialatte, F., & Lefaucheur, J. (2024) · Neurophysiologie Clinique · doi:10.1016/j.neucli.2024.103012 · Cited by 6
The role of white matter variability in TMS neuromodulatory effects
Martín-Signes, M., Esteban, P. R.-S., Narganes-Pineda, C., Caracuel, A., Mata, J. L., Martín‐Arévalo, E., & Chica, A. B. (2024) · Brain stimulation · doi:10.1016/j.brs.2024.11.006 · Cited by 7
Kinjo, M., Honda, S., Wada, M., Nakajima, S., Koike, S., & Noda, Y. (2024) · Brain Research · doi:10.1016/j.brainres.2024.148989 · Cited by 6
Quantification of subject motion during TMS via pulsewise coil displacement
Numssen, O., Martin, S., Williams, K., Knösche, T. R., & Hartwigsen, G. (2024) · Brain stimulation · doi:10.1016/j.brs.2024.08.009 · Cited by 6
Transcranial magnetic stimulation (TMS) localization by co-registration of facial point clouds
Liu, G., Li, J., Zhao, J., Roberts, N., Kong, D., Xu, Q., Xing, H., & Gong, Q. (2023) · Brain stimulation · doi:10.1016/j.brs.2023.01.837 · Cited by 6
Gregory, E., Siddiqi, S., Fox, M., Blumberger, D. M., Downar, J. H., Daskalakis, Z. J., Dunlop, K., & Vila‐Rodriguez, F. (2025) · bioRxiv (Cold Spring Harbor Laboratory) · doi:10.1101/2025.07.09.662866 · Cited by 5
Liu, Y., Zhang, Q., Zhang, H., Xiang, Y., & Wang, H. (2025) · Frontiers in Human Neuroscience · doi:10.3389/fnhum.2025.1574721 · Cited by 5
Shim, J., & Kim, C. (2025) · Brain Sciences · doi:10.3390/brainsci15111247 · Cited by 4
TMS-induced phase resets depend on TMS intensity and EEG phase
Erickson, B. A., Kim, B., Sabes, P. N., Rich, R., Hatcher, A., Fernandez-Nuñez, G., Mentzelopoulos, G., Vitale, F., & Medaglia, J. D. (2024) · Journal of Neural Engineering · doi:10.1088/1741-2552/ad7f87 · Cited by 4
Rayani, K., Grabovac, A. D., Chan, P., Montgomery, S., Ghovanloo, M., & Sacchet, M. D. (2025) · Frontiers in Psychiatry · doi:10.3389/fpsyt.2025.1494567 · Cited by 7
Wang, S., Weng, Q., Kong, G., Wu, G., Cui, H., Qian, Z., Xu, L., Wang, J., Huang, J., Wang, J., et al. (2025) · Journal of Affective Disorders · doi:10.1016/j.jad.2025.119712 · Cited by 4
Robot-Assisted Transcranial Magnetic Stimulation (Robo-TMS): A Review
Bai, W., Weightman, A., O’Connor, R. J., Ding, Z., Zhang, M., Xie, S. Q., & Li, Z. (2025) · IEEE Transactions on Neural Systems and Rehabilitation Engineering · doi:10.1109/tnsre.2025.3585651 · Cited by 4
Verification of neuronavigated TMS accuracy using structured-light 3D scans
Matilainen, N., Kataja, J., & Laakso, I. (2024) · Physics in Medicine and Biology · doi:10.1088/1361-6560/ad33b8 · Cited by 4
Tetra codes: A precise, concise notation system for scalp-based neuronavigation
Li, Y., Peterchev, A. V., & Downar, J. H. (2024) · Brain stimulation · doi:10.1016/j.brs.2024.09.012 · Cited by 4
Millet, B., Harika‐Germaneau, G., Maatoug, R., Naudet, F., Reymann, J., Turmel, V., Batail, J.-M. V., Soulabaille, J., Jaafari, N., & Drapier, D. (2025) · PLoS ONE · doi:10.1371/journal.pone.0317597 · Cited by 6
3D-printed helmet-type neuro-navigation approach (I-Helmet) for transcranial magnetic stimulation
Wang, H., Cui, D., Jin, J., Wang, X., Li, Y., Liu, Z., & Yin, T. (2023) · Frontiers in Neuroscience · doi:10.3389/fnins.2023.1224800 · Cited by 4
Caulfield, K. A., LaPorta, S., Walton, R. M., Collins, E., Summers, P. M., Cho, J. Y., Antonucci, M. U., Opitz, A., George, M. S., & McTeague, L. M. (2024) · Brain stimulation · doi:10.1016/j.brs.2024.08.001 · Cited by 4
Self-citationRech, L., Vivanco, R. A., Guersoni, A. C., Ninapaytan, G. M. C., Rivera, P. B., Ramos-Orosco, E. J., Vargas-Ruiz, A., Felipe, M., & Carvalho, S. (2025) · Brain Sciences · doi:10.3390/brainsci15020106 · Cited by 3
Wang, M., Xiaomei, Z., 周鹤同, Chen, Q., Tong, Q., Han, Q., Zhao, X., Wang, D., Lai, J., He, H., et al. (2025) · BMC Medicine · doi:10.1186/s12916-025-04174-z · Cited by 8
Zhang, J., Han, S., Shen, Y., Wu, X., Zhao, Y., Wu, Z., Luo, N., Yang, Z., Li, D., Song, M., et al. (2026) · BMC Medicine · doi:10.1186/s12916-026-04687-1 · Cited by 3
The effect of prolonged elbow pain and rTMS on TMS-evoked potentials: A TMS-EEG study
Chowdhury, N. S., Chang, W., Cheng, D., Manivasagan, N., Seminowicz, D. A., & Schabrun, S. M. (2025) · Imaging Neuroscience · doi:10.1162/imag.a.7 · Cited by 3
Lefaucheur, J., Mussigmann, T., Bapst, B., & Bardel, B. (2025) · Clinical Neurophysiology · doi:10.1016/j.clinph.2025.2110773 · Cited by 3
Wang, H., Jin, J., Zhang, X., Jiao, Q., Cui, D., Liu, Z., & Yin, T. (2025) · NeuroImage · doi:10.1016/j.neuroimage.2025.121346 · Cited by 3
Cortical surface electric field estimation for real-time TMS with graph neural networks
Maki, T., Yokota, T., Hirata, A., & Hontani, H. (2025) · Physics in Medicine and Biology · doi:10.1088/1361-6560/ae1ee7 · Cited by 3
How accurate are coordinate systems being used for transcranial magnetic stimulation?
Uehara, M. A., Jacobson, N., & Moussavi, Z. (2024) · Frontiers in Human Neuroscience · doi:10.3389/fnhum.2024.1342410 · Cited by 2
Wang, X., Huang, S., Cheng, Y., Dai, W., & Shen, Y. (2025) · Journal of Visualized Experiments · doi:10.3791/69425 · Cited by 2
Reducing target E-field variability in repetitive TMS through online motion compensation
Grosshagauer, S., Woletz, M., Becher, M., Björklund, J., Padberg, F., Keeser, D., Bulubas, L., & Windischberger, C. (2025) · Brain stimulation · doi:10.1016/j.brs.2025.102990 · Cited by 2
Gongalla, S., Oh, J., Zuckerberg, A., O’Reardon, J. P., & Morrison, M. F. (2026) · Transcranial magnetic stimulation . · doi:10.1016/j.transm.2026.100209 · Cited by 2
Patnaik, A., Guruprasad, N., Sekar, A., Bansal, S., & Sahu, R. N. (2024) · Journal of Pharmacy And Bioallied Sciences · doi:10.4103/jpbs.jpbs_881_23 · Cited by 2
Chowdhury, N. S., Taseen, K. J., Chiang, A. K., Chang, W., Millard, S. K., Seminowicz, D. A., & Schabrun, S. M. (2024) · bioRxiv (Cold Spring Harbor Laboratory) · doi:10.1101/2024.06.11.598596 · Cited by 2
Dietary Cocoa Flavanols Do Not Alter Brain Excitability in Young Healthy Adults
Hamel, R., Oyler, R., Harms, E., Bailey, R., Rendeiro, C., & Jenkinson, N. (2024) · Nutrients · doi:10.3390/nu16070969 · Cited by 1
The Use of MRI and TMS in Treatment-Resistant Depression: Advances in Pediatric Applications
Ha, T., Jakimier, K., & O’Sullivan, S. J. (2025) · Brain Sciences · doi:10.3390/brainsci15020194 · Cited by 1
Hui, J., Trevizol, A. P., Espinola, C. W., Kelkar, R. S., Lee, H. H., Mulsant, B. H., Prillo, J., Zomorrodi, R., Zrenner, C., & Blumberger, D. M. (2025) · Transcranial magnetic stimulation . · doi:10.1016/j.transm.2025.100167 · Cited by 1
Hashmi, M. U. H., Khurana, M., Qadri, S. F., Ahmed, F. K., Iqbal, F., Mehmood, T., Farhan, W., Kumar, S., & Kumari, A. (2025) · Psychiatric Quarterly · doi:10.1007/s11126-025-10152-8 · Cited by 1
Dormegny-Jeanjean, L. C., de Billy, C. D. C., Pierrat, C., Mainberger, O., Schorr, B., Obrecht, A., Arcay, H., Moreau, A., Humbert, I., Scarlatti, F., et al. (2025) · European Archives of Psychiatry and Clinical Neuroscience · doi:10.1007/s00406-025-02027-7 · Cited by 2
Antônio, F. I., Rodrigues, M. P., Tremblay, F., Pukall, C. F., & McLean, L. (2025) · Clinical Neurophysiology · doi:10.1016/j.clinph.2025.2110803 · Cited by 1
Virtual neuronavigation for parcel-guided TMS
Truong, D. Q., Datta, A., Moreno, J., Valter, Y., Mejia, R., Nazim, K., Gao, Y., Huang, Y., Berman, J. A., & Javitt, D. C. (2026) · Transcranial magnetic stimulation . · doi:10.1016/j.transm.2026.100323 · Cited by 1
Nygaard, S., Madsen, M. A. J., Wiggermann, V., Cabras, C., Christiansen, L., Svátková, A., Lundell, H., Chow, H. H., Christensen, J. R., Blinkenberg, M., et al. (2026) · Frontiers in Neurology · doi:10.3389/fneur.2026.1759679 · Cited by 1
Snyder, I., Handoko, K., Neppach, A., Badhan, G., Karim, H. T., Price, R. B., Ferrarelli, F., Dombrovski, A. Y., & Peciña, M. (2026) · JAMA Psychiatry · doi:10.1001/jamapsychiatry.2026.0647 · Cited by 1
Gregory, E., Samara, A., Ge, R., Shearer, H., Humaira, A., Vanderwal, T., & Vila‐Rodriguez, F. (2026) · Neuromodulation Technology at the Neural Interface · doi:10.1016/j.neurom.2026.06.465 · Cited by 1
Caulfield, K. A., Sege, C. T., Weaver, J., Murphy, K. R., Passaro, A. D., Meads, K., Dadgar‐Kiani, E., Antonucci, M. U., Good, C. H., & McTeague, L. M. (2026) · Brain stimulation · doi:10.1016/j.brs.2026.103171 · Cited by 1
Self-citationGregory, E., Siddiqi, S., Fox, M., Blumberger, D. M., Downar, J. H., Daskalakis, Z. J., Dunlop, K., & Vila‐Rodriguez, F. (2026) · Brain stimulation · doi:10.1016/j.brs.2026.103173 · Cited by 6
Universidad Católica Santiago de Guayaquil, G., Vivanco, R. A., Rech, L., Ramos-Orosco, E. J., Prilip, P., Mengide, J. P., Rivera, P. B., Vargas-Ruiz, A., Barros, L. C. M., Abbarh, S., et al. (2024) · Principles and Practice of Clinical Research Journal · doi:10.21801/ppcrj.2023.94.4 · Cited by 1
Lee, H. S., Kim, D. H., Seo, H. G., Im, S., Yoo, Y. J., Kim, N. Y., Lee, J., Kim, D., Park, H., Yoon, M., et al. (2024) · Frontiers in Neurology · doi:10.3389/fneur.2024.1427142 · Cited by 1
Temiz, G., Bağçeci, İ., Şenol, N. E. G., & Bulut, T. (2025) · Journal of Neurolinguistics · doi:10.1016/j.jneuroling.2025.101260 · Cited by 1
Comprehensive evaluation of U-Net based transcranial magnetic stimulation electric field estimations
Berger, T. A., Mantell, K. E., Haigh, Z. J., Perera, N. D., Alekseichuk, I., & Opitz, A. (2025) · Scientific Reports · doi:10.1038/s41598-025-95767-4 · Cited by 1
Zhang, Y. (2024) · International Conference on Image Processing, Computer Vision and Machine Learning (ICICML) · doi:10.1109/icicml63543.2024.10957770 · Cited by 1
Hamel, R., Pearson, J., Sifi, L., Patel, D. A., Hinder, M. R., Jenkinson, N., & Galea, J. M. (2023) · bioRxiv (Cold Spring Harbor Laboratory) · doi:10.1101/2023.03.16.532906 · Cited by 1
Editorial: Rising stars in brain imaging and stimulation 2023
Ayache, S. S., Biabani, M., & Chalah, M. A. (2024) · Frontiers in Human Neuroscience · doi:10.3389/fnhum.2024.1437975 · Cited by 1
Webler, R. D., Pines, A. R., Chiulli, N., Cotovio, G., Darby, R., Jiang, J., Joutsa, J., Li, N., Oliveira-Maia, A. J., Peng, S., et al. (2025) · medRxiv · doi:10.1101/2025.02.25.25322842 · Cited by 1
Zhang, X., Hancock, R., & Santaniello, S. (2025) · bioRxiv (Cold Spring Harbor Laboratory) · doi:10.1101/2025.02.27.640697 · Cited by 1
Caulfield, K. A., Sege, C. T., Weaver, J., Murphy, K. R., Passaro, T., Meads, K., Dadgar‐Kiani, E., Antonucci, M. U., Good, C. H., & McTeague, L. M. (2025) · bioRxiv (Cold Spring Harbor Laboratory) · doi:10.1101/2025.05.27.656481 · Cited by 1
Self-citationTaylor, J. J., Palm, S. T., Cohen, A. L., Croarkin, P. E., Drew, W., Fox, M., & Siddiqi, S. (2023) · Biological Psychiatry · doi:10.1016/j.biopsych.2023.08.019
Wang, M., Zhang, X., Zhou, H., Chen, Q., Tong, Q., Han, Q., Zhao, X., Wang, D., Lai, J., He, H., et al. (2024) · medRxiv · doi:10.1101/2024.07.25.24311037
Aghamoosa, S., Sims, S. A., Chen, A. A., Caulfield, K. A., Lopez, J. W., Rbeiz, K. S., Fleischmann, H. H., Horn, O., Antonucci, M. U., Revuelta, G. J., et al. (2025) · SSRN Electronic Journal · doi:10.2139/ssrn.5067527
Self-citationYoussef, H., Öge, A. E., Cuypers, K., & Vural, A. (2025) · Journal of Neuroscience Methods · doi:10.1016/j.jneumeth.2025.110374
Green, J., Kundu, R., Peterchev, A. V., & Martino, J. M. D. (2024) · IEEE URUCON · doi:10.1109/urucon63440.2024.10850257
Webler, R. D., Pines, A. R., Chiulli, N., Cotovio, G., Darby, R., Jiang, J., Joutsa, J., Li, N., Oliveira-Maia, A. J., Peng, S., et al. (2025) · Research Square · doi:10.21203/rs.3.rs-6070697/v1
Canino, M., Arvin, N., Nachazel, Z., Irrgang, J. J., Popchak, A. J., Musahl, V., Sterczala, A. J., & Flanagan, S. D. (2025) · Experimental Brain Research · doi:10.1007/s00221-025-07003-0 · Cited by 1
Zhang, Y. (2024) · International Conference on Image Processing, Computer Vision and Machine Learning (ICICML) · doi:10.1109/icicml63543.2024.10958123
Metadata
- Authors
- Caulfield, K. A., Fleischmann, H. H., Cox, C. E., Wolf, J. P., George, M. S., & McTeague, L. M.
- Affiliations
- Medical University of South Carolina (US)
- Corresponding author
- Caulfield, Kevin A.
- Venue
- Brain Stimulation
- Publisher
- Elsevier BV
- Published
- 2022-09
- Volume
- 15
- Issue
- 5
- Pages
- 1192-1205
- ISSN
- 1876-4754 (ISSN-L)
- 1935-861X
- PMC
- PMC10026380
- OpenAlex
- W4293512447
- Cited by
- 145
- References
- 55
- Citations by year
- 2026: 38 · 2025: 55 · 2024: 39 · 2023: 13
- FWCI
- 9.39
- Type
- journal article
- Language
- en
- Open access
- gold
- doi.org
- Licence
- Locations
- Brain stimulation (publishedVersion, cc-by-nc-nd)
- PubMed (publishedVersion)
- PubMed Central (acceptedVersion, cc-by-nc-nd)
- DOAJ (DOAJ: Directory of Open Access Journals) (submittedVersion, cc-by-sa)
- Funders
- National Alliance for Research on Schizophrenia and Depression
- National Institutes of Health (F31 NRSA)
- National Institute of General Medical Sciences (P20GM109040)
- National Institute of Neurological Disorders and Stroke (F31NS126019)
- Eunice Kennedy Shriver National Institute of Child Health and Human Development (P2CHD086844)
- Topics
- Life Sciences › Neuroscience › Neurology › Transcranial Magnetic Stimulation Studies
- Health Sciences › Medicine › Clinical Neurology › Deep Brain Stimulation and Movement Disorders
- Physical Sciences › Engineering › Biomedical Engineering › Ultrasound and Hyperthermia Applications
- Keywords
- neuronavigation, transcranial magnetic stimulation, targeting accuracy, electric field modeling, inter-operator variability, prefrontal cortex stimulation
- MeSH terms
- Humans, Magnetic Resonance Imaging, Software, Prefrontal Cortex, Neuronavigation, Transcranial Magnetic Stimulation
About these checks
Registry, retraction, Cites and statistics results are computed, not judged, with one exception: a printed reference that no index lists is read once by a model before it counts as a citation error. Claims are extracted by a model and kept only when their quote appears verbatim in the text; each cited source is then checked, with a model’s help, for whether it says what the claim relies on. Those verdicts can be wrong — read the claim’s quote and the cited source before relying on one.
Statistics and arithmetic are recomputed, not judged.
Confidence bands are shown only for fields calibrated on our annotated test set. None is calibrated yet, so no band is shown.
What counts as a claim ›How we measure confidence ›How we check this ›
Are you an author, or do you see a problem with this page? Request a review
