Student or educator? Sign up with your school email and get 6 months of Pro free.
Cited by 183

The DOI matches its Crossref record; 56 of the 56 references it cites were found in a registry or an index.

Neuronal-Specific TUBB3 Is Not Required for Normal Neuronal Function but Is Essential for Timely Axon Regeneration

Latremoliere, Alban, Cheng, Long, DeLisle, Michelle, Wu, Chen, Chew, Sheena, Hutchinson, Elizabeth B., Sheridan, Andrew, Alexandre, Chloe, Latremoliere, Frederic, Sheu, Shu-Hsien, Golidy, Sara, Omura, Takao, Huebner, Eric A., Fan, Yanjie, Whitman, Mary C., Nguyen, Elaine, Hermawan, Crystal, Pierpaoli, Carlo, Tischfield, Max A., Woolf, Clifford J., Engle, Elizabeth C.·2018·Cell Reports

Abstract

We generated a knockout mouse for the neuronal-specific β-tubulin isoform Tubb3 to investigate its role in nervous system formation and maintenance. Tubb3 −/− mice have no detectable neurobehavioral or neuropathological deficits, and upregulation of mRNA and protein of the remaining β-tubulin isotypes results in equivalent total β-tubulin levels in Tubb3 −/− and wild-type mice. Despite similar levels of total β-tubulin, adult dorsal root ganglia lacking TUBB3 have decreased growth cone microtubule dynamics and a decreased neurite outgrowth rate of 22% in vitro and in vivo . The effect of the 22% slower growth rate is exacerbated for sensory recovery, where fibers must reinnervate the full volume of the skin to recover touch function. Overall, these data reveal that, while TUBB3 is not required for formation of the nervous system, it has a specific role in the rate of peripheral axon regeneration that cannot be replaced by other β-tubulins.

Overview

The claims and statistics of this paper haven’t been checked yet.

Run the check — free, no account needed. It reads the open-access text and checks the sources it cites.

A few free checks a day · papers already verified open instantly · results are public

Integrity signals

Registry

Crossref · 10.1016/j.celrep.2018.07.029

Cites

56 of 56 references verified0 citation errors · 0 not checkable

Statistics

Figures

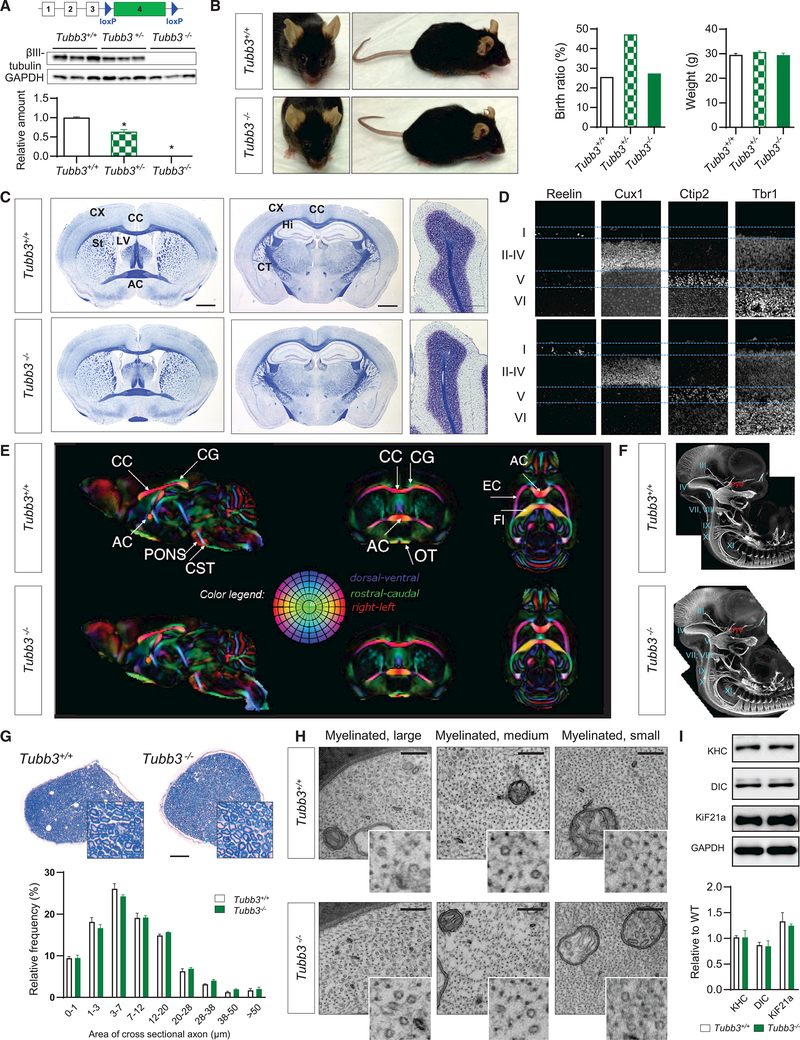
Figure 1. Tubb3−/− Mice Are Viable with No Major Anatomical Abnormalities (A) Genetic construct to produce Tubb3 knockout mice. Mice were crossed with Ella-cre mice. Bottom: detection of TUBB3 in brain of E14.5 wild-type, Tubb3+/−, and Tubb3−/− mice by western blot and quantification (N = 9). (B) Left: wild-type and Tubb3−/− littermates at 14 months of age. Middle: Mendelian birth ratio in WT (N = 14), Tubb3+/− (N = 26), and Tubb3−/− mice (N = 15). Right: weight gain of same mice at 3 months of age. (C) Adult wild-type and Tubb3−/− mice brains stained with Luxol fast blue for myelin and Nissl counterstain. Coronal sections at the level of the anterior commissure (left) and hippocampus (middle), and sagittal sections of cerebellum (right) reveal no detectable abnormalities in architecture of corpus callosum (CC), anterior commissure (AC), cortex (CX), striatum (St), hippocampus (Hi), corticospinal tract (CT), lateral ventricle (LV), and cerebellum in Tubb3−/− mice compared to wild-type. Absence of the wild-type optic nerve at the level of the AC resulted from detachment during processing. Scale bars, 400 (left and middle) and 100 mm (right). N = 5. (D) Cortical layers in wild-type (top, N = 5) and Tubb3−/− (bottom, N = 4) P2 mice. Brain sections stained for Reelin (layer I), Cux-1 (layers II–IV), Ctip2 (layer V), and Trb1 (layer VI). (E) Directionally encoded color maps from diffusion tensor imaging of adult wild-type (top) and Tubb3−/− (bottom) mice to examine white matter tracts. A group template was generated for each strain and compared to identify potential anatomical abnormalities in the mutant template. Side-by-side slice views in each of the orthogonal orientations are shown at the same level in both the wild-type and Tubb3−/− templates. Red, left-right; green, dorsal-ventral; and blue, rostralcaudal. CG, cingulum; PF, pontine fibers; OT, optic tract; EC, external capsule; FI, fimbria; for other abbreviations refer to (C). N = 4+/+, 3–/–. (F) Anatomy of cranial and spinal nerves stained with NF-M in E11.5 whole-mount embryos of wild-type and Tubb3−/− mice. I–XI: corresponding cranial nerves. N = 6 for each genotype. (G) Top: representative bright-field cross-sectional images of sciatic nerve from wild-type and Tubb3−/− mice stained with toluidine blue. Scale bar, 100 mm. Bottom: distributions of myelinated fibers of different diameters in wild-type and Tubb3−/− mice. N = 3. (H) Ultrastructure of myelinated large, medium, and small diameter fibers in cross-sectional images of adult wild-type and Tubb3−/− sciatic nerves. 49,0003. Inset: magnification highlights cytoskeletal MTs and neurofilaments. N = 3. Scale bar, 100 nm. (I) Top: representative western blot and quantification of motor protein levels in sciatic nerve tissue lysates of adult wild-type and Tubb3−/− mice. Bottom: quantification (n = 3). See also Figure S1.
Figure 1. Tubb3−/− Mice Are Viable with No Major Anatomical Abnormalities (A) Genetic construct to produce Tubb3 knockout mice. Mice were crossed with Ella-cre mice. Bottom: detection of TUBB3 in brain of E14.5 wild-type, Tubb3+/−, and Tubb3−/− mice by western blot and quantification (N = 9). (B) Left: wild-type and Tubb3−/− littermates at 14 months of age. Middle: Mendelian birth ratio in WT (N = 14), Tubb3+/− (N = 26), and Tubb3−/− mice (N = 15). Right: weight gain of same mice at 3 months of age. (C) Adult wild-type and Tubb3−/− mice brains stained with Luxol fast blue for myelin and Nissl counterstain. Coronal sections at the level of the anterior commissure (left) and hippocampus (middle), and sagittal sections of cerebellum (right) reveal no detectable abnormalities in architecture of corpus callosum (CC), anterior commissure (AC), cortex (CX), striatum (St), hippocampus (Hi), corticospinal tract (CT), lateral ventricle (LV), and cerebellum in Tubb3−/− mice compared to wild-type. Absence of the wild-type optic nerve at the level of the AC resulted from detachment during processing. Scale bars, 400 (left and middle) and 100 mm (right). N = 5. (D) Cortical layers in wild-type (top, N = 5) and Tubb3−/− (bottom, N = 4) P2 mice. Brain sections stained for Reelin (layer I), Cux-1 (layers II–IV), Ctip2 (layer V), and Trb1 (layer VI). (E) Directionally encoded color maps from diffusion tensor imaging of adult wild-type (top) and Tubb3−/− (bottom) mice to examine white matter tracts. A group template was generated for each strain and compared to identify potential anatomical abnormalities in the mutant template. Side-by-side slice views in each of the orthogonal orientations are shown at the same level in both the wild-type and Tubb3−/− templates. Red, left-right; green, dorsal-ventral; and blue, rostralcaudal. CG, cingulum; PF, pontine fibers; OT, optic tract; EC, external capsule; FI, fimbria; for other abbreviations refer to (C). N = 4+/+, 3–/–. (F) Anatomy of cranial and spinal nerves stained with NF-M in E11.5 whole-mount embryos of wild-type and Tubb3−/− mice. I–XI: corresponding cranial nerves. N = 6 for each genotype. (G) Top: representative bright-field cross-sectional images of sciatic nerve from wild-type and Tubb3−/− mice stained with toluidine blue. Scale bar, 100 mm. Bottom: distributions of myelinated fibers of different diameters in wild-type and Tubb3−/− mice. N = 3. (H) Ultrastructure of myelinated large, medium, and small diameter fibers in cross-sectional images of adult wild-type and Tubb3−/− sciatic nerves. 49,0003. Inset: magnification highlights cytoskeletal MTs and neurofilaments. N = 3. Scale bar, 100 nm. (I) Top: representative western blot and quantification of motor protein levels in sciatic nerve tissue lysates of adult wild-type and Tubb3−/− mice. Bottom: quantification (n = 3). See also Figure S1.CC BY-NC-ND · PubMed Central
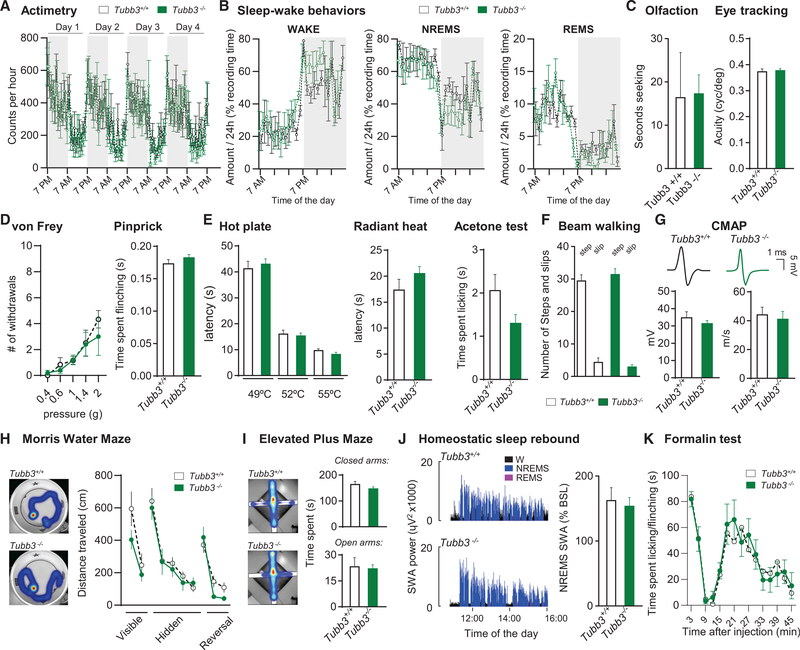
Figure 2. Tubb3−/− Mice Have No Behavioral Defects (A) Actimetry of wild-type and Tubb3/ mice over a 4-day period (N = 6 or 6+/+, 6−/−). (B) Wake, non-rapid eye movement (NREM), and rapid eye movement (REM) sleep amount expressed as percentage of the recording time in wild-type and Tubb3−/− mice (N = 4+/+, 4−/−). (C) Olfactory discrimination (left) measured as seconds to nose touch with bacon-flavored softie. Visual acuity (right) assessed by eye tracking assay. (Olfaction: N = 8+/+, 8−/−; visual acuity: N = 10+/+, 10−/−). (D) Number of brisk withdrawals out of 10 stimulations at various pressures applied onto the plantar surface of the hindpaw (left) or in the pinprick test (right) (N = 10+/+, 16−/−). (E) Latency of withdrawal to contact heat at 49, 52 and 55C (left) and to a radiant heat source (middle). Time spent licking/flinching in the acetone test (right) (N = 10+/+, 16−/−). (F) Balance beam assay for number of steps (columns 1 and 3) and slips (columns 2 and 4) (N = 10+/+, 13−/−). (G) Representative compound muscle action potential (CMAP) recordings from intraplantar muscles evoked by sciatic nerve stimulation in wild-type and Tubb3−/− mice and quantification of CMAP intensity and velocity (N = 6+/+, 6−/−). (H) Distance traveled in the visible, hidden and reversal phases of the water Morris maze assay (N = 8+/+, 13−/−). Inset: representative heatmap of the time spent during the hidden phase. (I) Heatmap representation of time spent in closed/open arms in the elevated plus maze assay and quantification (s) (N = 16+/+, 17−/−). (J) Representative traces of the time course of SWA (slow wave activity; spectral electroencephalogram (EEG) power in the 0.5- to 4.0-Hz range) during the first2.5 h of sleep opportunity in wild-type (top) and Tubb3/ (bottom) mice. Right: NREMS SWA computed over 4 hr (11:00–15:00) expressed as a percentage of the 24-hr baseline mean (N = 4+/+, 4−/−). (K) Time spent licking/flinching the paw after intraplantar injection of formalin (1%) (N = 6+/+, 6−/−). Error bars indicate SEM. See also Figure S2.
Figure 2. Tubb3−/− Mice Have No Behavioral Defects (A) Actimetry of wild-type and Tubb3/ mice over a 4-day period (N = 6 or 6+/+, 6−/−). (B) Wake, non-rapid eye movement (NREM), and rapid eye movement (REM) sleep amount expressed as percentage of the recording time in wild-type and Tubb3−/− mice (N = 4+/+, 4−/−). (C) Olfactory discrimination (left) measured as seconds to nose touch with bacon-flavored softie. Visual acuity (right) assessed by eye tracking assay. (Olfaction: N = 8+/+, 8−/−; visual acuity: N = 10+/+, 10−/−). (D) Number of brisk withdrawals out of 10 stimulations at various pressures applied onto the plantar surface of the hindpaw (left) or in the pinprick test (right) (N = 10+/+, 16−/−). (E) Latency of withdrawal to contact heat at 49, 52 and 55C (left) and to a radiant heat source (middle). Time spent licking/flinching in the acetone test (right) (N = 10+/+, 16−/−). (F) Balance beam assay for number of steps (columns 1 and 3) and slips (columns 2 and 4) (N = 10+/+, 13−/−). (G) Representative compound muscle action potential (CMAP) recordings from intraplantar muscles evoked by sciatic nerve stimulation in wild-type and Tubb3−/− mice and quantification of CMAP intensity and velocity (N = 6+/+, 6−/−). (H) Distance traveled in the visible, hidden and reversal phases of the water Morris maze assay (N = 8+/+, 13−/−). Inset: representative heatmap of the time spent during the hidden phase. (I) Heatmap representation of time spent in closed/open arms in the elevated plus maze assay and quantification (s) (N = 16+/+, 17−/−). (J) Representative traces of the time course of SWA (slow wave activity; spectral electroencephalogram (EEG) power in the 0.5- to 4.0-Hz range) during the first2.5 h of sleep opportunity in wild-type (top) and Tubb3/ (bottom) mice. Right: NREMS SWA computed over 4 hr (11:00–15:00) expressed as a percentage of the 24-hr baseline mean (N = 4+/+, 4−/−). (K) Time spent licking/flinching the paw after intraplantar injection of formalin (1%) (N = 6+/+, 6−/−). Error bars indicate SEM. See also Figure S2.CC BY-NC-ND · PubMed Central
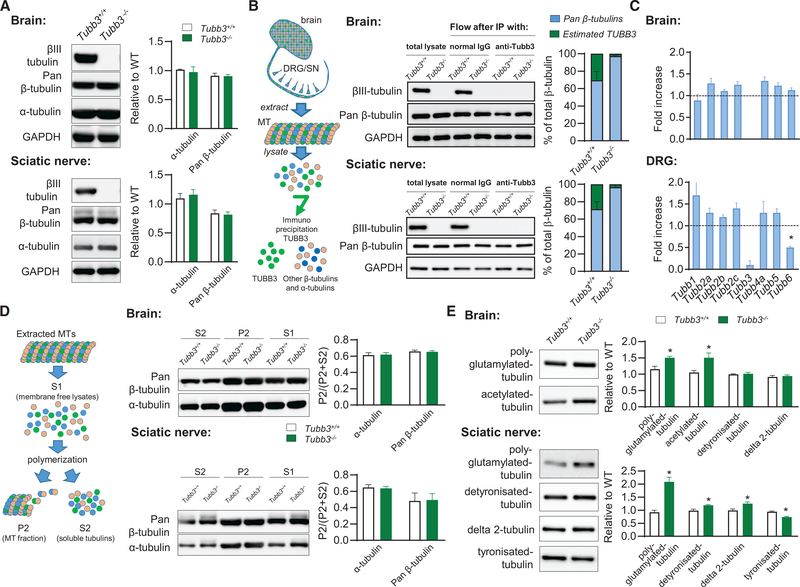
Figure 3. Tubb3−/− Mice Compensate to Have Normal Pan-tubulin Levels (A) Representative western blot (left) and quantification (right) of tubulin protein levels in adult brain (top) and sciatic nerve (bottom) tissue lysates (n = 3+/+, 3−/−). (B) Left: schematic of TUBB3 depletion experiment. TUBB3 was immunoprecipitated away from adult brain and sciatic nerve (DRG/SN) tissues lysates, with antibIII tubulin antibody to determine the relative amount of TUBB3 compared to total pan-b-tubulins. Middle: representative western blots from brain (top) and sciatic nerve (bottom). Right: quantifications (n = 3+/+, 3−/−). (B) Relative proportion of different b-tubulin isoform transcript levels in the adult brain (top) and DRG (bottom) of Tubb3−/− mice compared to wild-type animals assessed by quantitative qPCR (n = 6+/+, 6−/−). (C) Left: Schematic of MT polymerization experiment. Middle: representative western blots and quantification of MT polymerization using adult brain (top) andsciatic nerve (bottom) tissue lysates (n = 3+/+, 3−/−). (D) Representative western blot (left) and quantification (right) of tubulin post-translational modifications in adult brain (top) and sciatic nerve (bottom) tissue lysates (n = 3+/+, 3/). Error bars indicate SEM. See also Figure S3.
Figure 3. Tubb3−/− Mice Compensate to Have Normal Pan-tubulin Levels (A) Representative western blot (left) and quantification (right) of tubulin protein levels in adult brain (top) and sciatic nerve (bottom) tissue lysates (n = 3+/+, 3−/−). (B) Left: schematic of TUBB3 depletion experiment. TUBB3 was immunoprecipitated away from adult brain and sciatic nerve (DRG/SN) tissues lysates, with antibIII tubulin antibody to determine the relative amount of TUBB3 compared to total pan-b-tubulins. Middle: representative western blots from brain (top) and sciatic nerve (bottom). Right: quantifications (n = 3+/+, 3−/−). (B) Relative proportion of different b-tubulin isoform transcript levels in the adult brain (top) and DRG (bottom) of Tubb3−/− mice compared to wild-type animals assessed by quantitative qPCR (n = 6+/+, 6−/−). (C) Left: Schematic of MT polymerization experiment. Middle: representative western blots and quantification of MT polymerization using adult brain (top) andsciatic nerve (bottom) tissue lysates (n = 3+/+, 3−/−). (D) Representative western blot (left) and quantification (right) of tubulin post-translational modifications in adult brain (top) and sciatic nerve (bottom) tissue lysates (n = 3+/+, 3/). Error bars indicate SEM. See also Figure S3.CC BY-NC-ND · PubMed Central
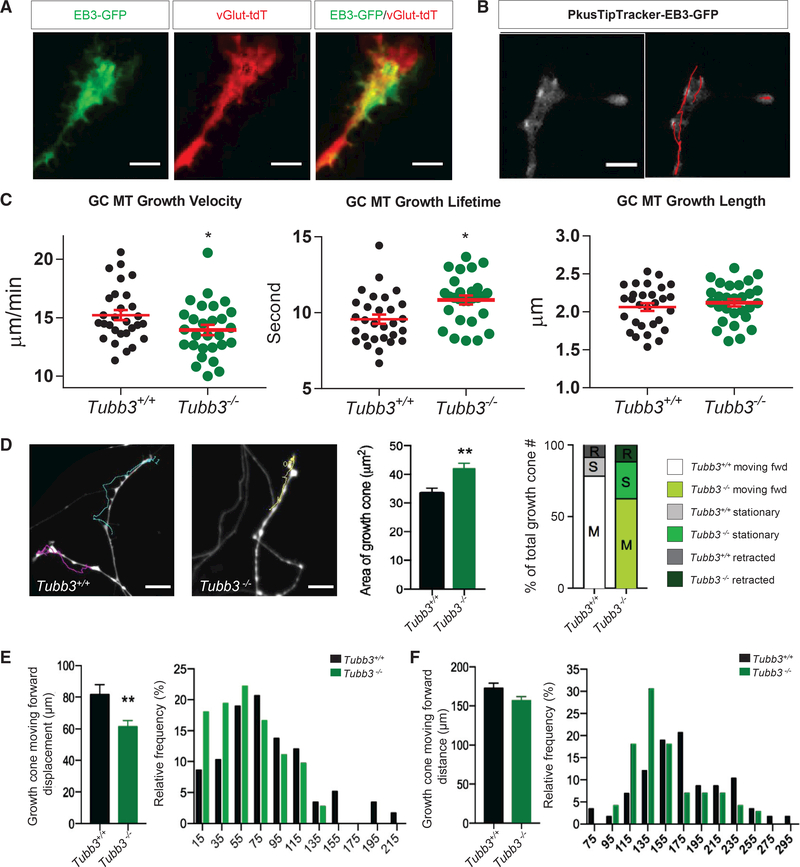
Figure 4. TUBB3 Is Critical for Growth Cone Function (A) Representative image of EB3-GFP expression in a spot-cultured adult wild-type DRG growth cone on DIV6, infected by pAAV-EB3-GFP on DIV1. EB3-GFP specifically labels the plus ends of growing MTs shown as comets (green); growth cone genetically labeled with vGlut2-Tdtomato (red). Scale bar, 20 μm. (B) Left: representative frame from a 5-min duration (2-s interval) time-lapse live-cell imaging of EB3-GFP in spot cultured DRG growth cone from adult wild-type mice on DIV6 using a total internal reflection fluorescence (TIRF) microscope with 100x TIRF lens. Right: EB3-GFP tracking (red lines) over 5min recording using PlusTipTracker software. Scale bar, 20 μm. (B) Quantifications of (B). Growth cone MT growth velocity (left), lifetime (middle), and length (right) in wild-type versus Tubb3−/− DRGs. Analysis of 100–200 comets per growth cone and 10 growth cones per experiment. n = 3 independent experiments. *p < 0.05; **p < 0.01. ns, not significant by unpaired, two-tailed Student’s t test between wild-type and Tubb3−/−mice for each condition. Scale bar, 20 μm. (C) Left: representative images of last frame of a 1-hr duration (interval, 1 min) time-lapse live-cell imaging of growth cones of spot cultured vGlut2-Tdtomatopositive DRG neurons from wild-type and Tubb3−/− mice on DIV6 (left). Colored lines track growth cone trajectories over the 1-hr recording. Scale bar, 100 mm. Middle: quantification of growth cone area. Right: percentage of growth cones retracted (R), stationary (S), and forward moving (M). n = 6 (three pairs of wild-type and Tubb3/ littermates, two spot cultures per mouse, ~25 growth cones analyzed per culture). (D) (E and F) Quantification (left) and histograms (right) of the displacement (E) and distance (F) of forward moving wild-type and Tubb3−/− growth cones from (D). **p < 0.01 by unpaired, two-tailed Student’s t test between wild-type and Tubb3−/− mice for each condition. Error bars indicate SEM. Scale bar, 100 μm.
Figure 4. TUBB3 Is Critical for Growth Cone Function (A) Representative image of EB3-GFP expression in a spot-cultured adult wild-type DRG growth cone on DIV6, infected by pAAV-EB3-GFP on DIV1. EB3-GFP specifically labels the plus ends of growing MTs shown as comets (green); growth cone genetically labeled with vGlut2-Tdtomato (red). Scale bar, 20 μm. (B) Left: representative frame from a 5-min duration (2-s interval) time-lapse live-cell imaging of EB3-GFP in spot cultured DRG growth cone from adult wild-type mice on DIV6 using a total internal reflection fluorescence (TIRF) microscope with 100x TIRF lens. Right: EB3-GFP tracking (red lines) over 5min recording using PlusTipTracker software. Scale bar, 20 μm. (B) Quantifications of (B). Growth cone MT growth velocity (left), lifetime (middle), and length (right) in wild-type versus Tubb3−/− DRGs. Analysis of 100–200 comets per growth cone and 10 growth cones per experiment. n = 3 independent experiments. *p < 0.05; **p < 0.01. ns, not significant by unpaired, two-tailed Student’s t test between wild-type and Tubb3−/−mice for each condition. Scale bar, 20 μm. (C) Left: representative images of last frame of a 1-hr duration (interval, 1 min) time-lapse live-cell imaging of growth cones of spot cultured vGlut2-Tdtomatopositive DRG neurons from wild-type and Tubb3−/− mice on DIV6 (left). Colored lines track growth cone trajectories over the 1-hr recording. Scale bar, 100 mm. Middle: quantification of growth cone area. Right: percentage of growth cones retracted (R), stationary (S), and forward moving (M). n = 6 (three pairs of wild-type and Tubb3/ littermates, two spot cultures per mouse, ~25 growth cones analyzed per culture). (D) (E and F) Quantification (left) and histograms (right) of the displacement (E) and distance (F) of forward moving wild-type and Tubb3−/− growth cones from (D). **p < 0.01 by unpaired, two-tailed Student’s t test between wild-type and Tubb3−/− mice for each condition. Error bars indicate SEM. Scale bar, 100 μm.CC BY-NC-ND · PubMed Central
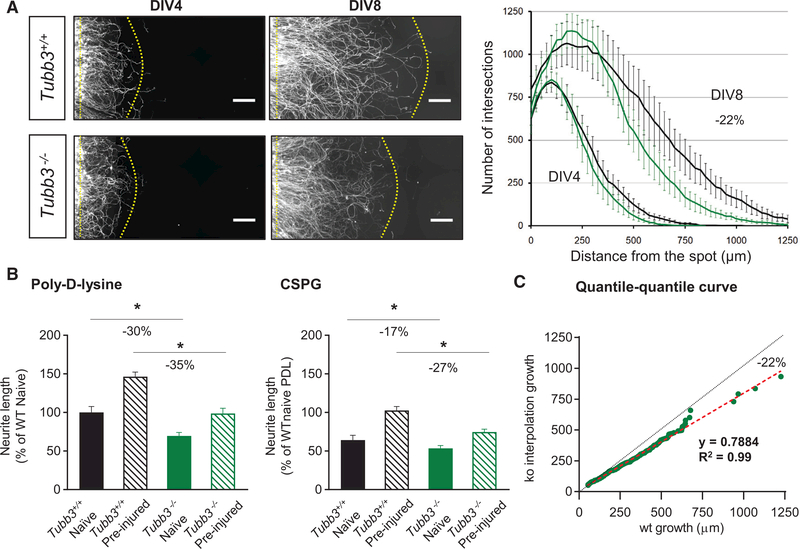
Figure 5. Axonal Growth Is Linear and Reduced by 20% in Absence of TUBB3 (A) Left: high magnification of neurite outgrowth in Tubb3−/− versus wild-type spot cultures at DIV4 and DIV8. Scale bar, 50 mm. Right: quantification of Sholl analysis. The black and green lines represent WT and Tubb3−/− growth, respectively. n = 8. Scale bar, 50 μm. (B) Quantifications of growth of naive versus pre-conditioned wild-type and Tubb3−/− DRG neurons on poly-D-lysine neutral substrate and on CSPG inhibitory substrate. *p < 0.05. One-way ANOVA, post hoc Sidak’s. n = 12 wells per condition. (C) Quantile-quantile curve of Tubb3−/− neurite growth normalized to wild-type samples. Green dots represent neurite growth for each Tubb3−/− Tubb3−/− DRG neuron calculated by interpolation. Dashed black line represents WT growth. Dashed-red line is the linear regression of Tubb3/ neurite outgrowth. n = 486 neurons. Error bars indicate SEM. See also Figure S4.
Figure 5. Axonal Growth Is Linear and Reduced by 20% in Absence of TUBB3 (A) Left: high magnification of neurite outgrowth in Tubb3−/− versus wild-type spot cultures at DIV4 and DIV8. Scale bar, 50 mm. Right: quantification of Sholl analysis. The black and green lines represent WT and Tubb3−/− growth, respectively. n = 8. Scale bar, 50 μm. (B) Quantifications of growth of naive versus pre-conditioned wild-type and Tubb3−/− DRG neurons on poly-D-lysine neutral substrate and on CSPG inhibitory substrate. *p < 0.05. One-way ANOVA, post hoc Sidak’s. n = 12 wells per condition. (C) Quantile-quantile curve of Tubb3−/− neurite growth normalized to wild-type samples. Green dots represent neurite growth for each Tubb3−/− Tubb3−/− DRG neuron calculated by interpolation. Dashed black line represents WT growth. Dashed-red line is the linear regression of Tubb3/ neurite outgrowth. n = 486 neurons. Error bars indicate SEM. See also Figure S4.CC BY-NC-ND · PubMed Central
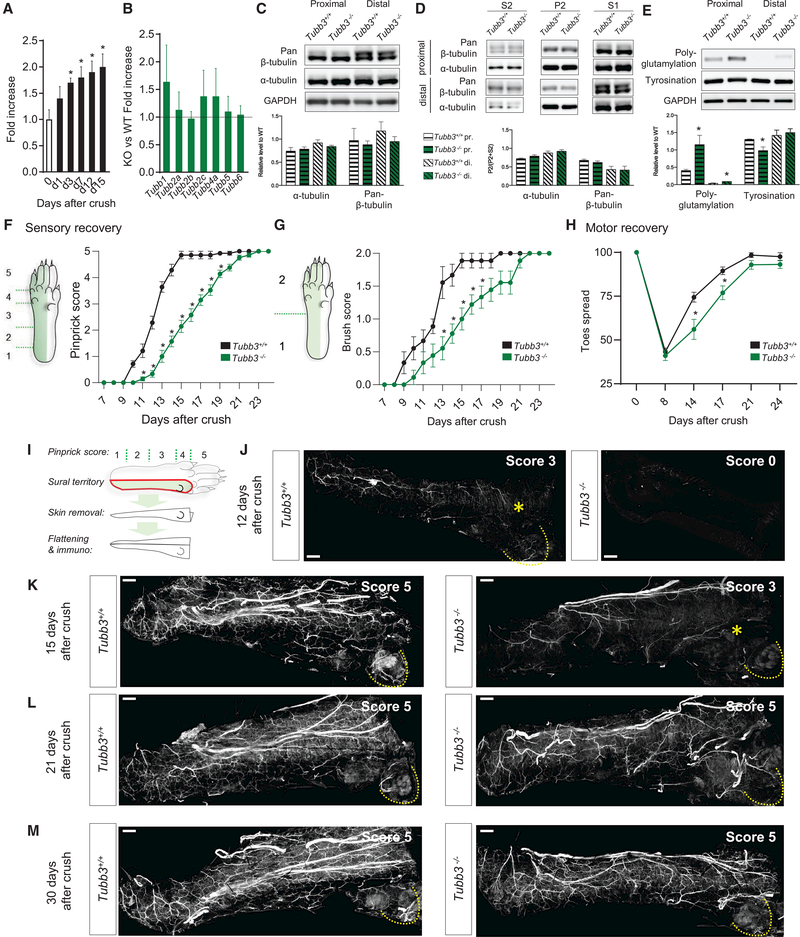
Figure 6. Lack of TUBB3 Delays Peripheral Nerve Regeneration (A) qPCR time course of Tubb3 fold increase in DRG after sciatic nerve crush (n = 9 per time point). *p < 0.05. One-way ANOVA, post hoc Dunnett’s. (B) Fold ratio of the upregulation of transcript levels of different β-tubulin isoforms in DRG after sciatic nerve crush (n = 6+/+, 6−/−). (C) Representative western blot (top) and quantification (bottom) ofα- and pan-β-tubulin levels from tissue lysates of segments of the sciatic nerve proximal and distal to the crush site 7 days after crush (n = 3+/+, 3−/−). (D) Representative western blot (top) and quantification (bottom) of MT polymerization using proximal and distal segments of the sciatic nerve tissue lysates7 days after crush (n = 3+/+, 3−/−). (E) Representative western blot (top) and quantification (bottom) of levels of polyglutamylated and tyronisated tubulin in proximal and distal segments of thesciatic nerve tissue lysates 7 days after crush (n = 3+/+, 3−/−). (E) Pinprick assay scores over 24 days following sciatic nerve crush (N = 21+/+, 14−/−). *p < 0.05. Two-way RM ANOVA, post hoc Sidak’s. (F) Brush assay scores over 24 days following sciatic nerve crush (N = 9+/+, 9−/−). *p < 0.05. Two-way RM ANOVA, post hoc Sidak’s (n = 9). (G) Toes spread in % of pre-injury after sciatic nerve crush (N = 9+/+, 9−/−). *p < 0.05. Two-way RM ANOVA, post hoc Sidak’s. (I–M) Drawing representing the skin region harvested and processed for immunostaining. Mice were tested for pinprick, given a score, and then the skin corresponding to the sural territory was harvested, fixed, unfolded, and processed for whole-mount staining against NF200 (I). Imaging was carried out from the dermis to the epidermis at 12 (J), 15 (K), 21 (L), and 30 (M) days after sciatic nerve crush. Pinprick score from each animal sampled is indicated in top-right corner of each picture. For score 3, the yellow star indicates the position of the last positive behavioral response. Scale bar, 500 μm. Error bars indicate SEM. See also Figure S5.
Figure 6. Lack of TUBB3 Delays Peripheral Nerve Regeneration (A) qPCR time course of Tubb3 fold increase in DRG after sciatic nerve crush (n = 9 per time point). *p < 0.05. One-way ANOVA, post hoc Dunnett’s. (B) Fold ratio of the upregulation of transcript levels of different β-tubulin isoforms in DRG after sciatic nerve crush (n = 6+/+, 6−/−). (C) Representative western blot (top) and quantification (bottom) ofα- and pan-β-tubulin levels from tissue lysates of segments of the sciatic nerve proximal and distal to the crush site 7 days after crush (n = 3+/+, 3−/−). (D) Representative western blot (top) and quantification (bottom) of MT polymerization using proximal and distal segments of the sciatic nerve tissue lysates7 days after crush (n = 3+/+, 3−/−). (E) Representative western blot (top) and quantification (bottom) of levels of polyglutamylated and tyronisated tubulin in proximal and distal segments of thesciatic nerve tissue lysates 7 days after crush (n = 3+/+, 3−/−). (E) Pinprick assay scores over 24 days following sciatic nerve crush (N = 21+/+, 14−/−). *p < 0.05. Two-way RM ANOVA, post hoc Sidak’s. (F) Brush assay scores over 24 days following sciatic nerve crush (N = 9+/+, 9−/−). *p < 0.05. Two-way RM ANOVA, post hoc Sidak’s (n = 9). (G) Toes spread in % of pre-injury after sciatic nerve crush (N = 9+/+, 9−/−). *p < 0.05. Two-way RM ANOVA, post hoc Sidak’s. (I–M) Drawing representing the skin region harvested and processed for immunostaining. Mice were tested for pinprick, given a score, and then the skin corresponding to the sural territory was harvested, fixed, unfolded, and processed for whole-mount staining against NF200 (I). Imaging was carried out from the dermis to the epidermis at 12 (J), 15 (K), 21 (L), and 30 (M) days after sciatic nerve crush. Pinprick score from each animal sampled is indicated in top-right corner of each picture. For score 3, the yellow star indicates the position of the last positive behavioral response. Scale bar, 500 μm. Error bars indicate SEM. See also Figure S5.CC BY-NC-ND · PubMed Central
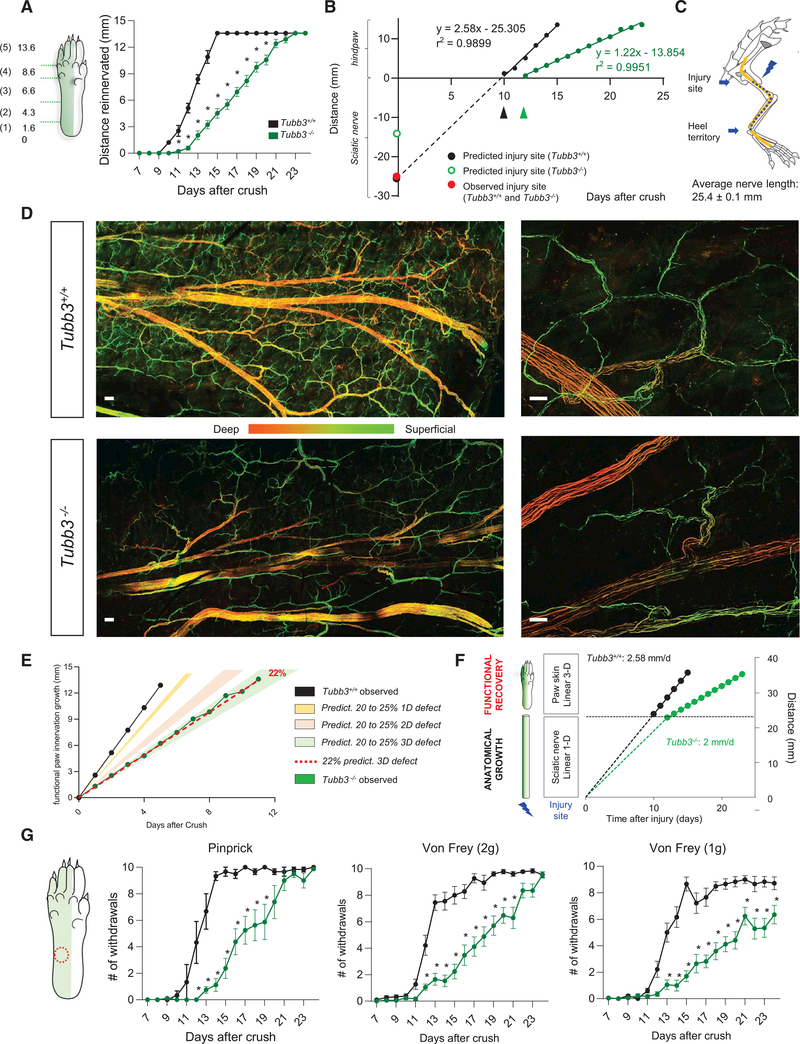
Figure 7. Functional Recovery Requires Reinnervation of a Volume that Exacerbates Delay in Tubb3/ Mice (A) Functional recovery of pinprick response in wild-type and Tubb3−/− mice expressed as a distance from heel of regenerated pinprick-responsive fibers at various days after sciatic nerve crush. *p < 0.05. Two-way RM ANOVA, post hoc Sidak’s. (N = 21+/+, 14−/−). (B) Linear regression of functional recovery of pinprick responses. In wild-type mice, this predicts the site of injury (intersection point on the y axis, black dot) and the rate of regeneration (2.58 mm per day). In Tubb3−/− mice, this linear regression cannot predict the site of injury (red dot). Blue dot represents the observed distance to the site of injury in both wild-type and Tubb3−/− mice. (C) Confirmation of the distance between the site of injury in the sciatic nerve crush model and the beginning of the heel territory, where pinprick testing begins(N = 9+/+, 9−/−). (D) Regenerating nerves stained with NF-H in whole-mount hindpaw skin of wild-type and Tubb3−/− mice after sciatic nerve crush (pinprick score 5 + 7 days). The stained fibers are pseudo-colored based on their depth within the skin tissue. Scale bar, 100 (left) and 25 mm (right), (n = 3+/+, 3−/− per time point). (E) Model for functional recovery delay in Tubb3−/− mice compared to wild-type mice. Filled circles represent experimental points while the curves are extrapolated from a linear growth and a 22% delay in Tubb3/ mice. Predicted recovery of a 20 to 25% defect in growth compared to wild-type in 1D (yellow; length on a simple plane), 2D (pink; growth in an area), and 3D (green; growth in a volume). Dotted red line indicates a 22% defect in growth compared to wild-type in 3D; this is the same defect we observed in vitro. (F) Consequences of a 22% slower regeneration rate on growth within the sciatic nerve and on functional recovery assessed by the pinprick test. Fibers need to occupy a volume for functional recovery within the hindpaw, which exacerbates the delay in Tubb3−/− mice. (G) Time course of mechanical sensitivity for pinprick and 2-g, and 1-g pressures in wild-type and Tubb3−/−mice after peripheral nerve crush (N = 9+/+; 10−/− for vF, N = 8+/+; 8−/− for pinprick). The skin area tested is indicated by the red-dotted circle. *p < 0.05. Two-way RM ANOVA, post hoc Sidak’s. Error bars indicate SEM.
Figure 7. Functional Recovery Requires Reinnervation of a Volume that Exacerbates Delay in Tubb3/ Mice (A) Functional recovery of pinprick response in wild-type and Tubb3−/− mice expressed as a distance from heel of regenerated pinprick-responsive fibers at various days after sciatic nerve crush. *p < 0.05. Two-way RM ANOVA, post hoc Sidak’s. (N = 21+/+, 14−/−). (B) Linear regression of functional recovery of pinprick responses. In wild-type mice, this predicts the site of injury (intersection point on the y axis, black dot) and the rate of regeneration (2.58 mm per day). In Tubb3−/− mice, this linear regression cannot predict the site of injury (red dot). Blue dot represents the observed distance to the site of injury in both wild-type and Tubb3−/− mice. (C) Confirmation of the distance between the site of injury in the sciatic nerve crush model and the beginning of the heel territory, where pinprick testing begins(N = 9+/+, 9−/−). (D) Regenerating nerves stained with NF-H in whole-mount hindpaw skin of wild-type and Tubb3−/− mice after sciatic nerve crush (pinprick score 5 + 7 days). The stained fibers are pseudo-colored based on their depth within the skin tissue. Scale bar, 100 (left) and 25 mm (right), (n = 3+/+, 3−/− per time point). (E) Model for functional recovery delay in Tubb3−/− mice compared to wild-type mice. Filled circles represent experimental points while the curves are extrapolated from a linear growth and a 22% delay in Tubb3/ mice. Predicted recovery of a 20 to 25% defect in growth compared to wild-type in 1D (yellow; length on a simple plane), 2D (pink; growth in an area), and 3D (green; growth in a volume). Dotted red line indicates a 22% defect in growth compared to wild-type in 3D; this is the same defect we observed in vitro. (F) Consequences of a 22% slower regeneration rate on growth within the sciatic nerve and on functional recovery assessed by the pinprick test. Fibers need to occupy a volume for functional recovery within the hindpaw, which exacerbates the delay in Tubb3−/− mice. (G) Time course of mechanical sensitivity for pinprick and 2-g, and 1-g pressures in wild-type and Tubb3−/−mice after peripheral nerve crush (N = 9+/+; 10−/− for vF, N = 8+/+; 8−/− for pinprick). The skin area tested is indicated by the red-dotted circle. *p < 0.05. Two-way RM ANOVA, post hoc Sidak’s. Error bars indicate SEM.CC BY-NC-ND · PubMed Central

Verification

Claims the paper makes

The claims and statistics of this paper haven’t been checked yet.

Run the check — free, no account needed. It reads the open-access text and checks the sources it cites.

A few free checks a day · papers already verified open instantly · results are public

Claims other papers make about this one

Each is checked against this paper’s own text: does it say what the citing paper says it does?

Self-check

Percentages, sums and reported differences re-computed from the paper’s own numbers.

The self-check needs the paper’s full text.

Citations

Cites

Show all 56 references

Cited by

See all 183

Metadata

Authors
Latremoliere, A., Cheng, L., DeLisle, M., Wu, C., Chew, S., Hutchinson, E. B., Sheridan, A., Alexandre, C., Latremoliere, F., Sheu, S.-H., Golidy, S., Omura, T., Huebner, E. A., Fan, Y., Whitman, M. C., Nguyen, E., Hermawan, C., Pierpaoli, C., Tischfield, M. A., Woolf, C. J., & Engle, E. C.
Venue
Cell Reports
Publisher
Elsevier BV
Published
2018-08
Volume
24
Issue
7
Pages
1865-1879.e9
ISSN
2211-1247
Cited by
183
References
56
Language
en
Licence
Funders
  • Dr. Miriam and Sheldon G. Adelson Medical Research Foundation
  • National Institutes of Health (5T32HL110852-05, K08EY027850)
  • Congressionally Directed Medical Research Programs (W81XWH-13-2-0019)
  • Howard Hughes Medical Institute

About these checks

Registry, retraction, Cites and statistics results are computed, not judged, with one exception: a printed reference that no index lists is read once by a model before it counts as a citation error. Claims are extracted by a model and kept only when their quote appears verbatim in the text; each cited source is then checked, with a model’s help, for whether it says what the claim relies on. Those verdicts can be wrong — read the claim’s quote and the cited source before relying on one.

Statistics and arithmetic are recomputed, not judged.

Confidence bands are shown only for fields calibrated on our annotated test set. None is calibrated yet, so no band is shown.

What counts as a claim ›How we measure confidence ›How we check this ›

Are you an author, or do you see a problem with this page? Request a review

How to cite

Cite CoChat for the checks on this page, and the paper for its own findings.

This page
CoChat. (2026). Citation check: Neuronal-Specific TUBB3 Is Not Required for Normal Neuronal Function but Is Essential for Timely Axon Regeneration. https://app.cochat.ai/papers/10.1016/j.celrep.2018.07.029
The paper
Latremoliere, A., Cheng, L., DeLisle, M., Wu, C., Chew, S., Hutchinson, E. B., Sheridan, A., Alexandre, C., Latremoliere, F., Sheu, S.-H., Golidy, S., Omura, T., Huebner, E. A., Fan, Y., Whitman, M. C., Nguyen, E., Hermawan, C., Pierpaoli, C., Tischfield, M. A., . . . Engle, E. C. (2018). Neuronal-Specific TUBB3 Is Not Required for Normal Neuronal Function but Is Essential for Timely Axon Regeneration. Cell Reports. https://doi.org/10.1016/j.celrep.2018.07.029

Data sources

Bibliographic data: Semantic Scholar, OpenAlex, Crossref.

Contains information from the Semantic Scholar Academic Graph Datasets, made available under the ODC Attribution License (ODC-BY 1.0).

Semantic Scholar’s data is described in: Kinney, R., et al. (2023). The Semantic Scholar Open Data Platform. arXiv:2301.10140.