Student or educator? Sign up with your school email and get 6 months of Pro free.
Cited by 16Bacteriophages and microbial interactionsBacterial Genetics and BiotechnologyEvolution and Genetic Dynamics

The DOI matches its Crossref record; 141 of the 141 references it cites were found in a registry or an index.

Systematic, high-throughput characterization of bacteriophage gene essentiality on diverse hosts

Open access

Published version of a preprint

Abstract

Understanding core and conditional gene essentiality is crucial for decoding genotype-phenotype relationships in organisms. We present phage high-throughput approach for gene essentiality mapping and profiling (PhageMaP), a high-throughput method to create genome-scale loss-of-function libraries for systematically assessing gene essentiality in bacteriophages. Using PhageMaP across diverse hosts, we generate gene essentiality maps for all or most genes in the model phages T7 and T4, as well as the non-model phage Bas63. These maps provide fundamental insights into genome organization, gene function, and host-specific conditional essentiality. By applying PhageMaP to a collection of anti-phage defense systems, we uncover phage genes that either inhibit or activate six defenses and offer mechanistic hypotheses. Furthermore, we engineer synthetic phages with enhanced infectivity by modular transfer of a PhageMaP-discovered defense inhibitor from Bas63 to T7. PhageMaP advances bacteriophage functional genomics and accelerates rational phage design for therapy.

Overview

The claims and statistics of this paper haven’t been checked yet.

Run the check — free, no account needed. It reads the open-access text and checks the sources it cites.

A few free checks a day · papers already verified open instantly · results are public

Integrity signals

Registry

Crossref · 10.1016/j.chom.2025.06.018

Cites

141 of 141 references verified0 citation errors · 0 not checkable

Statistics

Figures

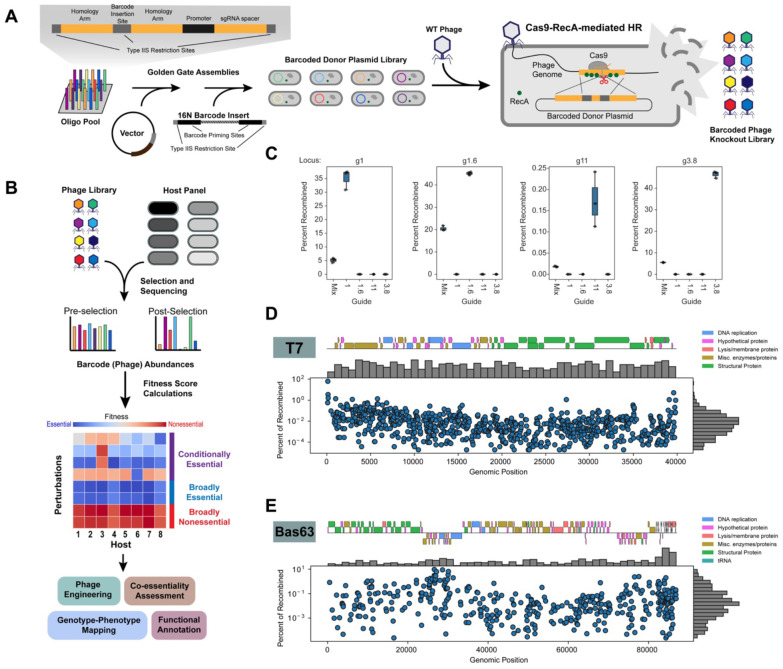
Figure 1. PhageMaP creates barcoded genome-wide knockout libraries in phages. (A) Scheme for generating barcoded phage knockout libraries. Oligos containing target-specific 95nt homology arms and sgRNAs are cloned into a high-copy number vector. 16N barcodes are subsequently added to generate a barcoded donor plasmid library. This library is infected by WT T7 and Cas9-RecA-mediated homologous recombination (HR) inserts barcodes into designated loci. (B) Screening of the PhageMaP libraries on diverse hosts. The pre- and post-selection abundances of phage variants are quantified with deep sequencing. Each variant is then scored to create context-specific gene essentiality profiles. (C) Validation of barcode insertions into four T7 genomic loci. Cas9-RecA-mediated HR was carried out using 1 of 4 sgRNAs or a mix of the 4 sgRNAs in pooled format. The four genomic loci were sequenced, and the percentage of recombined phages was determined by finding the ratio of insertions to total reads. (D) Distribution and mapping of the T7 PhageMaP library. (E) Distribution and mapping of the Bas63 PhageMaP library.
Figure 1. PhageMaP creates barcoded genome-wide knockout libraries in phages. (A) Scheme for generating barcoded phage knockout libraries. Oligos containing target-specific 95nt homology arms and sgRNAs are cloned into a high-copy number vector. 16N barcodes are subsequently added to generate a barcoded donor plasmid library. This library is infected by WT T7 and Cas9-RecA-mediated homologous recombination (HR) inserts barcodes into designated loci. (B) Screening of the PhageMaP libraries on diverse hosts. The pre- and post-selection abundances of phage variants are quantified with deep sequencing. Each variant is then scored to create context-specific gene essentiality profiles. (C) Validation of barcode insertions into four T7 genomic loci. Cas9-RecA-mediated HR was carried out using 1 of 4 sgRNAs or a mix of the 4 sgRNAs in pooled format. The four genomic loci were sequenced, and the percentage of recombined phages was determined by finding the ratio of insertions to total reads. (D) Distribution and mapping of the T7 PhageMaP library. (E) Distribution and mapping of the Bas63 PhageMaP library.CC BY-NC-ND · PubMed Central
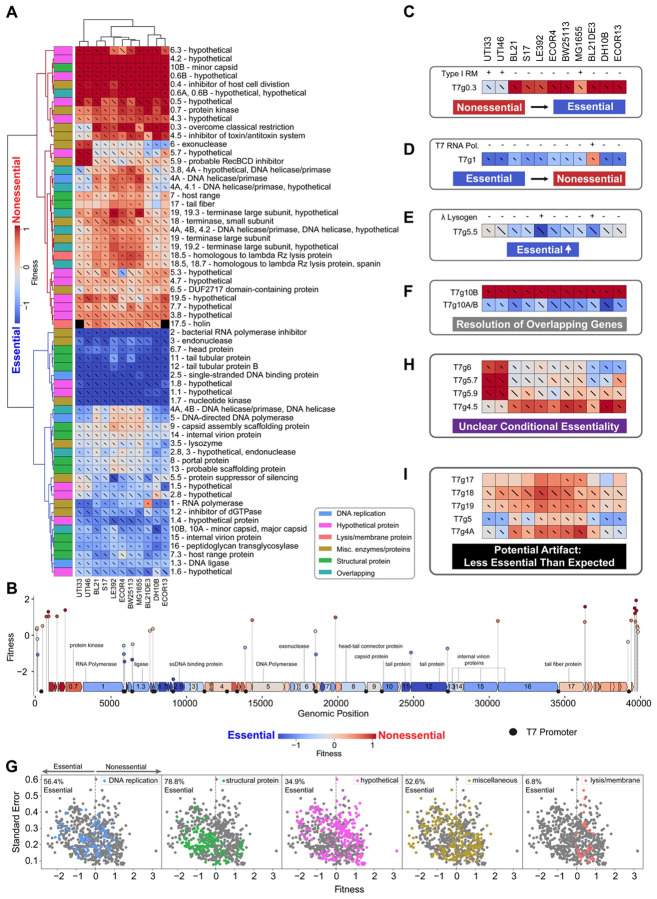
Figure 2. PhageMaP recapitulates established biology and uncovers novel insights in model T7 phage. (A) Heatmap of the T7 fitness scores after Z-normalization within each of the 11 conditions. To better emphasize differences outside the two extremes of the data, a 10th percentile floor and 90th percentile ceiling were imposed for the color scaling. The lines through each cell represent the standard error (SE) where a full line represents SE≥1. Clustering was performed using the Euclidean metric and Ward linkage method. Metadata describes general classification of each gene. (B) Plot mapping the genomic coordinates and scores for intergenic perturbations. The points (intergenic variants) and blocks (genes) are colored using the same scale as (A). The gene scores used for coloring are the medians of scores from each tested condition. Instances from (A) of (C) generally nonessential genes that become more essential. The presence of intact Type I restriction-modification systems was determined by used PADLOC121. Instances from (A) of (D) generally essential genes that become more nonessential, (E) moderately essential gene becoming more essential, and (F) resolution of overlapping genetic elements. (G) Scatter plots showing the fitness scores and standard errors for each fitness measurement for the 11 hosts. Points corresponding to each classification are highlighted by color. Dotted lines represent the threshold for “nonessential” and “essential” genes. Instances from (A) of (H) unclear conditional essentiality and (I) potential artifacts involving characterized genes.
Figure 2. PhageMaP recapitulates established biology and uncovers novel insights in model T7 phage. (A) Heatmap of the T7 fitness scores after Z-normalization within each of the 11 conditions. To better emphasize differences outside the two extremes of the data, a 10th percentile floor and 90th percentile ceiling were imposed for the color scaling. The lines through each cell represent the standard error (SE) where a full line represents SE≥1. Clustering was performed using the Euclidean metric and Ward linkage method. Metadata describes general classification of each gene. (B) Plot mapping the genomic coordinates and scores for intergenic perturbations. The points (intergenic variants) and blocks (genes) are colored using the same scale as (A). The gene scores used for coloring are the medians of scores from each tested condition. Instances from (A) of (C) generally nonessential genes that become more essential. The presence of intact Type I restriction-modification systems was determined by used PADLOC121. Instances from (A) of (D) generally essential genes that become more nonessential, (E) moderately essential gene becoming more essential, and (F) resolution of overlapping genetic elements. (G) Scatter plots showing the fitness scores and standard errors for each fitness measurement for the 11 hosts. Points corresponding to each classification are highlighted by color. Dotted lines represent the threshold for “nonessential” and “essential” genes. Instances from (A) of (H) unclear conditional essentiality and (I) potential artifacts involving characterized genes.CC BY-NC-ND · PubMed Central
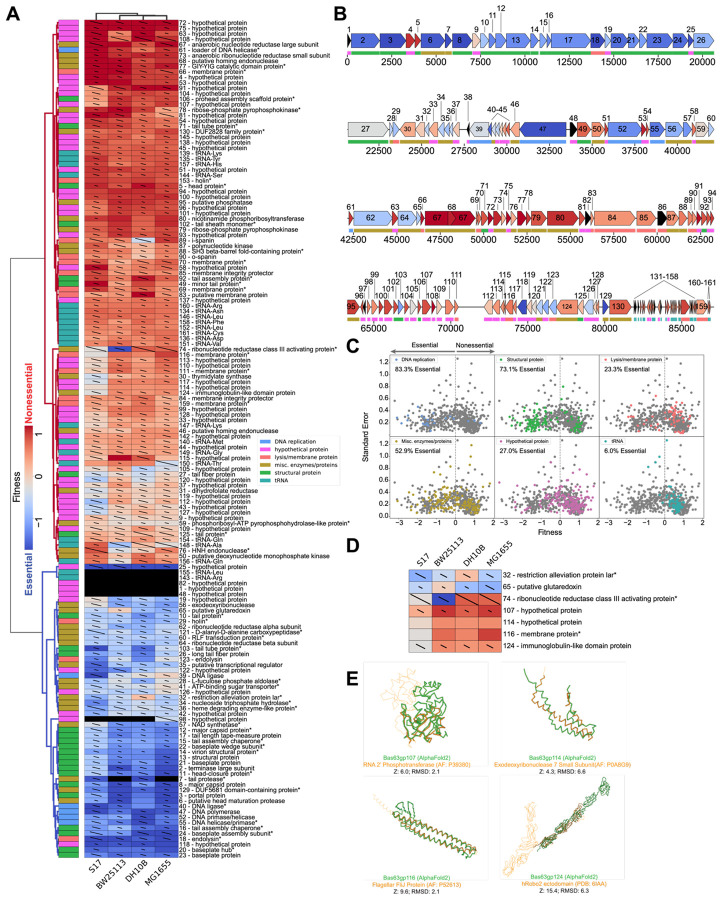
Figure 3. PhageMaP creates gene essentiality profiles for a non-model Bas63 phage. (A) Heatmap of the Bas63 fitness scores after Z-normalization within each of the 4 conditions. To better emphasize differences outside the two extremes of the data, a 10th percentile floor and a 90th percentile ceiling were imposed for the color scaling. The lines through each cell represent the standard error (SE) where a full line represents SE≥1. Clustering was performed using the Euclidean metric and Ward linkage method. Metadata describes general classification of each gene. Black boxes indicate no data was obtained for the gene in the corresponding condition. A black dot at the top right corner of a cell indicates only one replicate was obtained. Asterisks at the end of gene names indicate genes which were manually annotated after BLASTp search. (B) Bas63 genome architecture colored by the median fitness score for each gene from the tested conditions. Color scaling is the same as (A). (C) Scatter plots showing the fitness scores and standard errors for each fitness measurement for the 11 hosts. Points corresponding to each classification are highlighted by color. Dotted lines represent the threshold for “nonessential” and “essential” genes. (D) Patterns of conditional essentiality from (A). (E) Structural similarities between conditionally essential proteins and proteins found within the AlphaFold database and the PDB.
Figure 3. PhageMaP creates gene essentiality profiles for a non-model Bas63 phage. (A) Heatmap of the Bas63 fitness scores after Z-normalization within each of the 4 conditions. To better emphasize differences outside the two extremes of the data, a 10th percentile floor and a 90th percentile ceiling were imposed for the color scaling. The lines through each cell represent the standard error (SE) where a full line represents SE≥1. Clustering was performed using the Euclidean metric and Ward linkage method. Metadata describes general classification of each gene. Black boxes indicate no data was obtained for the gene in the corresponding condition. A black dot at the top right corner of a cell indicates only one replicate was obtained. Asterisks at the end of gene names indicate genes which were manually annotated after BLASTp search. (B) Bas63 genome architecture colored by the median fitness score for each gene from the tested conditions. Color scaling is the same as (A). (C) Scatter plots showing the fitness scores and standard errors for each fitness measurement for the 11 hosts. Points corresponding to each classification are highlighted by color. Dotted lines represent the threshold for “nonessential” and “essential” genes. (D) Patterns of conditional essentiality from (A). (E) Structural similarities between conditionally essential proteins and proteins found within the AlphaFold database and the PDB.CC BY-NC-ND · PubMed Central
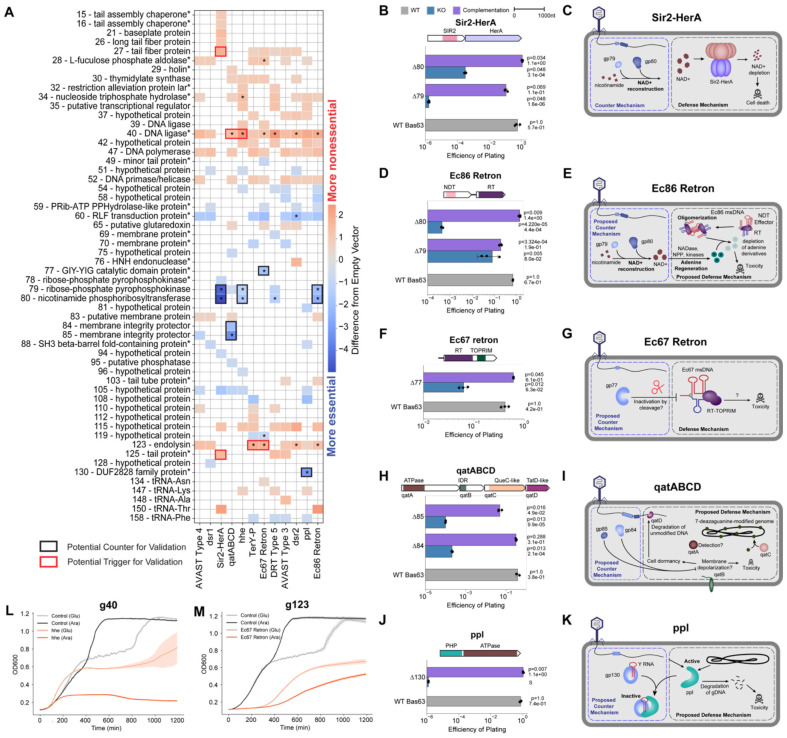
Figure 4. PhageMaP identifies anti-phage defense counters and triggers in Bas63 phage. (A) Plot showing all identified uncorrected significant hits (Welch’s t-test, p<0.05) and significant hits after multiple testing correction with the Benjamini-Hochberg method (q<0.1, denoted by an asterisk in each tile) with a score that is at least a difference of 0.5 from the control. The color of the tiles represents the difference in Z-normalized fitness scores between with defense and the control. Black boxes indicate targets deem to be potential counters to a defense system and subjected for secondary validation. Red boxes indicate targets deem to be potential triggers for a defense system and subjected for secondary validation. Asterisks at the end of gene names indicate genes which were manually annotated after BLASTp search. (B) Efficiency of plating (EOP) measurements for Bas63 knockouts with the Sir2-HerA host. Average titers on the control strain were first determined (3 technical replicates). Each point on the plot represents a technical replicate for EOP using those calculated averages as the denominator for each titer measurement on the defense host. Bars represent the mean of three replicates, and error bars denote the standard deviation. Hypothesis testing was performed pairwise with each knockout and WT. P-values (Welch’s t-test) and means are annotated above the bars. Complementation host contained the defense system and a plasmid expressing deleted gene. (C) Mechanisms of defense and counter-defense for Sir2-HerA. (D) EOPs for Ec86 retron calculated the same way as (B). (E) Proposed mechanisms of defense and counter-defense for Ec86 retron. (F) EOPs for Ec67 retron calculated the same way as (B). (G) Proposed mechanisms of defense and counter-defense for Ec67 retron. (H) EOPs for qatABCD calculated the same way as (B). (I) Proposed mechanisms of defense and counter-defense for qatABCD. (J) EOPs for ppl calculated the same way as (B). Since plaques were too small to count, an ‘S’ was annotated in lieu of a plaquing efficiency. The plotted efficiency is the highest Bas63Δ130 dilution for which zones of clearing were observable and clear on a spot plate. (K) Proposed mechanisms of defense and counter-defense for ppl. (L) Growth curves for expression of g40 in cells containing no exogenous defense or the hhe system. 1 x 10⁷ cells were either repressed with 0.2% glucose (uninduced) or induced with 0.1% L-arabinose and grown for ~20hrs. Central line represents the average of 3 replicates and the shaded flanking regions represent the standard deviation. (M) Growth curves for expression of g123 in cells containing no exogenous defense or the Ec67 retron system. Experiment was performed and plot was constructed the same way as (H).
Figure 4. PhageMaP identifies anti-phage defense counters and triggers in Bas63 phage. (A) Plot showing all identified uncorrected significant hits (Welch’s t-test, p<0.05) and significant hits after multiple testing correction with the Benjamini-Hochberg method (q<0.1, denoted by an asterisk in each tile) with a score that is at least a difference of 0.5 from the control. The color of the tiles represents the difference in Z-normalized fitness scores between with defense and the control. Black boxes indicate targets deem to be potential counters to a defense system and subjected for secondary validation. Red boxes indicate targets deem to be potential triggers for a defense system and subjected for secondary validation. Asterisks at the end of gene names indicate genes which were manually annotated after BLASTp search. (B) Efficiency of plating (EOP) measurements for Bas63 knockouts with the Sir2-HerA host. Average titers on the control strain were first determined (3 technical replicates). Each point on the plot represents a technical replicate for EOP using those calculated averages as the denominator for each titer measurement on the defense host. Bars represent the mean of three replicates, and error bars denote the standard deviation. Hypothesis testing was performed pairwise with each knockout and WT. P-values (Welch’s t-test) and means are annotated above the bars. Complementation host contained the defense system and a plasmid expressing deleted gene. (C) Mechanisms of defense and counter-defense for Sir2-HerA. (D) EOPs for Ec86 retron calculated the same way as (B). (E) Proposed mechanisms of defense and counter-defense for Ec86 retron. (F) EOPs for Ec67 retron calculated the same way as (B). (G) Proposed mechanisms of defense and counter-defense for Ec67 retron. (H) EOPs for qatABCD calculated the same way as (B). (I) Proposed mechanisms of defense and counter-defense for qatABCD. (J) EOPs for ppl calculated the same way as (B). Since plaques were too small to count, an ‘S’ was annotated in lieu of a plaquing efficiency. The plotted efficiency is the highest Bas63Δ130 dilution for which zones of clearing were observable and clear on a spot plate. (K) Proposed mechanisms of defense and counter-defense for ppl. (L) Growth curves for expression of g40 in cells containing no exogenous defense or the hhe system. 1 x 10⁷ cells were either repressed with 0.2% glucose (uninduced) or induced with 0.1% L-arabinose and grown for ~20hrs. Central line represents the average of 3 replicates and the shaded flanking regions represent the standard deviation. (M) Growth curves for expression of g123 in cells containing no exogenous defense or the Ec67 retron system. Experiment was performed and plot was constructed the same way as (H).CC BY-NC-ND · PubMed Central
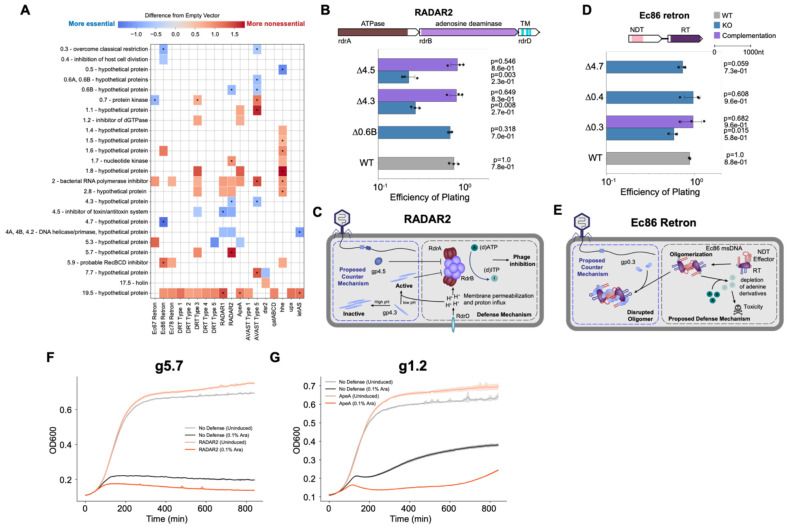
Figure 5. PhageMaP identifies anti-phage defense counters and triggers in T7 phage. (A) Plot showing all identified uncorrected significant hits (Welch’s t-test, p<0.05) and significant hits after multiple testing correction with the Benjamini-Hochberg method (q<0.1, denoted by an asterisk in each tile) with a score that is at least a difference of 0.5 from the control. The color of the tiles represents the difference in Z-normalized fitness scores between with defense and an Empty Vector control. (B) EOPs for T7 knockouts with the RADAR2 host. Average titers on the control strain were first determined (3 technical replicates). Each point on the plot represents a technical replicate for EOP using those calculated averages as the denominator for each titer measurement on the defense host. Bars represent the mean of three replicates, and error bars denote the standard deviation. Hypothesis testing was performed pairwise with each knockout (KO) and WT. P-values (Welch’s t-test) and means are annotated above the bars. Complementation host contained the defense system and a plasmid expressing deleted gene. (C) Proposed model of defense and counter-defense for RADAR2. (D) EOPs for T7 knockouts with the Ec86 retron host. Plot was generated the same as B. (E) Proposed model of defense and counter-defense for Ec86 retron. (F) Growth curves for expression of g5.7 in cells containing no exogenous defense or the RADAR2 system. 1 x 10⁷ cells were either repressed with 0.2% glucose (uninduced) or induced with 0.1% L-arabinose and grown for ~14hrs. Central line represents the average of 3 replicates and the shaded flanking regions represent the standard deviation. (G) Growth curves for expression of g1.2 in cells containing no exogenous defense or the ApeA system. Experiment was performed and plot made the same way as F.
Figure 5. PhageMaP identifies anti-phage defense counters and triggers in T7 phage. (A) Plot showing all identified uncorrected significant hits (Welch’s t-test, p<0.05) and significant hits after multiple testing correction with the Benjamini-Hochberg method (q<0.1, denoted by an asterisk in each tile) with a score that is at least a difference of 0.5 from the control. The color of the tiles represents the difference in Z-normalized fitness scores between with defense and an Empty Vector control. (B) EOPs for T7 knockouts with the RADAR2 host. Average titers on the control strain were first determined (3 technical replicates). Each point on the plot represents a technical replicate for EOP using those calculated averages as the denominator for each titer measurement on the defense host. Bars represent the mean of three replicates, and error bars denote the standard deviation. Hypothesis testing was performed pairwise with each knockout (KO) and WT. P-values (Welch’s t-test) and means are annotated above the bars. Complementation host contained the defense system and a plasmid expressing deleted gene. (C) Proposed model of defense and counter-defense for RADAR2. (D) EOPs for T7 knockouts with the Ec86 retron host. Plot was generated the same as B. (E) Proposed model of defense and counter-defense for Ec86 retron. (F) Growth curves for expression of g5.7 in cells containing no exogenous defense or the RADAR2 system. 1 x 10⁷ cells were either repressed with 0.2% glucose (uninduced) or induced with 0.1% L-arabinose and grown for ~14hrs. Central line represents the average of 3 replicates and the shaded flanking regions represent the standard deviation. (G) Growth curves for expression of g1.2 in cells containing no exogenous defense or the ApeA system. Experiment was performed and plot made the same way as F.CC BY-NC-ND · PubMed Central
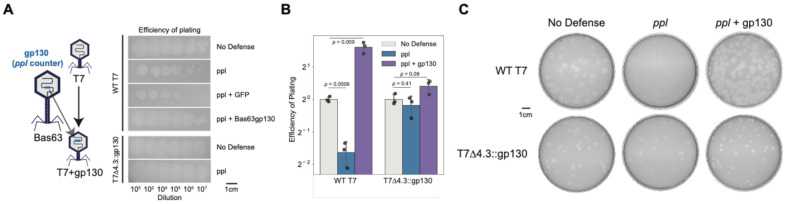
Figure 6. Transfer of gp130 from Bas63 to T7 improves infectivity on ppl. (A) Plaquing phenotypes of T7 phage with No-defense (empty vector), ppl, ppl + GFP, and ppl + Bas63gp130 hosts and of T7Δ4.3::gp130 on No-defense and ppl hosts. (B) Efficiency of plating (EOP) of T7 phage and T7Δ4.3::gp130 on No-defense, ppl, and ppl + Bas63gp130 hosts. For each phage, the No-defense is used as the reference for EOP calculations. Error bar represents standard deviation of three replicates. P-values are calculated using Welch’s t-test. (C) Plaque sizes of T7 phage and T7Δ4.3::gp130 on No-defense, ppl, and ppl + Bas63gp130 hosts. Images are representative of three replicates.
Figure 6. Transfer of gp130 from Bas63 to T7 improves infectivity on ppl. (A) Plaquing phenotypes of T7 phage with No-defense (empty vector), ppl, ppl + GFP, and ppl + Bas63gp130 hosts and of T7Δ4.3::gp130 on No-defense and ppl hosts. (B) Efficiency of plating (EOP) of T7 phage and T7Δ4.3::gp130 on No-defense, ppl, and ppl + Bas63gp130 hosts. For each phage, the No-defense is used as the reference for EOP calculations. Error bar represents standard deviation of three replicates. P-values are calculated using Welch’s t-test. (C) Plaque sizes of T7 phage and T7Δ4.3::gp130 on No-defense, ppl, and ppl + Bas63gp130 hosts. Images are representative of three replicates.CC BY-NC-ND · PubMed Central

Verification

Claims the paper makes

The claims and statistics of this paper haven’t been checked yet.

Run the check — free, no account needed. It reads the open-access text and checks the sources it cites.

A few free checks a day · papers already verified open instantly · results are public

Self-check

Percentages, sums and reported differences re-computed from the paper’s own numbers.

The self-check needs the paper’s full text.

Citations

Cites

Show all 141 references

Research works printed but not linked: 2

  1. Wang, 2023, Defense mechanism of a bacterial retron supramolecular assembly, bioRxiv
  2. Silas, 2023, Parallelized screening of virus accessory genes reveals diverse defense and counter-defense mechanisms, bioRxiv

Metadata

Authors
Chen, J., Nilsen, E. D., Chitboonthavisuk, C., Corban, J. E., Yang, M., Mo, C. Y., & Raman, S.
Affiliations
University of Wisconsin–Madison (US)
Corresponding author
Raman, Srivatsan
Venue
Cell Host & Microbe
Publisher
Elsevier BV
Published
2025-08
Volume
33
Issue
8
Pages
1363-1380.e11
ISSN
1931-3128 (ISSN-L)
OpenAlex
W4412570740
Cited by
16
References
141
Citations by year
2026: 9 · 2025: 6
FWCI
4.39
Type
journal article
Language
en
Open access
Locations
  • Cell Host & Microbe (acceptedVersion)
  • bioRxiv (Cold Spring Harbor Laboratory) (acceptedVersion, cc-by-nc-nd)
  • PubMed (publishedVersion)
  • PubMed Central (submittedVersion, cc-by-nc-nd)
  • PubMed Central (submittedVersion)
Funders
  • National Science Foundation (2237251)
  • National Institute of Allergy and Infectious Diseases Division of Microbiology and Infectious Diseases (R21AI156785)
  • National Institute of General Medical Sciences
  • National Institute of Allergy and Infectious Diseases
  • University of Wisconsin-Madison (SCR_017759)
  • National Institutes of Health (T32GM135066)
Topics
  • Life Sciences › Immunology and Microbiology › Virology › Bacteriophages and microbial interactions
  • Life Sciences › Biochemistry, Genetics and Molecular Biology › Genetics › Bacterial Genetics and Biotechnology
  • Life Sciences › Biochemistry, Genetics and Molecular Biology › Genetics › Evolution and Genetic Dynamics
Keywords
bacteriophage T7, bacteriophage T4, anti-phage defense systems, phage therapy

About these checks

Registry, retraction, Cites and statistics results are computed, not judged, with one exception: a printed reference that no index lists is read once by a model before it counts as a citation error. Claims are extracted by a model and kept only when their quote appears verbatim in the text; each cited source is then checked, with a model’s help, for whether it says what the claim relies on. Those verdicts can be wrong — read the claim’s quote and the cited source before relying on one.

Statistics and arithmetic are recomputed, not judged.

Confidence bands are shown only for fields calibrated on our annotated test set. None is calibrated yet, so no band is shown.

What counts as a claim ›How we measure confidence ›How we check this ›

Are you an author, or do you see a problem with this page? Request a review

How to cite

Cite CoChat for the checks on this page, and the paper for its own findings.

This page
CoChat. (2026). Citation check: Systematic, high-throughput characterization of bacteriophage gene essentiality on diverse hosts. https://app.cochat.ai/papers/10.1016/j.chom.2025.06.018
The paper
Chen, J., Nilsen, E. D., Chitboonthavisuk, C., Corban, J. E., Yang, M., Mo, C. Y., & Raman, S. (2025). Systematic, high-throughput characterization of bacteriophage gene essentiality on diverse hosts. Cell Host & Microbe. https://doi.org/10.1016/j.chom.2025.06.018

Data sources

Bibliographic data: Semantic Scholar, OpenAlex, Crossref.

Contains information from the Semantic Scholar Academic Graph Datasets, made available under the ODC Attribution License (ODC-BY 1.0).

Semantic Scholar’s data is described in: Kinney, R., et al. (2023). The Semantic Scholar Open Data Platform. arXiv:2301.10140.