

The DOI matches its Crossref record; 4 of the 4 references it cites were found in a registry or an index.
Application of Raman spectroscopy during pharmaceutical process development for determination of critical quality attributes in Protein A chromatography
Abstract
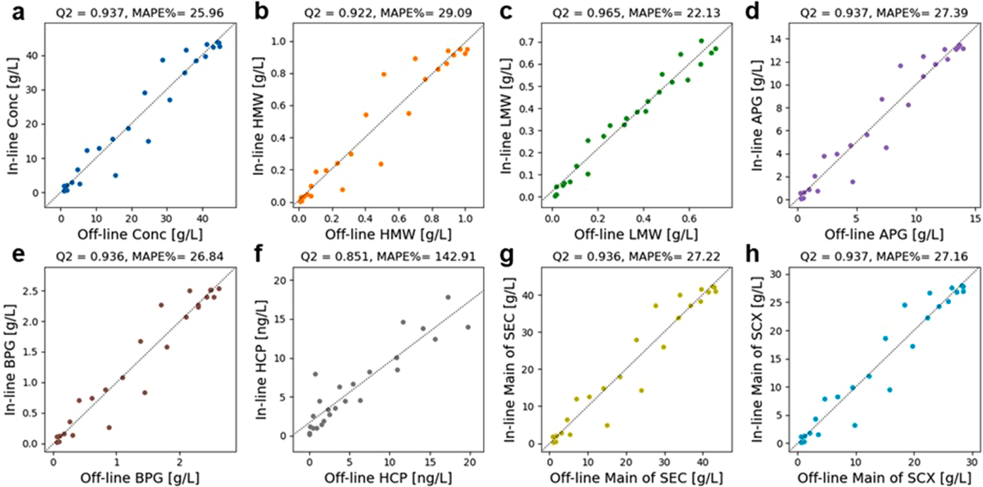
Raman spectroscopy is considered a Process Analytical Technology (PAT) tool in biopharmaceutical downstream processes. In the past decade, researchers have shown Raman spectroscopy's feasibility in determining Critical Quality Attributes (CQAs) in bioprocessing. This study verifies the feasibility of implementing a Raman-based PAT tool in Protein A chromatography as a CQA monitoring technique, for the purpose of accelerating process development and achieving real-time release in manufacturing. A system connecting Raman to a Tecan liquid handling station enables high-throughput model calibration. One calibration experiment collects Raman spectra of 183 samples with 8 CQAs within 25 hours. After applying Butterworth high-pass filters and k-nearest neighbor (KNN) regression for model training, the model showed high predictive accuracy for fragments (Q2 = 0.965) and strong predictability for target protein concentration, aggregates, as well as charge variants (Q2 ≥ 0.922). The model's robustness was confirmed by varying the elution pH, load density, and residence time using 19 external validation preparative Protein A chromatography runs. The model can deliver elution profiles of multiple CQAs within a set point ± 0.3 pH range. The CQA readouts were presented as continuous chromatograms with a resolution of every 28 seconds for enhanced process understanding. In external validation datasets, the model maintained strong predictability especially for target protein concentration (Q2 = 0.956) and basic charge variants (Q2 = 0.943), except for overpredicted HCP (Q2 = 0.539). This study demonstrates a rapid, effective method for implementing Raman spectroscopy for in-line CQA monitoring in process development and biomanufacturing, eliminating the need for labor-intensive sample pooling and handling.
Overview
The claims and statistics of this paper haven’t been checked yet.
Free: it reads the open-access text and checks the first 5 claims that cite a source we can check. Create a free account to check every claim.
Integrity signals
Registry
Cites
Statistics
Figures




Verification
Claims the paper makes
The claims and statistics of this paper haven’t been checked yet.
Free: it reads the open-access text and checks the first 5 claims that cite a source we can check. Create a free account to check every claim.
Claims other papers make about this one
Each is checked against this paper’s own text: does it say what the citing paper says it does?
In the citing paper
“Chen et al. employed Raman spectroscopy for in‐line CQA monitoring of IgG1 monoclonal antibody (mAb) during the Protein A chromatography process, where they developed a predictive model showing high predictive accuracy for various CQAs including target protein concentration and aggregates [38].”
From Current PAT Landscape in the Downstream Processing of Biopharmaceuticals (2025) · cites this paper as [38]
Self-check
Percentages, sums and reported differences re-computed from the paper’s own numbers.
The self-check needs the paper’s full text.
Citations
Cites
Rolinger, L., Rüdt, M., & Hubbuch, J. (2020) · Analytical and Bioanalytical Chemistry · doi:10.1007/s00216-020-02407-z · Cited by 126
Feidl, F., Garbellini, S., Vogg, S., Sokolov, M., Souquet, J., Broly, H., Butté, A., & Morbidelli, M. (2019) · Biotechnology Progress · doi:10.1002/btpr.2847 · Cited by 59
Patel, B. A., Gospodarek, A., Larkin, M., Kenrick, S. A., Haverick, M. A., Tugcu, N., Brower, M. A., & Richardson, D. D. (2018) · mAbs · doi:10.1080/19420862.2018.1505178 · Cited by 52
Real‐Time Detection of mAb Aggregates in an Integrated Downstream Process
São Pedro, M. N., Isaksson, M., Gomis‐Fons, J., Eppink, M. H. M., Nilsson, B., & Ottens, M. (2023) · Biotechnology and Bioengineering · doi:10.1002/bit.28466 · Cited by 16
Research works printed but not linked: 20
- Paul, 2010, How to improve R&D productivity: the pharmaceutical industry's grand challenge, Nat. Rev. Drug Discov., 9, 203, 10.1038/nrd3078 · DOI · Paper page
- Fisher, 2019, The current scientific and regulatory landscape in advancing integrated continuous biopharmaceutical manufacturing, Trends Biotechnol., 37, 253, 10.1016/j.tibtech.2018.08.008 · DOI · Paper page
- Gottschalk, 2012, The need for innovation in biomanufacturing, Nat. Biotechnol., 30, 489, 10.1038/nbt.2263 · DOI
- Müller, 2022, Process intensification in the biopharma industry: improving efficiency of protein manufacturing processes from development to production scale using synergistic approaches, Chem. Eng. Process. - Process Intensif., 171, 10.1016/j.cep.2021.108727 · DOI
- Yilmaz, 2020, Application of Raman spectroscopy in monoclonal antibody producing continuous systems for downstream process intensification, Biotechnol. Prog., 36, e2947, 10.1002/btpr.2947 · DOI · Paper page
- Saleh, 2020, Straightforward method for calibration of mechanistic cation exchange chromatography models for industrial applications, Biotechnol. Prog, 36, e2984, 10.1002/btpr.2984 · DOI
- Pedro, 2022, Process analytical technique (PAT) miniaturization for monoclonal antibody aggregate detection in continuous downstream processing, J. Chem. Technol. Biotechnol., 97, 2347, 10.1002/jctb.6920 · DOI
- Rathore, 2009, Quality by design for biopharmaceuticals, Nat. Biotechnol., 27, 26, 10.1038/nbt0109-26 · DOI · Paper page
- Rolinger, 2021, Comparison of UV- and Raman-based monitoring of the Protein A load phase and evaluation of data fusion by PLS models and CNNs, Biotechnol. Bioeng., 118, 4255, 10.1002/bit.27894 · DOI · Paper page
- Akhgar, 2022, QCL–IR spectroscopy for in-line monitoring of proteins from preparative ion-exchange chromatography, Anal. Chem., 94, 5583, 10.1021/acs.analchem.1c05191 · DOI
- Taraban, 2019, Flow water proton NMR: in-line process analytical technology for continuous biomanufacturing, Anal. Chem., 91, 13538, 10.1021/acs.analchem.9b02622 · DOI
- Zhang, 2019, Rapid, quantitative determination of aggregation and particle formation for antibody drug conjugate therapeutics with label-free Raman spectroscopy, Anal. Chim. Acta, 1081, 138, 10.1016/j.aca.2019.07.007 · DOI
- Wei, 2022, Multi-attribute Raman spectroscopy (MARS) for monitoring product quality attributes in formulated monoclonal antibody therapeutics, mAbs, 14, 10.1080/19420862.2021.2007564 · DOI
- Wang, 2023, Automated calibration and in-line measurement of product quality during therapeutic monoclonal antibody purification using Raman spectroscopy, Biotechnol. Bioeng., 10.1002/bit.28514 · DOI
- Wang, 2023, In-line product quality monitoring during biopharmaceutical manufacturing using computational Raman spectroscopy, mAbs, 15, 10.1080/19420862.2023.2220149 · DOI · Paper page
- Williams, 2023, Machine learning and metabolic modelling assisted implementation of a novel process analytical technology in cell and gene therapy manufacturing, Sci. Rep., 13, 834, 10.1038/s41598-023-27998-2 · DOI
- Rolinger, 2023, Monitoring of ultra- and diafiltration processes by Kalman-filtered Raman measurements, Anal. Bioanal. Chem., 415, 841, 10.1007/s00216-022-04477-7 · DOI
- Kueltzo, 2008, Effects of solution conditions, processing parameters, and container materials on aggregation of a monoclonal antibody during freeze-thawing, J. Pharm. Sci., 97, 1801, 10.1002/jps.21110 · DOI · Paper page
- Vlasak, 2011, Fragmentation of monoclonal antibodies, mAbs, 3, 253, 10.4161/mabs.3.3.15608 · DOI · Paper page
- Dada, 2017, Comparison of SEC and CE-SDS methods for monitoring hinge fragmentation in IgG1 monoclonal antibodies, J. Pharm. Biomed. Anal., 145, 91, 10.1016/j.jpba.2017.06.006 · DOI
Cited by
Current PAT Landscape in the Downstream Processing of Biopharmaceuticals
Sathiyapriyan, P., Mukherjee, S., Vogel, T., Essen, L., Boerema, D., Vey, M., & Kalina, U. (2025) · Analytical Science Advances · doi:10.1002/ansa.70013 · Cited by 45
Metadata
- Authors
- Chen, J., Wang, J., Hess, R., Wang, G., Studts, J., & Franzreb, M.
- ORCID
- Hess, Rudger
- Venue
- Journal of Chromatography A
- Publisher
- Elsevier BV
- Published
- 2024-03
- Volume
- 1718
- Pages
- 464721
- ISSN
- 0021-9673
- Cited by
- 21
- References
- 4
- Language
- en
- Licence
- www.elsevier.com/tdm/userlicense/1.0/ (tdm)
- www.elsevier.com/legal/tdmrep-license (tdm)
- creativecommons.org/licenses/by-nc-nd/4.0/ (vor)
About these checks
Registry, retraction, Cites and statistics results are computed, not judged, with one exception: a printed reference that no index lists is read once by a model before it counts as a citation error. Claims are extracted by a model and kept only when their quote appears verbatim in the text; each cited source is then checked, with a model’s help, for whether it says what the claim relies on. Those verdicts can be wrong — read the claim’s quote and the cited source before relying on one.
Statistics and arithmetic are recomputed, not judged.
Confidence bands are shown only for fields calibrated on our annotated test set. None is calibrated yet, so no band is shown.
What counts as a claim ›How we measure confidence ›How we check this ›
Are you an author, or do you see a problem with this page? Request a review
How to cite
Cite CoChat for the checks on this page, and the paper for its own findings.
- This page
- CoChat. (2026). Citation check: Application of Raman spectroscopy during pharmaceutical process development for determination of critical quality attributes in Protein A chromatography. https://app.cochat.ai/papers/10.1016/j.chroma.2024.464721
- The paper
- Chen, J., Wang, J., Hess, R., Wang, G., Studts, J., & Franzreb, M. (2024). Application of Raman spectroscopy during pharmaceutical process development for determination of critical quality attributes in Protein A chromatography. Journal of Chromatography A. https://doi.org/10.1016/j.chroma.2024.464721
Data sources
Bibliographic data: Semantic Scholar, OpenAlex, Crossref.
Contains information from the Semantic Scholar Academic Graph Datasets, made available under the ODC Attribution License (ODC-BY 1.0).
Semantic Scholar’s data is described in: Kinney, R., et al. (2023). The Semantic Scholar Open Data Platform. arXiv:2301.10140.
