

The DOI matches its Crossref record; 55 of the 55 references it cites were found in a registry or an index.
Longitudinal MRI-based fusion novel model predicts pathological complete response in breast cancer treated with neoadjuvant chemotherapy: a multicenter, retrospective study
Open accessAbstract
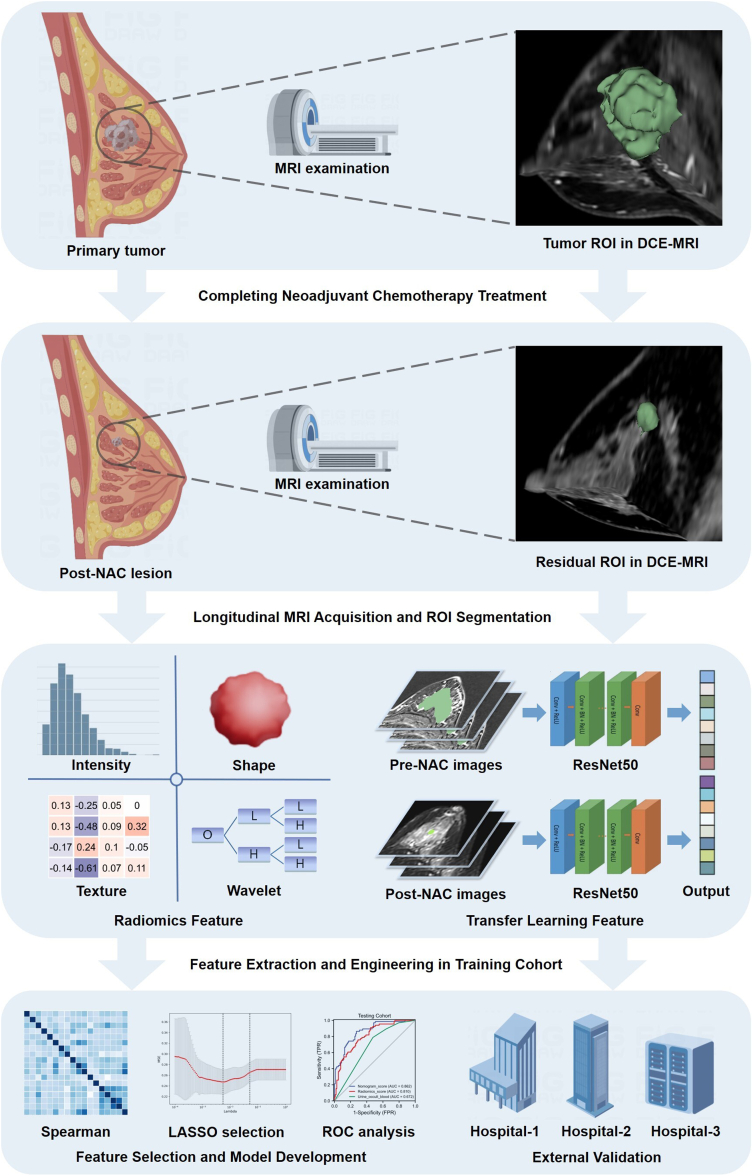
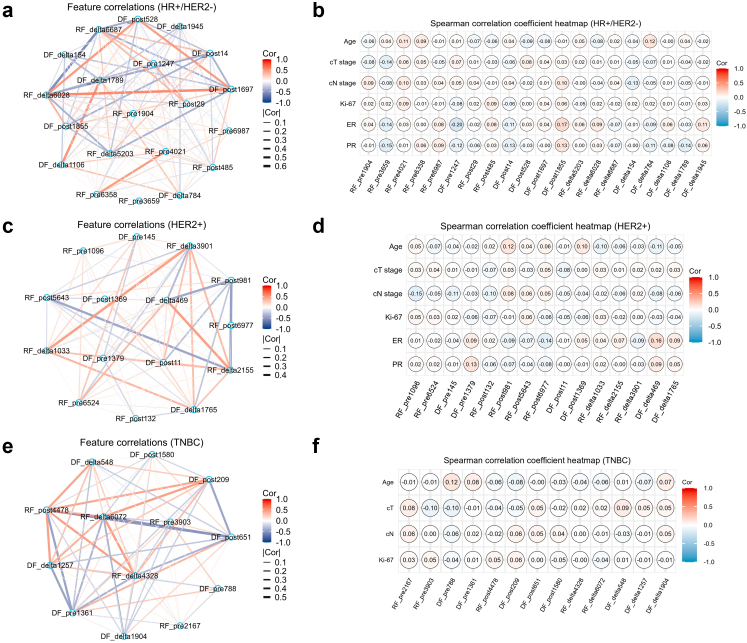
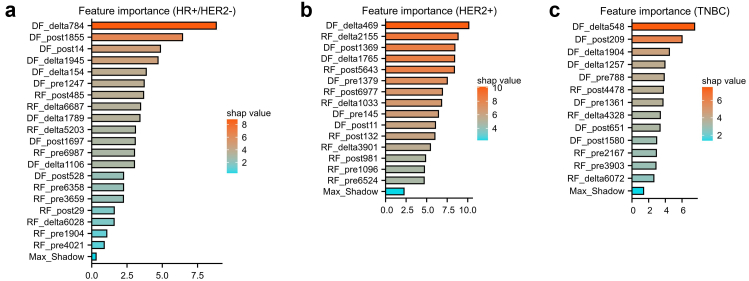
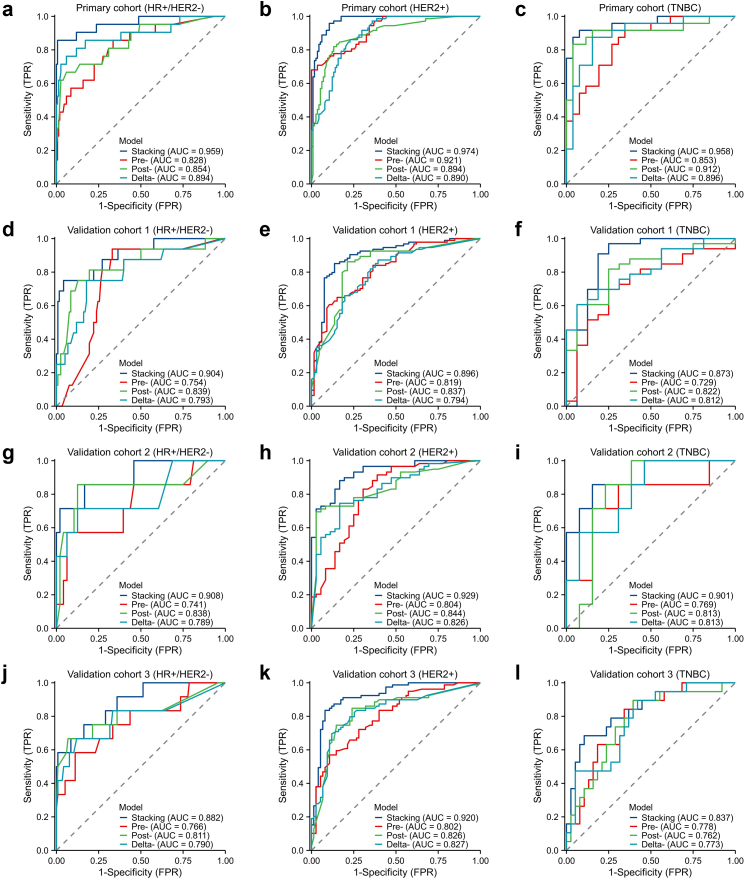
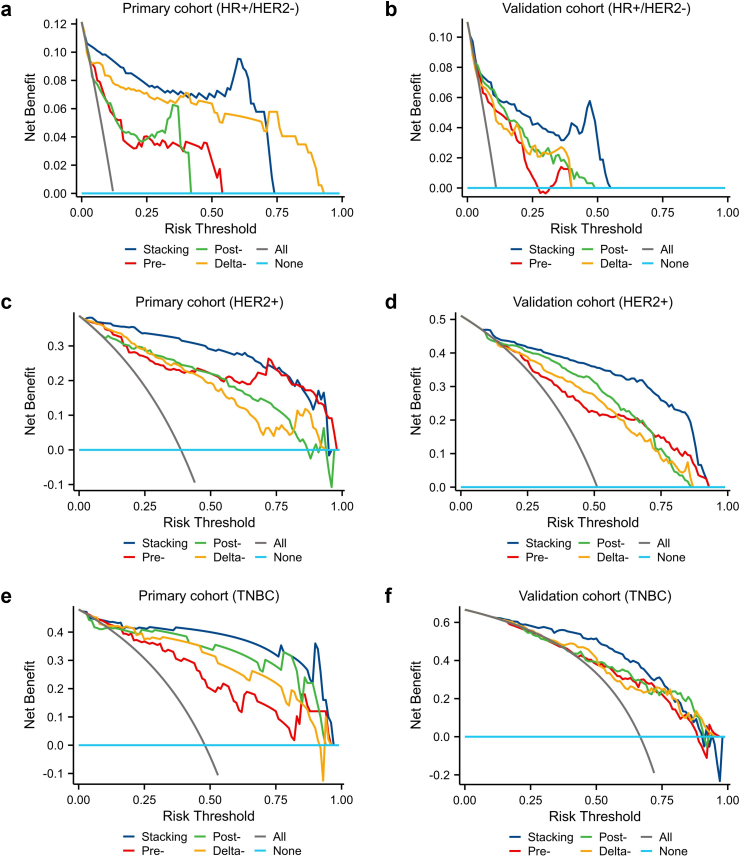
Background: Accurate identification of pCR to neoadjuvant chemotherapy (NAC) is essential for determining appropriate surgery strategy and guiding resection extent in breast cancer. However, a non-invasive tool to predict pCR accurately is lacking. Our study aims to develop ensemble learning models using longitudinal multiparametric MRI to predict pCR in breast cancer. Methods: From July 2015 to December 2021, we collected pre-NAC and post-NAC multiparametric MRI sequences per patient. We then extracted 14,676 radiomics and 4096 deep learning features and calculated additional delta-value features. In the primary cohort (n = 409), the inter-class correlation coefficient test, U-test, Boruta and the least absolute shrinkage and selection operator regression were used to select the most significant features for each subtype of breast cancer. Five machine learning classifiers were then developed to predict pCR accurately for each subtype. The ensemble learning strategy was used to integrate the single-modality models. The diagnostic performances of models were evaluated in the three external cohorts (n = 343, 170 and 340, respectively). Findings: A total of 1262 patients with breast cancer from four centers were enrolled in this study, and pCR rates were 10.6% (52/491), 54.3% (323/595) and 37.5% (66/176) in HR+/HER2-, HER2+ and TNBC subtype, respectively. Finally, 20, 15 and 13 features were selected to construct the machine learning models in HR+/HER2-, HER2+ and TNBC subtypes, respectively. The multi-Layer Perception (MLP) yields the best diagnostic performances in all subtypes. For the three subtypes, the stacking model integrating pre-, post- and delta-models yielded the highest AUCs of 0.959, 0.974 and 0.958 in the primary cohort, and AUCs of 0.882-0.908, 0.896-0.929 and 0.837-0.901 in the external validation cohorts, respectively. The stacking model had accuracies of 85.0%-88.9%, sensitivities of 80.0%-86.3%, and specificities of 87.4%-91.5% in the external validation cohorts. Interpretation: Our study established a novel tool to predict the responses of breast cancer to NAC and achieve excellent performance. The models could help to determine post-NAC surgery strategy for breast cancer. Funding: This study is supported by grants from the National Natural Science Foundation of China (82171898, 82103093), the Deng Feng project of high-level hospital construction (DFJHBF202109), the Guangdong Basic and Applied Basic Research Foundation (grant number, 2020A1515010346, 2022A1515012277), the Science and Technology Planning Project of Guangzhou City (202002030236), the Beijing Medical Award Foundation (YXJL-2020-0941-0758), and the Beijing Science and Technology Innovation Medical Development Foundation (KC2022-ZZ-0091-5). Funding sources were not involved in the study design, data collection, analysis and interpretation, writing of the report, or decision to submit the article for publication.
Overview
The claims and statistics of this paper haven’t been checked yet.
Run the check — free, no account needed. It reads the open-access text and checks the sources it cites.
Integrity signals
Registry
Cites
Statistics
Figures
Verification
Claims the paper makes
The claims and statistics of this paper haven’t been checked yet.
Run the check — free, no account needed. It reads the open-access text and checks the sources it cites.
Claims other papers make about this one
Each is checked against this paper’s own text: does it say what the citing paper says it does?
The source backs part of the claim, not all of it — or backs it for a different population, condition or comparison.
In the citing paper
“Researchers found that predicting NAC response in patients with locally advanced breast cancer based on a deep learning algorithm is feasible (13).”
From A multimodal and fully automated system for prediction of pathological complete response to neoadjuvant chemotherapy in breast cancer (2025) · cites this paper as [13]
Experimental — accuracy not yet measuredThe cited source says what the claim attributes to it.
In the citing paper
“Many researchers found that deep learning can improve the prediction ability of NAC response prediction in breast cancer (13, 22).”
From A multimodal and fully automated system for prediction of pathological complete response to neoadjuvant chemotherapy in breast cancer (2025) · cites this paper as [13]
The cited source says what the claim attributes to it.
In the citing paper
“the model was developed based on single-center data.”
From A multimodal and fully automated system for prediction of pathological complete response to neoadjuvant chemotherapy in breast cancer (2025) · cites this paper as [13]
Self-check
Percentages, sums and reported differences re-computed from the paper’s own numbers.
The self-check needs the paper’s full text.
Citations
Cites
DeLong, E. R., DeLong, D. M., & Clarke-Pearson, D. L. (1988) · Biometrics · doi:10.2307/2531595 · Cited by 22,649
3D Slicer as an image computing platform for the Quantitative Imaging Network
Fedorov, A., Beichel, R., Kalpathy–Cramer, J., Finet, J., Fillion‐Robin, J., Pujol, S., Bauer, C., Jennings, D. L., Fennessy, F., Milan Sonka, A., et al. (2012) · Magnetic Resonance Imaging · doi:10.1016/j.mri.2012.05.001 · Cited by 9,095
Computational Radiomics System to Decode the Radiographic Phenotype
(2017) · doi:10.1158/0008-5472.can-17-0339 · Cited by 6,593
Radiomics: extracting more information from medical images using advanced feature analysis
Lambin, P., Rios-Velazquez, E., Leijenaar, R., Carvalho, S., van Stiphout, R. G. P. M., Granton, P., Zegers, C. M. L., Gillies, R., Boellard, R., Dekker, A., et al. (2012) · European Journal of Cancer · doi:10.1016/j.ejca.2011.11.036 · Cited by 6,084
Cortazar, P., Zhang, L., Untch, M., Mehta, K. M., Costantino, J. P., Wolmark, N., Bonnefoi, H. R., Cameron, D., Gianni, L., Valagussa, P., et al. (2014) · The Lancet · doi:10.1016/s0140-6736(13)62422-8 · Cited by 4,777
Self-citationHammond, M. E., Hayes, D. F., Dowsett, M., Allred, D. C., Hagerty, K. L., Badve, S., Fitzgibbons, P. L., Francis, G. D., Goldstein, N. S., Hayes, M. M., et al. (2010) · Journal of Clinical Oncology · doi:10.1200/jco.2009.25.6529 · Cited by 4,217
Zwanenburg, A., Vallières, M., Abdalah, M. A., Aerts, H. J. W. L., Andrearczyk, V., Apte, A., Ashrafinia, S., Bakas, S., Beukinga, R. J., Boellaard, R., et al. (2020) · Radiology · doi:10.1148/radiol.2020191145 · Cited by 4,177
Wolff, A. C., Hammond, M. E. H., Hicks, D. G., Dowsett, M., McShane, L. M., Allison, K. H., Allred, D. C., Bartlett, J. M. S., Bilous, M., Fitzgibbons, P. L., et al. (2013) · Journal of Clinical Oncology · doi:10.1200/jco.2013.50.9984 · Cited by 4,080
von Minckwitz, G., Untch, M., Blohmer, J.-U., Costa, S. D., Eidtmann, H., Fasching, P. A., Gerber, B., Eiermann, W., Hilfrich, J., Huober, J., et al. (2012) · Journal of Clinical Oncology · doi:10.1200/jco.2011.38.8595 · Cited by 2,659
RECIST 1.1—Update and clarification: From the RECIST committee
Schwartz, L. H., Litière, S., de Vries, E., Ford, R., Gwyther, S., Mandrekar, S., Shankar, L., Bogaerts, J., Chen, A., Dancey, J., et al. (2016) · European Journal of Cancer · doi:10.1016/j.ejca.2016.03.081 · Cited by 1,906
Curigliano, G., Burstein, H. J., Winer, E. P., Gnant, M., Dubsky, P. C., Loibl, S., Colleoni, M. A., Regan, M. M., Piccart, M. J., Senn, H.-J., et al. (2017) · Annals of Oncology · doi:10.1093/annonc/mdx308 · Cited by 1,233
Applications and limitations of radiomics
Yip, S. S. F., & Aerts, H. J. W. L. (2016) · Physics in Medicine and Biology · doi:10.1088/0031-9155/61/13/r150 · Cited by 1,210
Bear, H. D., Anderson, S., Smith, R. E., Geyer, C. E., Mamounas, E. P., Fisher, B., Brown, A. M., Robidoux, A., Margolese, R. G., Kahlenberg, M. S., et al. (2006) · Journal of Clinical Oncology · doi:10.1200/jco.2005.04.1665 · Cited by 943
Hylton, N. M., Blume, J. D., Bernreuter, W. K., Pisano, E. D., Rosen, M. A., Morris, E. A., Weatherall, P. T., Lehman, C. D., Newstead, G. M., Polin, S. M., et al. (2012) · Radiology · doi:10.1148/radiol.12110748 · Cited by 499
Liu, Z., Li, Z., Qu, J., Zhang, R., Zhou, X., Li, L., Sun, K., Tang, Z., Jiang, H., Li, H., et al. (2019) · Clinical Cancer Research · doi:10.1158/1078-0432.ccr-18-3190 · Cited by 494
Self-citationBoughey, J. C., Ballman, K. V., Le‐Petross, H. T., McCall, L. M., Mittendorf, E. A., Ahrendt, G. M., Wilke, L. G., Taback, B., Feliberti, E., & Hunt, K. K. (2015) · Annals of Surgery · doi:10.1097/sla.0000000000001375 · Cited by 459
Wolf, D. M., Yau, C. S. F., Wulfkuhle, J. D., Swigart, L. B., Gallagher, R. I., Lee, P. R. E., Zhu, Z., Magbanua, M. J. M., Sayaman, R. W., O’Grady, N., et al. (2022) · Cancer Cell · doi:10.1016/j.ccell.2022.05.005 · Cited by 355
Loo, C. E., Straver, M. E., Rodenhuis, S., Muller, S. H., Wesseling, J., Peeters, M.-J. T. F. D. V., & Gilhuijs, K. G. A. (2011) · Journal of Clinical Oncology · doi:10.1200/jco.2010.31.1258 · Cited by 303
Partridge, S. C., Zhang, Z., Newitt, D. C., Gibbs, J., Chenevert, T. L., Rosen, M. A., Bolan, P. J., Marques, H. S., Romanoff, J., Cimino, L., et al. (2018) · Radiology · doi:10.1148/radiol.2018180273 · Cited by 287
Park, S. H., Moon, W. K., Cho, N., Song, I. C., Chang, J. M., Park, I.-A., Han, W., & Noh, D. (2010) · Radiology · doi:10.1148/radiol.10092021 · Cited by 280
Axillary Nodal Management Following Neoadjuvant Chemotherapy
Pilewskie, M. L., & Morrow, M. (2016) · JAMA Oncology · doi:10.1001/jamaoncol.2016.4163 · Cited by 263
Lobbes, M. B. I., Prevos, R., Smidt, M., Tjan-Heijnen, V. C. G., van Goethem, M., Schipper, R., Beets-Tan, R. G., & Wildberger, J. E. (2013) · Insights into Imaging · doi:10.1007/s13244-013-0219-y · Cited by 237
Fayanju, O. M., Ren, Y., Thomas, S. M., Greenup, R. A., Plichta, J. K., Rosenberger, L. H., Tamirisa, N., Force, J. M., Boughey, J. C., Hyslop, T., et al. (2018) · Annals of Surgery · doi:10.1097/sla.0000000000002953 · Cited by 204
Goetz, M. P., Gradishar, W. J., Anderson, B. O., Abraham, J., Aft, R., Allison, K. H., Blair, S. L., Burstein, H. J., Dang, C. T., ELIAS, A. D., et al. (2019) · Journal of the National Comprehensive Cancer Network · doi:10.6004/jnccn.2019.0009 · Cited by 198
Kuerer, H. M., Smith, B. D., Krishnamurthy, S., Yang, W. T., Valero, V., Shen, Y., Lin, H. Y., Lucci, A., Boughey, J. C., White, R. L., et al. (2022) · The Lancet Oncology · doi:10.1016/s1470-2045(22)00613-1 · Cited by 169
Yuan, Y., Chen, X., Liu, S., & Shen, K. (2010) · American Journal of Roentgenology · doi:10.2214/ajr.09.3908 · Cited by 151
Antunovic, L., Sanctis, R. D., Cozzi, L., Kirienko, M., Sagona, A., Torrisi, R., Tinterri, C., Santoro, A., Chiti, A., Zelić, R., et al. (2019) · European Journal of Nuclear Medicine and Molecular Imaging · doi:10.1007/s00259-019-04313-8 · Cited by 145
Joo, S., Ko, E. S., Kwon, S., Jeon, E., Jung, H., Kim, J.-Y., Chung, M. J., & Im, Y.-H. (2021) · Scientific Reports · doi:10.1038/s41598-021-98408-8 · Cited by 137
Goorts, B., van Nijnatten, T. J. A., de Munck, L., Moossdorff, M., Heuts, E. M., de Boer, M., Lobbes, M. B. I., & Smidt, M. L. (2017) · Breast Cancer Research and Treatment · doi:10.1007/s10549-017-4155-2 · Cited by 134
Role of Imaging in Neoadjuvant Therapy for Breast Cancer
Dialani, V. M., Chadashvili, T., & Slanetz, P. J. (2015) · Annals of Surgical Oncology · doi:10.1245/s10434-015-4403-9 · Cited by 133
Gu, Y.-L., Pan, S.-M., Ren, J., Yang, Z.-X., & Jiang, G.-Q. (2017) · Clinical Breast Cancer · doi:10.1016/j.clbc.2016.12.010 · Cited by 128
Three-dimensional Printing and 3D Slicer
Cheng, G. Z., Estépar, R. S. J., Folch, E. E., Onieva, J. O., Gangadharan, S. P., & Majid, A. (2016) · CHEST Journal · doi:10.1016/j.chest.2016.03.001 · Cited by 123
Li, P., Wang, X., Xu, C., Liu, C., Zheng, C., FULHAM, M. J., Feng, D. D., Wang, L., Song, S., & Huang, G. (2020) · European Journal of Nuclear Medicine and Molecular Imaging · doi:10.1007/s00259-020-04684-3 · Cited by 108
Weber, J. J., Jochelson, M. S., Eaton, A. A., Zabor, E. C., Barrio, A. V., Gemignani, M. L., Pilewskie, M. L., Zee, K. J. V., Morrow, M., & El-Tamer, M. B. (2017) · Journal of the American College of Surgeons · doi:10.1016/j.jamcollsurg.2017.08.027 · Cited by 105
Goorts, B., Dreuning, K. M. A., Houwers, J. B., Kooreman, L. F. S., Boerma, E.-J. G., Mann, R. M., Lobbes, M. B. I., & Smidt, M. L. (2018) · Breast Cancer Research · doi:10.1186/s13058-018-0950-x · Cited by 83
The Evolving Role of Neoadjuvant Therapy for Operable Breast Cancer
Spring, L. M., Bar, Y., & Isakoff, S. J. (2022) · Journal of the National Comprehensive Cancer Network · doi:10.6004/jnccn.2022.7016 · Cited by 83
Kantor, O., Sipsy, L. M., Yao, K. A., & James, T. A. (2018) · Annals of Surgical Oncology · doi:10.1245/s10434-018-6345-5 · Cited by 80
Wu, C., Jarrett, A. M., Zhou, Z., Elshafeey, N. A., Adrada, B. E., Candelaria, R. P., Mohamed, R. M. M., Böge, M., Huo, L., White, J. B., et al. (2022) · Cancer Research · doi:10.1158/0008-5472.can-22-1329 · Cited by 79
Curigliano, G., Burstein, H. J., Winer, E. P., Gnant, M., Dubsky, P., Loibl, S., Colleoni, M. A., Regan, M. M., Piccart, M. J., Senn, H.-J., et al. (2019) · Annals of Oncology · doi:10.1093/annonc/mdy537 · Cited by 75
You, S., Kang, D. K., Jung, Y. S., An, Y., Jeon, G. S., & Kim, T. H. (2015) · British Journal of Radiology · doi:10.1259/bjr.20150143 · Cited by 74
Han, S., & Choi, J. Y. (2020) · Breast Cancer Research · doi:10.1186/s13058-020-01350-2 · Cited by 73
de Nonneville, A. T., Houvenaeghel, G. F., Cohen, M., Sabiani, L., Bannier, M., Viret, F., Gonçalvès, A., & Bertucci, F. (2022) · European Journal of Cancer · doi:10.1016/j.ejca.2022.09.017 · Cited by 72
Liu, Y., Wang, Y., Wang, Y., Xie, Y. S., Cui, Y., Feng, S., Yao, M., Qiu, B., Shen, W., Chen, D., et al. (2022) · EClinicalMedicine · doi:10.1016/j.eclinm.2022.101562 · Cited by 71
Chen, J., Bahri, S., Mehta, R. S., Carpenter, P. M., McLaren, C. E., Chen, W., Fwu, P. T., Hsiang, D. J. B., Lane, K. T., Butler, J., et al. (2013) · Journal of Surgical Oncology · doi:10.1002/jso.23470 · Cited by 63
Khan, N., Adam, R., Huang, P., Maldjian, T., & Duong, T. Q. (2022) · Tomography · doi:10.3390/tomography8060232 · Cited by 55
Peng, Y., Cheng, Z., Gong, C., Zheng, C., Zhang, X., Wu, Z., Yang, Y., Yang, X., Zheng, J., & Shen, J. (2022) · Frontiers in Oncology · doi:10.3389/fonc.2022.846775 · Cited by 52
Self-citationLi, Y., Fan, Y., Xu, D., Li, Y., Zhong, Z., Pan, H., Huang, B., Xie, X., Yang, Y., & Liu, B. (2023) · Frontiers in Oncology · doi:10.3389/fonc.2022.1041142 · Cited by 48
Skarping, I., Larsson, M., & Förnvik, D. (2022) · European Radiology · doi:10.1007/s00330-021-08306-w · Cited by 44
Yam, C., Abuhadra, N. K., Sun, R., Adrada, B. E., Ding, Q., White, J. B., Ravenberg, E. E., Clayborn, A. R., Valero, V., Tripathy, D., et al. (2022) · Clinical Cancer Research · doi:10.1158/1078-0432.ccr-21-3100 · Cited by 44
Matikas, A., Johansson, H., Grybäck, P., Bjöhle, J., Ács, B., Boyacı, C., Lekberg, T., Fredholm, H., Elinder, E., Margolin, S., et al. (2022) · Clinical Cancer Research · doi:10.1158/1078-0432.ccr-22-2829 · Cited by 42
Zhuang, X., Chen, C., Liu, Z., Zhang, L., Zhou, X., Cheng, M., Ji, F., Zhu, T., Lei, C., Zhang, J., et al. (2020) · Translational Oncology · doi:10.1016/j.tranon.2020.100831 · Cited by 40
Self-citationMurphy, B. L., Hoskin, T. L., Day, C. N., Habermann, E. B., & Boughey, J. C. (2017) · Annals of Surgical Oncology · doi:10.1245/s10434-017-5872-9 · Cited by 30
Liu, S., Du, S., Si, G., Teng, Y., Jin, F., & Zhang, L. (2023) · BMC Cancer · doi:10.1186/s12885-022-10496-5 · Cited by 26
Self-citationZeng, Q., Ke, M., Zhong, L., Zhou, Y., Zhu, X., He, C., & Liu, L. (2022) · Academic Radiology · doi:10.1016/j.acra.2022.11.006 · Cited by 21
SafePredict: A Meta-Algorithm for Machine Learning That Uses Refusals to Guarantee Correctness
Kocak, M., Ramirez, D., Erkip, E., & Shasha, D. E. (2019) · IEEE Transactions on Pattern Analysis and Machine Intelligence · doi:10.1109/tpami.2019.2932415 · Cited by 11
Cited by
Sorted by citations
Radiomics in breast cancer: Current advances and future directions
Qi, Y.-J., Su, G.-H., You, C., Zhang, X., Xiao, Y., Jiang, Y.-Z., & Shao, Z. (2024) · Cell Reports Medicine · doi:10.1016/j.xcrm.2024.101719 · Cited by 203
Self-citationGao, Y., Ventura‐Díaz, S., Wang, X., He, M., Xu, Z., Weir, A., Zhou, H.-Y., Zhang, T., van Duijnhoven, F. H., Han, L., et al. (2024) · Nature Communications · doi:10.1038/s41467-024-53450-8 · Cited by 93
Huang, Y., Wang, X., Cao, Y. J., Lan, X., Hu, X., Mou, F., Chen, H., Gong, X., Li, L., Tang, S., et al. (2025) · Radiology · doi:10.1148/radiol.241805 · Cited by 56
Self-citationHuang, Y., Shi, Z., Zhu, T., Zhou, T., Li, Y., Li, W., Qiu, H., Wang, S., He, L., Wu, Z., et al. (2025) · Advanced Science · doi:10.1002/advs.202413702 · Cited by 50
Self-citationMao, N., Dai, Y., Zhou, H., Lin, F., Zheng, T., Li, Z., Yang, P., Zhao, F., Li, Q., Wang, W., et al. (2025) · Science Advances · doi:10.1126/sciadv.adr1576 · Cited by 51
“Many researchers found that deep learning can improve the prediction ability of NAC response prediction in breast cancer ( 13 , 22 ).”
Self-citation
Metadata
- Authors
- Huang, Y., Zhu, T., Zhang, X., Li, W., Zheng, X., Cheng, M., Ji, F., Zhang, L., Yang, C., Wu, Z., Ye, G., Lin, Y., & Wang, K.
- Affiliations
- Guangdong Academy of Medical Sciences (CN)
- Sun Yat-sen University (CN)
- First People's Hospital of Foshan (CN)
- Corresponding author
- Ye, GuoLin
- Lin, Ying
- Wang, Kun
- Venue
- eClinicalMedicine
- Publisher
- Elsevier BV
- Published
- 2023-04
- Volume
- 58
- Pages
- 101899
- ISSN
- 2589-5370 (ISSN-L)
- PMC
- PMC10050775
- OpenAlex
- W4360796946
- Cited by
- 175
- References
- 55
- Citations by year
- 2026: 49 · 2025: 67 · 2024: 46 · 2023: 13
- FWCI
- 28.98
- Type
- journal article
- Language
- en
- Open access
- gold
- doi.org
- Licence
- Locations
- EClinicalMedicine (publishedVersion, cc-by-nc-nd)
- PubMed Central (publishedVersion, cc-by-nc-nd)
- PubMed (publishedVersion)
- DOAJ (DOAJ: Directory of Open Access Journals) (submittedVersion, cc-by-sa)
- Funders
- High-level Hospital Construction Project of Guangdong Provincial People's Hospital (DFJHBF202109)
- Basic and Applied Basic Research Foundation of Guangdong Province (2020A1515010346, 2021A1515011570, 2022A1515012277)
- Scientific and Technological Planning Project of Guangzhou City
- National Natural Science Foundation of China (82103093)
- Guangzhou Municipal Science and Technology Project (202002030236, 202102021055)
- Foundation for Innovative Research Groups of the National Natural Science Foundation of China (82171898)
- Topics
- Health Sciences › Medicine › Radiology, Nuclear Medicine and Imaging › Radiomics and Machine Learning in Medical Imaging
- Health Sciences › Medicine › Radiology, Nuclear Medicine and Imaging › MRI in cancer diagnosis
- Life Sciences › Biochemistry, Genetics and Molecular Biology › Cancer Research › Breast Cancer Treatment Studies
- Keywords
- breast cancer, pathological complete response, neoadjuvant chemotherapy, multiparametric MRI, longitudinal MRI, radiomics, deep features, ensemble learning, stacking ensemble, breast cancer subtypes, triple-negative breast cancer, HER2-positive breast cancer, hormone receptor-positive HER2-negative breast cancer, treatment response prediction, feature selection, external validation, multilayer perceptron
About these checks
Registry, retraction, Cites and statistics results are computed, not judged, with one exception: a printed reference that no index lists is read once by a model before it counts as a citation error. Claims are extracted by a model and kept only when their quote appears verbatim in the text; each cited source is then checked, with a model’s help, for whether it says what the claim relies on. Those verdicts can be wrong — read the claim’s quote and the cited source before relying on one.
Statistics and arithmetic are recomputed, not judged.
Confidence bands are shown only for fields calibrated on our annotated test set. None is calibrated yet, so no band is shown.
What counts as a claim ›How we measure confidence ›How we check this ›
Are you an author, or do you see a problem with this page? Request a review
