

The DOI matches its Crossref record; 30 of the 30 references it cites were found in a registry or an index.
Time trends in mobile phone use and glioma incidence among males in the Nordic Countries, 1979–2016
Abstract
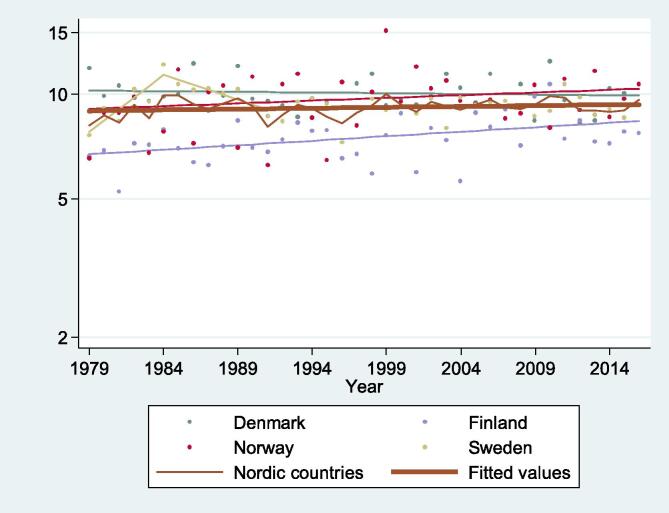
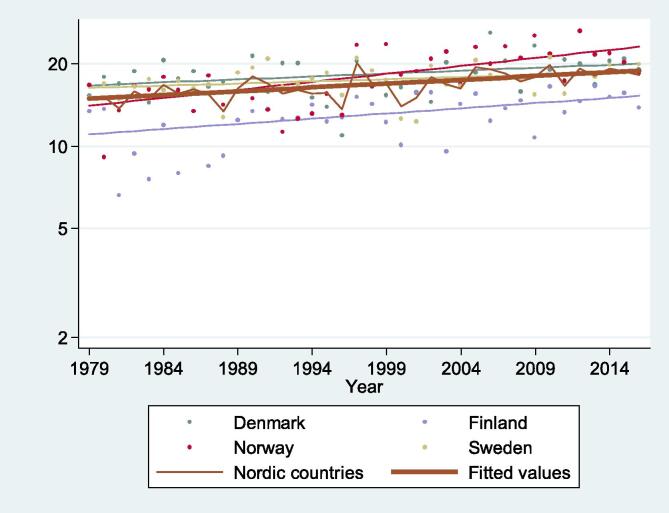
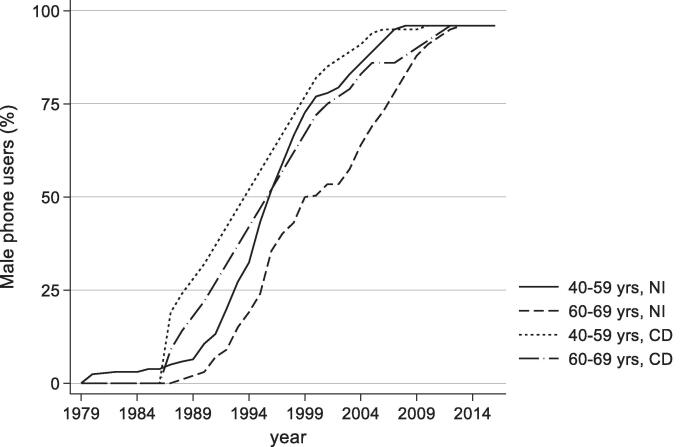
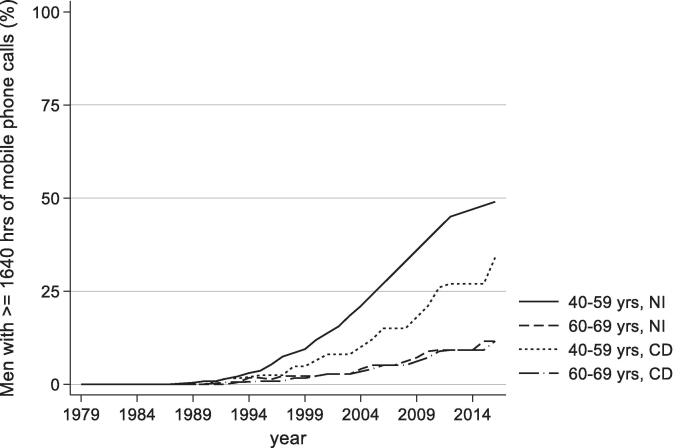
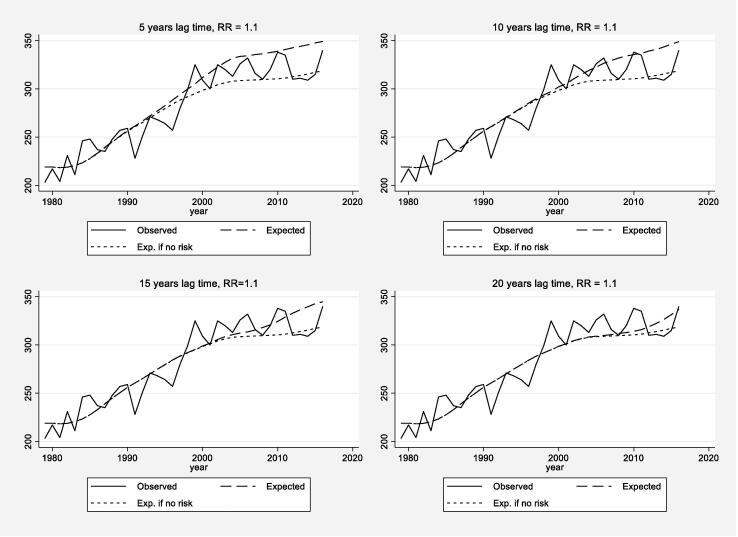
INTRODUCTION: In the Nordic countries, the use of mobile phones increased sharply in the mid-1990s especially among middle-aged men. We investigated time trends in glioma incidence rates (IR) with the perspective to inform about the plausibility of brain tumour risks from mobile phone use reported in some case-control studies. METHODS: We analysed IR of glioma in Denmark, Finland, Norway, and Sweden among men aged 40-69 years, using data from national cancer registries and population statistics during 1979-2016, using log-linear joinpoint analysis. Information on regular mobile phone use and amount of call-time was obtained from major studies of mobile phones in these countries. We compared annual observed incidence with that expected under various risk scenarios to assess which of the reported effect sizes are compatible with the observed IR. The expected numbers of cases were computed accounting for an impact of other factors besides mobile phone use, such as improved cancer registration. RESULTS: Based on 18,232 glioma cases, IR increased slightly but steadily with a change of 0.1% (95 %CI 0.0%; 0.3%) per year during 1979-2016 among 40-59-year-old men and for ages 60-69, by 0.6 % (95 %CI 0.4; 0.9) annually. The observed IR trends among men aged 40-59 years were incompatible with risk ratios (RR) 1.08 or higher with a 10-year lag, RR ≥ 1.2 with 15-year lag and RR ≥ 1.5 with 20-year lag. For the age group 60-69 years, corresponding effect sizes RR ≥ 1.4, ≥2 and ≥ 2.5 could be rejected for lag times 10, 15 and 20 years. DISCUSSION: This study confirms and reinforces the conclusions that no changes in glioma incidence in the Nordic countries have occurred that are consistent with a substantial risk attributable to mobile phone use. This particularly applies to virtually all reported risk increases reported by previous case-control studies with positive findings.
Overview
The claims and statistics of this paper haven’t been checked yet.
Run the check — free, no account needed. It reads the open-access text and checks the sources it cites.
Integrity signals
Registry
Cites
Statistics
Figures
Verification
Claims the paper makes
The claims and statistics of this paper haven’t been checked yet.
Run the check — free, no account needed. It reads the open-access text and checks the sources it cites.
Claims other papers make about this one
Each is checked against this paper’s own text: does it say what the citing paper says it does?
In the citing paper
“Such effect sizes have been shown to be incompatible with the actual incidence time trends of glioma in three simulation studies (Deltour et al., 2012; Deltour et al., 2022; Little et al., 2012).”
From The effect of exposure to radiofrequency fields on cancer risk in the general and working population: A systematic review of human observational studies - Part I: Most researched outcomes. (2024) · cites this paper as Deltour et al., 2022
Self-check
Percentages, sums and reported differences re-computed from the paper’s own numbers.
The self-check needs the paper’s full text.
Citations
Cites
Gjerstorff, M. L. (2011) · Scandinavian Journal of Public Health · doi:10.1177/1403494810393562 · Cited by 1,351
Larsen, I. K., Småstuen, M., Johannesen, T. B., Langmark, F., Parkin, D. M., Bray, F., & Møller, B. (2009) · European Journal of Cancer · doi:10.1016/j.ejca.2008.10.037 · Cited by 848
Self-citationThe INTERPHONE Study Group (2010) · International Journal of Epidemiology · doi:10.1093/ije/dyq079 · Cited by 657
NORDCAN – a Nordic tool for cancer information, planning, quality control and research
Engholm, G., Ferlay, J., Christensen, N., Bray, F., Gjerstorff, M. L., Klint, Å., Køtlum, J. E., Ólafsdóttir, E., Pukkala, E., & Storm, H. H. (2010) · Acta Oncologica · doi:10.3109/02841861003782017 · Cited by 537
The INTERPHONE study: design, epidemiological methods, and description of the study population
Cardis, E., Richardson, L., Deltour, I., Armstrong, B., Feychting, M., Johansen, C., Kilkenny, M., McKinney, P., Modan, B., Sadetzki, S., et al. (2007) · European Journal of Epidemiology · doi:10.1007/s10654-007-9152-z · Cited by 270
Self-citationLeinonen, M. K., Miettinen, J., Heikkinen, S. M. M., Pitkäniemi, J. M., & Malila, N. K. (2017) · European Journal of Cancer · doi:10.1016/j.ejca.2017.02.017 · Cited by 230
Use of mobile phones and risk of brain tumours: update of Danish cohort study
Frei, P., Poulsen, A. H., Johansen, C., Olsen, J. H., Steding‐Jessen, M., & Schüz, J. (2011) · BMJ · doi:10.1136/bmj.d6387 · Cited by 217
Self-citationMobile phone use and risk of glioma in 5 North European countries
Lahkola, A., Auvinen, A. P., Raitanen, J. A., Schoemaker, M. J., Christensen, H. C., Feychting, M., Johansen, C., Klæboe, L., Lönn, S., Swerdlow, A. J., et al. (2007) · International Journal of Cancer · doi:10.1002/ijc.22503 · Cited by 193
Self-citationTime Trends in Brain Tumor Incidence Rates in Denmark, Finland, Norway, and Sweden, 1974-2003
Deltour, I., Johansen, C., Auvinen, A. P., Feychting, M., Klæboe, L., & Schüz, J. (2009) · JNCI Journal of the National Cancer Institute · doi:10.1093/jnci/djp415 · Cited by 165
Self-citationMobile phone use and brain tumours in the CERENAT case-control study
Coureau, G., Bouvier, G., Lebailly, P., Fabbro-Peray, P., Gruber, A., Leffondre, K., Guillamo, J.-S., Loiseau, H., Mathoulin-Pélissier, S., Salamon, R., et al. (2014) · Occupational and Environmental Medicine · doi:10.1136/oemed-2013-101754 · Cited by 159
Cited by
Karipidis, K., Baaken, D., Loney, T., Blettner, M., Brzozek, C., Elwood, M., Narh, C., Orsini, N., Röösli, M., Paulo, M. S., et al. (2024) · Environment International · doi:10.1016/j.envint.2024.108983 · Cited by 58
Mobile phone use and brain tumour risk - COSMOS, a prospective cohort study
Feychting, M., Schüz, J., Toledano, M. B., Vermeulen, R., Auvinen, A., Harbo Poulsen, A., Deltour, I., Smith, R. B., Heller, J., Kromhout, H., et al. (2024) · Environment International · doi:10.1016/j.envint.2024.108552 · Cited by 36
Self-citation
Metadata
- Authors
- Deltour, I., Poulsen, A. H., Johansen, C., Feychting, M., Johannesen, T. B., Auvinen, A., & Schüz, J.
- Venue
- Environment International
- Publisher
- Elsevier BV
- Published
- 2022-10
- Volume
- 168
- Pages
- 107487
- ISSN
- 0160-4120
- PMC
- PMC9463632
- Cited by
- 19
- References
- 30
- Language
- en
- Licence
- www.elsevier.com/tdm/userlicense/1.0/ (tdm)
- www.elsevier.com/legal/tdmrep-license (tdm)
- creativecommons.org/licenses/by-nc-nd/3.0/igo/ (vor)
About these checks
Registry, retraction, Cites and statistics results are computed, not judged, with one exception: a printed reference that no index lists is read once by a model before it counts as a citation error. Claims are extracted by a model and kept only when their quote appears verbatim in the text; each cited source is then checked, with a model’s help, for whether it says what the claim relies on. Those verdicts can be wrong — read the claim’s quote and the cited source before relying on one.
Statistics and arithmetic are recomputed, not judged.
Confidence bands are shown only for fields calibrated on our annotated test set. None is calibrated yet, so no band is shown.
What counts as a claim ›How we measure confidence ›How we check this ›
Are you an author, or do you see a problem with this page? Request a review
Data sources
Bibliographic data: Semantic Scholar, OpenAlex, Crossref.
Contains information from the Semantic Scholar Academic Graph Datasets, made available under the ODC Attribution License (ODC-BY 1.0).
Semantic Scholar’s data is described in: Kinney, R., et al. (2023). The Semantic Scholar Open Data Platform. arXiv:2301.10140.
