

The DOI matches its Crossref record; 106 of the 106 references it cites were found in a registry or an index.
Global nitrogen input on wetland ecosystem: The driving mechanism of soil labile carbon and nitrogen on greenhouse gas emissions
Open accessAbstract
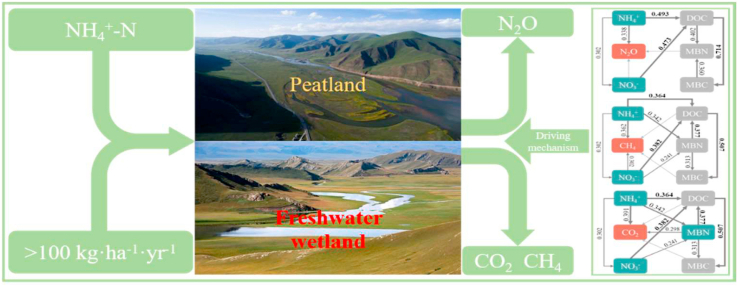
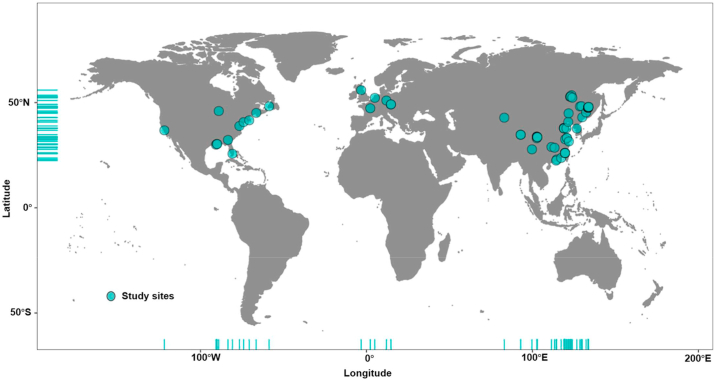
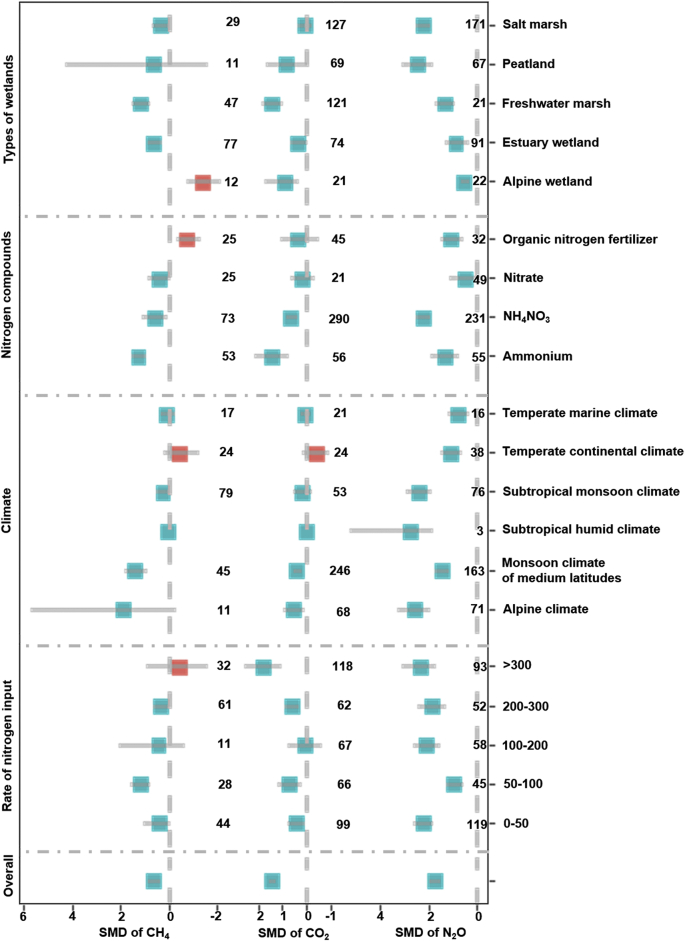
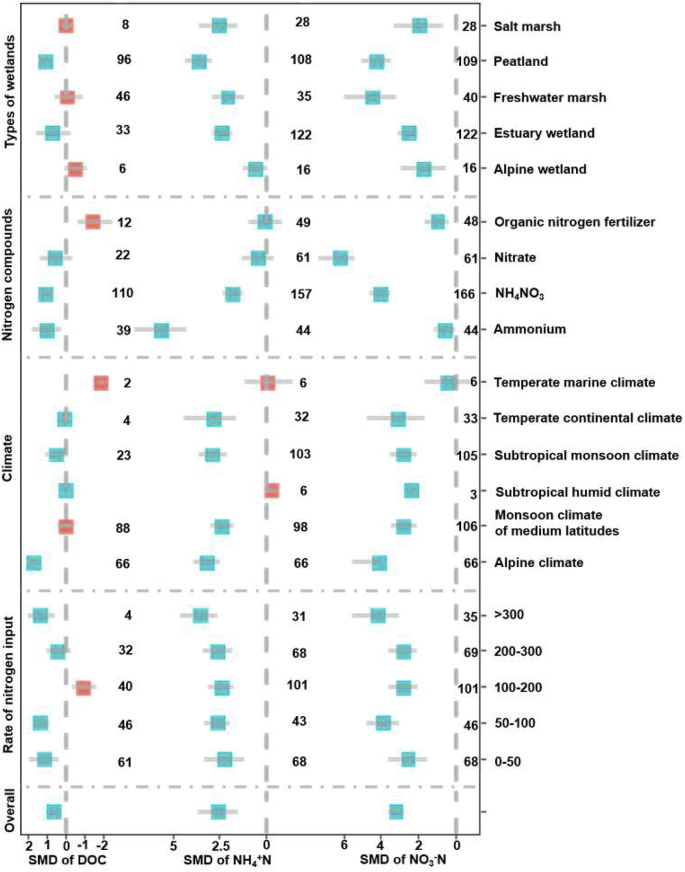
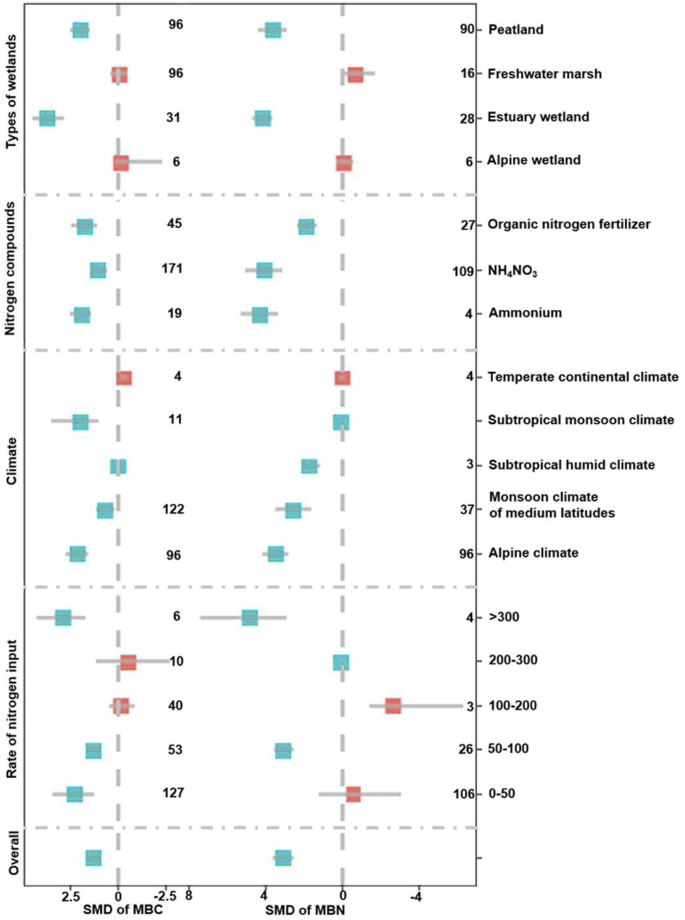
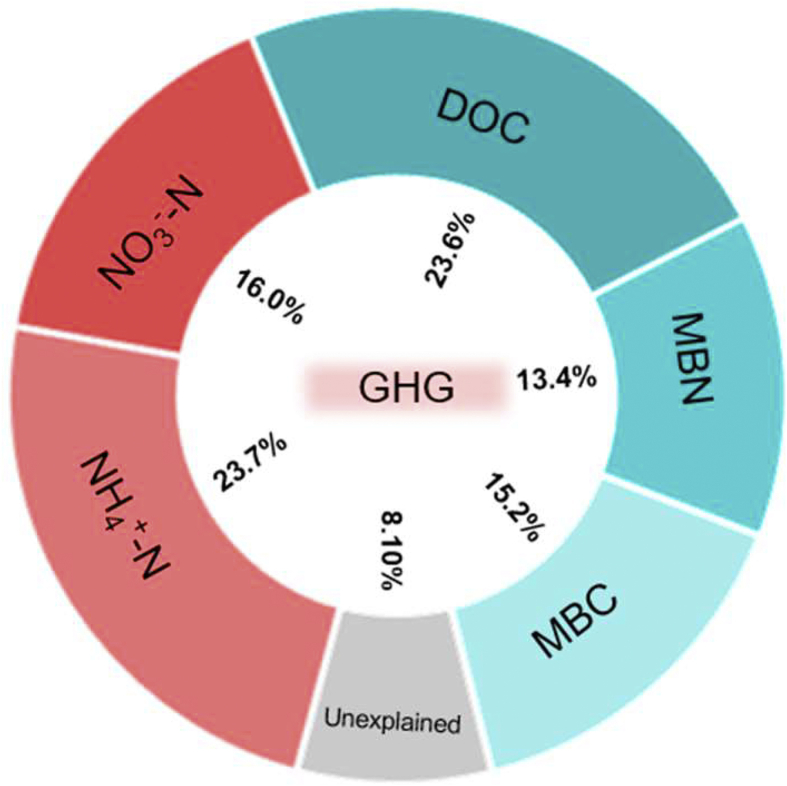
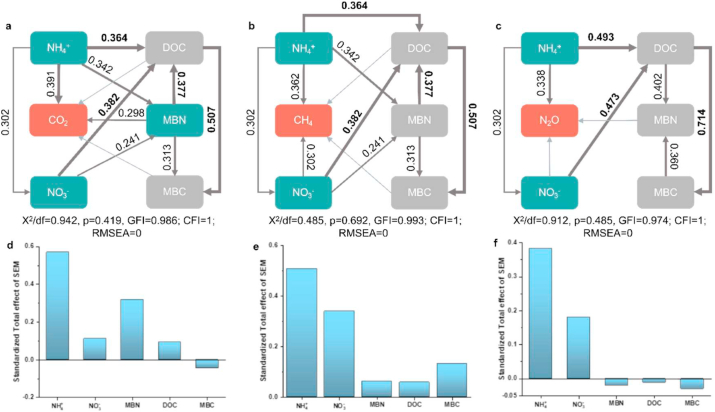
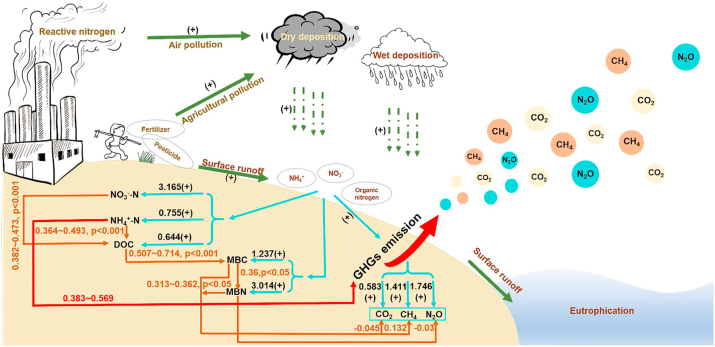
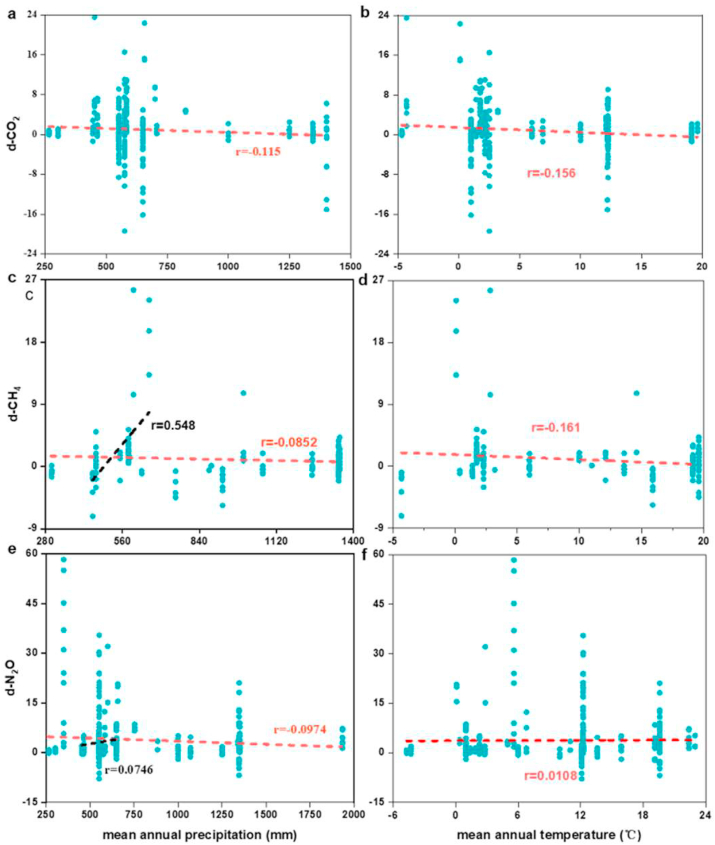
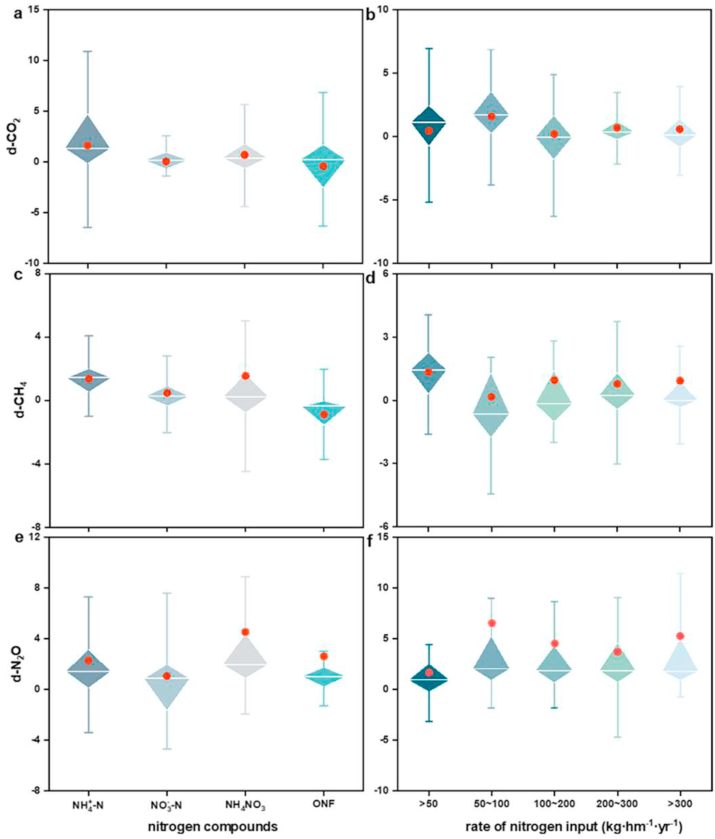
Greenhouse gas emissions from wetlands are significantly promoted by global nitrogen input for changing the rate of soil carbon and nitrogen cycling, and are substantially affected by soil labile carbon and nitrogen conversely. However, the driving mechanism by which soil labile carbon and nitrogen affect greenhouse gas emissions from wetland ecosystems under global nitrogen input is not well understood. Working out the driving factor of nitrogen input on greenhouse gas emissions from wetlands is critical to reducing global warming from nitrogen input. Thus, we synthesized 72 published studies (2144 paired observations) of greenhouse gas fluxes and soil labile compounds of carbon and nitrogen (ammonium, nitrate, dissolved organic carbon, soil microbial biomass nitrogen and carbon), to understand the effects of labile carbon and nitrogen on greenhouse gas emissions under global nitrogen input. Across the data set, nitrogen input significantly promoted carbon dioxide, methane and nitrous oxide emissions from wetlands. In particular, at lower nitrogen rates (<100 kg ha−1·yr−1) and with added ammonium compounds, freshwater wetland significantly promoted carbon dioxide and methane emissions. Peatland was the largest nitrous oxide source under these conditions. This meta-analysis also revealed that nitrogen input stimulated dissolved organic carbon, ammonium, nitrate, microbial biomass carbon and microbial biomass nitrogen accumulation in the wetland ecosystem. The variation-partitioning analysis and structural equation model were used to analyze the relationship between the greenhouse gas and labile carbon and nitrogen further. These results revealed that dissolved organic carbon (DOC) is the primary factor driving greenhouse gas emission from wetlands under global nitrogen input, whereas microbial biomass carbon (MBC) more directly affects greenhouse gas emission than other labile carbon and nitrogen.
Overview
The claims and statistics of this paper haven’t been checked yet.
Run the check — free, no account needed. It reads the open-access text and checks the sources it cites.
Integrity signals
Registry
Cites
Statistics
Figures
Verification
Claims the paper makes
The claims and statistics of this paper haven’t been checked yet.
Run the check — free, no account needed. It reads the open-access text and checks the sources it cites.
Claims other papers make about this one
Each is checked against this paper’s own text: does it say what the citing paper says it does?
The source backs part of the claim, not all of it — or backs it for a different population, condition or comparison.
In the citing paper
“Eutrophication of aquatic environments caused by excessive loadings of phosphorus (P) and nitrogen (N) results in environmental concerns such as the generation of solid wastes and unpleasant emissions to the air [2,3].”
From Microalgae-based wastewater treatment: Mechanisms, challenges, recent advances, and future prospects (2023) · cites this paper as [2]
Experimental — accuracy not yet measured
Self-check
Percentages, sums and reported differences re-computed from the paper’s own numbers.
The self-check needs the paper’s full text.
Citations
Cites
Climate change 2007: the physical science basis
Solomon, S., Qin, D., Manning, M., Marquis, M. C., Averyt, K. B., Tignor, M., Miller, H. L., & Chen, Z. (2007) · Cited by 23,398
Nitrogen cycles: Past, present, and future
Galloway, J. N., Dentener, F. J., Capone, D. G., Boyer, E. W., Howarth, R. W., Seitzinger, S. P., Asner, G. P., Cleveland, C. C., Green, P. A., Holland, E. A., et al. (2004) · Biogeochemistry · doi:10.1007/s10533-004-0370-0 · Cited by 5,315
Statistical Methods for Meta-Analysis.
Freeman, P. R., Hedges, L. V., & Olkin, I. (1986) · Biometrics · doi:10.2307/2531069 · Cited by 4,840
C:N:P stoichiometry in soil: is there a “Redfield ratio” for the microbial biomass?
Cleveland, C. C., & Liptzin, D. (2007) · Biogeochemistry · doi:10.1007/s10533-007-9132-0 · Cited by 2,365
Reduction of forest soil respiration in response to nitrogen deposition
Janssens, I. A., Dieleman, W. I. J., Luyssaert, S., Subke, J., Reichstein, M., Ceulemans, R., Ciais, P., Dolman, A. J., Grace, J., Matteucci, G., et al. (2010) · Nature Geoscience · doi:10.1038/ngeo844 · Cited by 1,633
Nitrogen additions and microbial biomass: a meta-analysis of ecosystem studies
Treseder, K. K. (2008) · Ecology Letters · doi:10.1111/j.1461-0248.2008.01230.x · Cited by 1,607
Knowles, R. (1982) · Microbiological Reviews · doi:10.1128/mmbr.46.1.43-70.1982 · Cited by 843
Pattern and variation of C:N:P ratios in China’s soils: a synthesis of observational data
Tian, H., Chen, G., Zhang, C., Melillo, J. M., & Hall, C. A. S. (2009) · Biogeochemistry · doi:10.1007/s10533-009-9382-0 · Cited by 837
Soil carbon and nitrogen mineralization: Theory and models across scales
Manzoni, S., & Porporato, A. (2009) · Soil Biology and Biochemistry · doi:10.1016/j.soilbio.2009.02.031 · Cited by 788
Research works printed but not linked: 1
- Ren, 2019, vol. 194
Cited by
Sorted by citations
Microalgae-based wastewater treatment: Mechanisms, challenges, recent advances, and future prospects
Abdelfattah, A., Ali, S. S., Ramadan, H., El-Aswar, E. I., Eltawab, R., Ho, S.-H., Elsamahy, T., Li, S., El-Sheekh, M. M., Schagerl, M., et al. (2023) · Environmental Science and Ecotechnology · doi:10.1016/j.ese.2022.100205 · Cited by 894
“Eutrophication of aquatic environments caused by excessive loadings of phosphorus (P) and nitrogen (N) results in environmental concerns such as the generation of solid wastes and unpleasant emissions to the air [2,3].”
BackgroundMapping global soil acidification under N deposition
Chen, C., Xiao, W., & Chen, H. Y. H. (2023) · Global Change Biology · doi:10.1111/gcb.16813 · Cited by 150
Cheng, C., He, Q., Zhang, J., Chai, H., Yang, Y., Pavlostathis, S. G., & Wu, H. (2022) · Water Research · doi:10.1016/j.watres.2022.118251 · Cited by 132
Self-citationBiochar based constructed wetland for secondary effluent treatment: Waste resource utilization
Zheng, F., Fang, J., Guo, F., Yang, X., Liu, T., Chen, M., Nie, M., & Chen, Y. (2021) · Chemical Engineering Journal · doi:10.1016/j.cej.2021.134377 · Cited by 126
Self-citationChen, M., Liu, S., Bi, M., Yang, X., Deng, R., & Chen, Y. (2022) · Journal of Hazardous Materials · doi:10.1016/j.jhazmat.2022.128522 · Cited by 121
Self-citation
Metadata
- Authors
- Chen, M., Chang, L., Zhang, J., Guo, F., Vymazal, J., He, Q., & Chen, Y.
- Affiliations
- Chongqing University (CN)
- Czech University of Life Sciences Prague (CZ)
- Corresponding author
- Chen, Yi
- Venue
- Environmental Science and Ecotechnology
- Publisher
- Elsevier BV
- Published
- 2020-10
- Volume
- 4
- Pages
- 100063
- ISSN
- 2096-9643 (ISSN-L)
- 2666-4984
- PMC
- PMC9488104
- OpenAlex
- W3093193733
- Cited by
- 143
- References
- 105
- Citations by year
- 2026: 26 · 2025: 26 · 2024: 36 · 2023: 26 · 2022: 22 · 2021: 6
- FWCI
- 1.19
- Type
- journal article
- Language
- en
- Open access
- gold
- doi.org
- Licence
- Locations
- Environmental Science and Ecotechnology (publishedVersion, cc-by-nc-nd)
- PubMed Central (publishedVersion, cc-by-nc-nd)
- PubMed (publishedVersion)
- DOAJ (DOAJ: Directory of Open Access Journals) (submittedVersion, cc-by-sa)
- Funders
- National Natural Science Foundation of China (51978099)
- Chongqing Talents Plan for Young Talents (CQY201905062)
- Topics
- Physical Sciences › Environmental Science › Ecology › Peatlands and Wetlands Ecology
- Life Sciences › Agricultural and Biological Sciences › Soil Science › Soil Carbon and Nitrogen Dynamics
- Physical Sciences › Environmental Science › Environmental Chemistry › Soil and Water Nutrient Dynamics
- Keywords
- dissolved organic carbon, microbial biomass carbon, microbial biomass nitrogen, ammonium, nitrate, CO2 emissions, methane emissions, nitrous oxide emissions, freshwater wetlands, peatlands, nitrogen deposition
About these checks
Registry, retraction, Cites and statistics results are computed, not judged, with one exception: a printed reference that no index lists is read once by a model before it counts as a citation error. Claims are extracted by a model and kept only when their quote appears verbatim in the text; each cited source is then checked, with a model’s help, for whether it says what the claim relies on. Those verdicts can be wrong — read the claim’s quote and the cited source before relying on one.
Statistics and arithmetic are recomputed, not judged.
Confidence bands are shown only for fields calibrated on our annotated test set. None is calibrated yet, so no band is shown.
What counts as a claim ›How we measure confidence ›How we check this ›
Are you an author, or do you see a problem with this page? Request a review
