Cited by 9

The DOI matches its Crossref record; 3 of the 3 references it cites were found in a registry or an index.

Upregulation of EphA4 deteriorate brain damage by shifting microglia M1-polarization via NF-κB signaling after focal cerebral ischemia in rats

Wei, Hui-Xing, Guan, Yun-Ni, Chen, Ping-Ping, Rao, Zhao-Zeng, Yang, Jin-Shan·2023·Heliyon

Overview

The claims and statistics of this paper haven’t been checked yet.

Run the check — free, no account needed. It reads the open-access text and checks the sources it cites.

A few free checks a day · papers already verified open instantly · results are public

Integrity signals

Registry

Crossref · 10.1016/j.heliyon.2023.e18429

Cites

3 of 3 references verified0 citation errors · 0 not checkable

Statistics

Figures

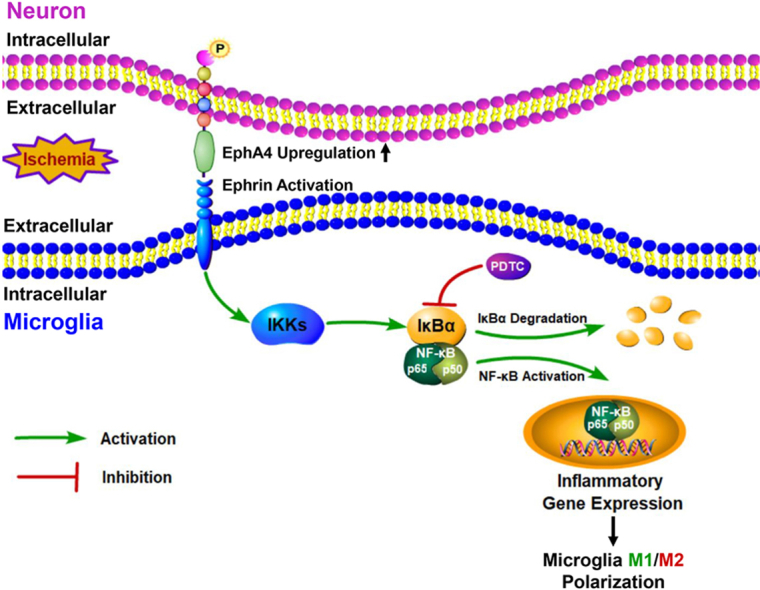
Graphical abstract
Graphical abstract CC BY · PubMed Central
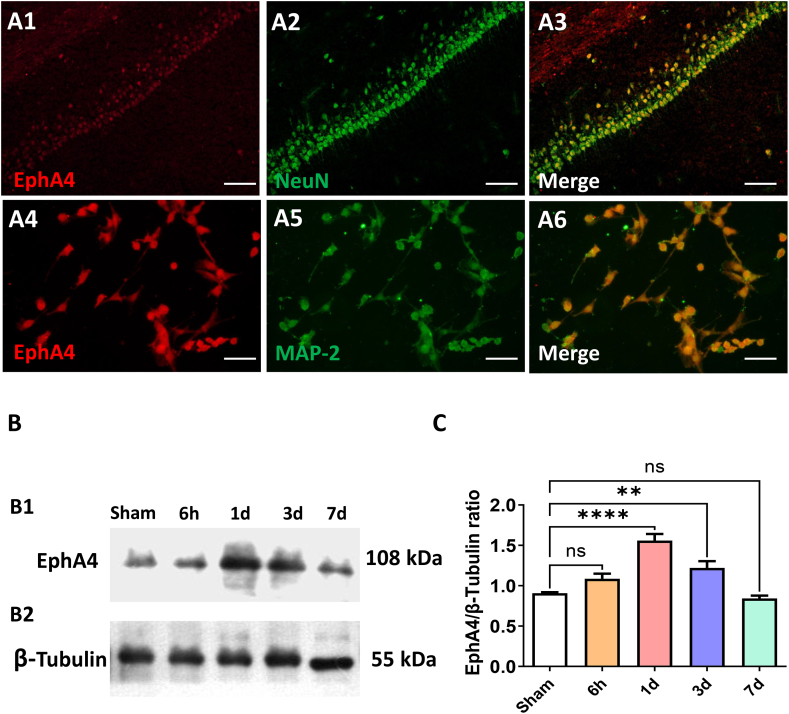
Fig. 1 Cellular Distribution and Change Pattern of EphA4 in Rat Brain. (A1-A3) Double-label immunofluorescent staining of EphA4 (red) and NeuN (green) in CA1 region of hippocampus. Scale bar = 50 μm (A4-A6) EphA4 expression on primary neurons identified by double immunofluorescent staining with EphA4 (red) and MAP-2 (green). Scale bar = 50 μm (B1–B2) The change pattern of EphA4 after transient focal ischemia was detected by Western Blot. (C) Quantifications of EphA4 protein levels. The results were represented as the mean ± SD, and the differences between groups were compared with one-way analysis of variance (ANOVA) followed by LSD's post hoc test (n = 5, **P < 0.01, ****P < 0.0001 vs Sham group). (For interpretation of the references to colour in this figure legend, the reader is referred to the Web version of this article.)
Fig. 1 Cellular Distribution and Change Pattern of EphA4 in Rat Brain. (A1-A3) Double-label immunofluorescent staining of EphA4 (red) and NeuN (green) in CA1 region of hippocampus. Scale bar = 50 μm (A4-A6) EphA4 expression on primary neurons identified by double immunofluorescent staining with EphA4 (red) and MAP-2 (green). Scale bar = 50 μm (B1–B2) The change pattern of EphA4 after transient focal ischemia was detected by Western Blot. (C) Quantifications of EphA4 protein levels. The results were represented as the mean ± SD, and the differences between groups were compared with one-way analysis of variance (ANOVA) followed by LSD's post hoc test (n = 5, **P < 0.01, ****P < 0.0001 vs Sham group). (For interpretation of the references to colour in this figure legend, the reader is referred to the Web version of this article.)CC BY · PubMed Central
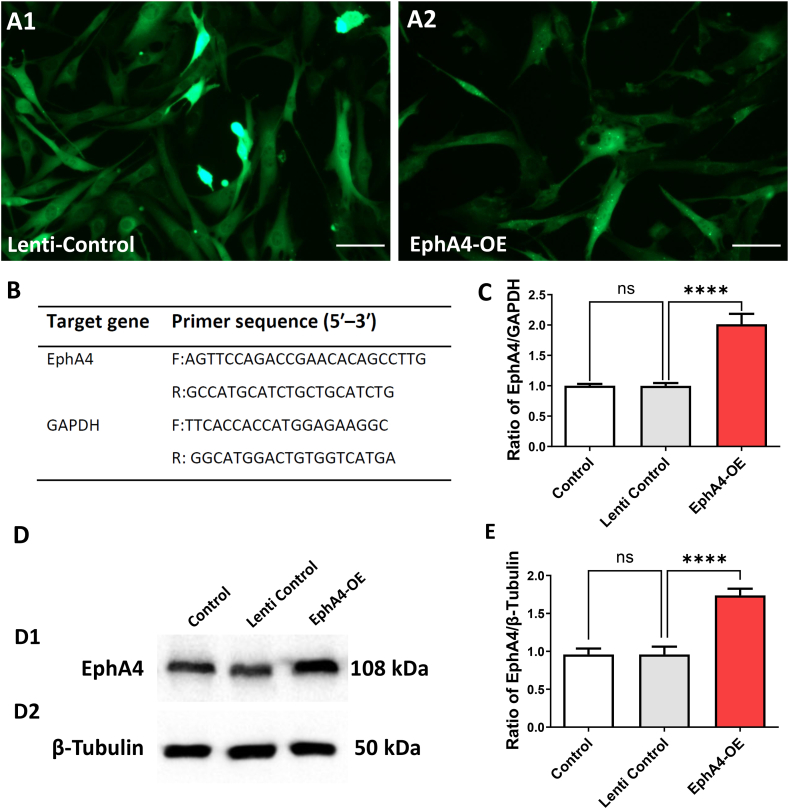
Fig. 2 EphA4 Overexpression Lentiviral Vectors Construction. (A1-A2) The GFP (green) staining in primary neuron cultures which confirmed that lentiviral vectors that expressing nontargeting controls or overexpressing EphA4 were transfected into primary neurons. Scale bar = 50 μm. (B) Primers for detecting target gene. (C) The EphA4-specific overexpression lentiviral vectors increased EphA4 mRNA level, as confirmed by RT- PCR. EphA4 mRNA level was quantified and normalized to GAPDH. (D1-D2) The EphA4 protein level was tested by Western Blot method. (E) EphA4 protein expression was quantified and normalized. The results were represented as the mean ± SD, and the differences between groups were compared with ANOVA followed by LSD's post hoc test (n = 5, ****P < 0.0001 vs Lenti Control group). (For interpretation of the references to colour in this figure legend, the reader is referred to the Web version of this article.)
Fig. 2 EphA4 Overexpression Lentiviral Vectors Construction. (A1-A2) The GFP (green) staining in primary neuron cultures which confirmed that lentiviral vectors that expressing nontargeting controls or overexpressing EphA4 were transfected into primary neurons. Scale bar = 50 μm. (B) Primers for detecting target gene. (C) The EphA4-specific overexpression lentiviral vectors increased EphA4 mRNA level, as confirmed by RT- PCR. EphA4 mRNA level was quantified and normalized to GAPDH. (D1-D2) The EphA4 protein level was tested by Western Blot method. (E) EphA4 protein expression was quantified and normalized. The results were represented as the mean ± SD, and the differences between groups were compared with ANOVA followed by LSD's post hoc test (n = 5, ****P < 0.0001 vs Lenti Control group). (For interpretation of the references to colour in this figure legend, the reader is referred to the Web version of this article.)CC BY · PubMed Central
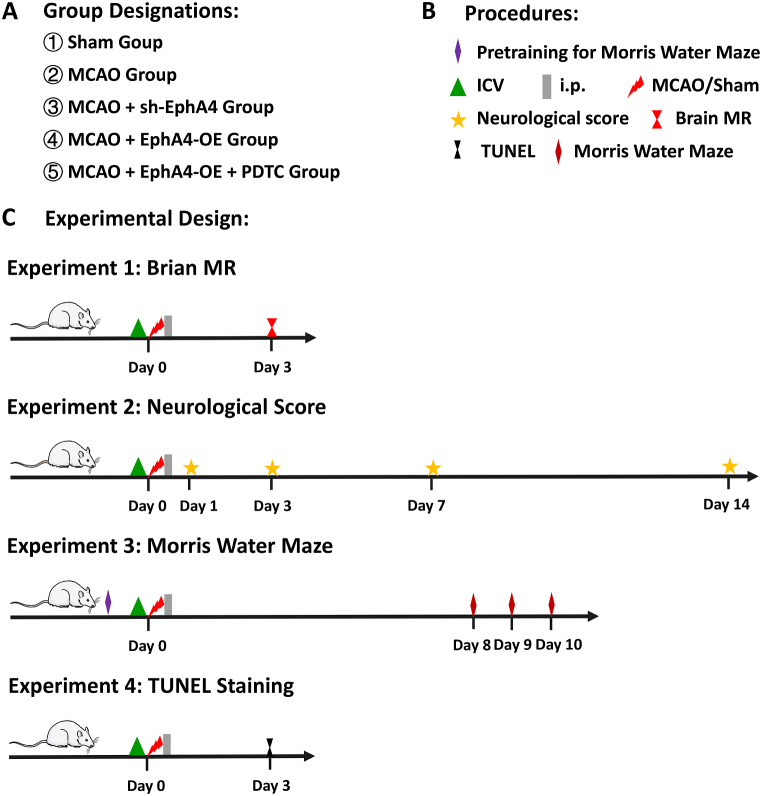
Fig. 3 Schematic diagram of experimental procedure. (A) Animals were randomly assigned into five groups: Sham group, MCAO group, MCAO + sh-EphA4 group, MCAO + EphA4-OE group and MCAO + EphA4-OE + PDTC group. (B) Representative mark of procedures carried out during animal experiments. (C) Separate series of 4 main animal experiments including infarct volume assessment with Brain MRI, neurological function scoring, Morris Water Maze test and TUNEL staining.
Fig. 3 Schematic diagram of experimental procedure. (A) Animals were randomly assigned into five groups: Sham group, MCAO group, MCAO + sh-EphA4 group, MCAO + EphA4-OE group and MCAO + EphA4-OE + PDTC group. (B) Representative mark of procedures carried out during animal experiments. (C) Separate series of 4 main animal experiments including infarct volume assessment with Brain MRI, neurological function scoring, Morris Water Maze test and TUNEL staining.CC BY · PubMed Central
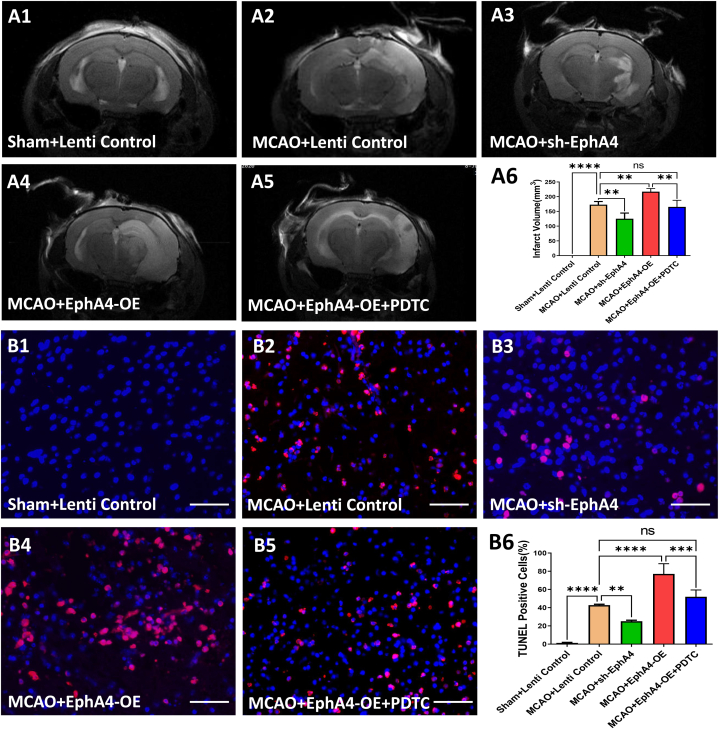
Fig. 4 EphA4 Overexpression Aggravated Brain Damage and Neuronal Apoptosis after Ischemia. (A1-A5) Representative MRI images showing infarcted areas after MCAO. (A6) Infarct volume evaluated at day 3 after MCAO. (B1–B5) TUNEL (+) staining (red) plus DAPI (blue) to label apoptotic cells in the boundary zone of ischemic area. Scale Bar = 50 μm (B6) Counting of TUNEL-positive cells in peri-ischemic regions of MCAO rats on postoperative day 3. The results were represented as the mean ± SD, and the differences between groups were compared with ANOVA followed by LSD's post hoc test (n = 5, **P < 0.01, ***P < 0.001, ****P < 0.0001, ns: no significance). (For interpretation of the references to colour in this figure legend, the reader is referred to the Web version of this article.)
Fig. 4 EphA4 Overexpression Aggravated Brain Damage and Neuronal Apoptosis after Ischemia. (A1-A5) Representative MRI images showing infarcted areas after MCAO. (A6) Infarct volume evaluated at day 3 after MCAO. (B1–B5) TUNEL (+) staining (red) plus DAPI (blue) to label apoptotic cells in the boundary zone of ischemic area. Scale Bar = 50 μm (B6) Counting of TUNEL-positive cells in peri-ischemic regions of MCAO rats on postoperative day 3. The results were represented as the mean ± SD, and the differences between groups were compared with ANOVA followed by LSD's post hoc test (n = 5, **P < 0.01, ***P < 0.001, ****P < 0.0001, ns: no significance). (For interpretation of the references to colour in this figure legend, the reader is referred to the Web version of this article.)CC BY · PubMed Central
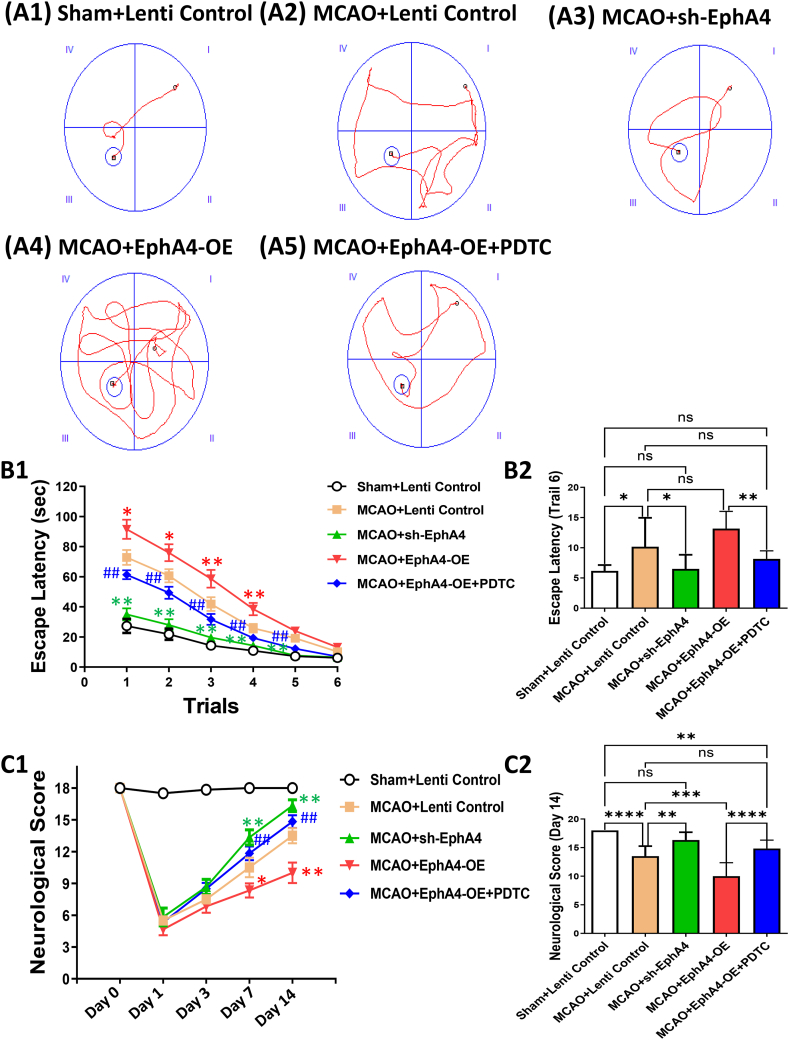
Fig. 5 EphA4 Overexpression Worsened Neurobehavioral Function after Ischemia. (A1-A5) Representative swimming traces in MWM from different groups. (B1–B2) Escape latency, which indicated hippocampus-dependent spatial memory, was measured. The results were represented as the mean ± SD, and the differences between groups were compared with ANOVA followed by LSD's post hoc test (n = 6, *P < 0.05, **P < 0.01, ***P < 0.001, ****P < 0.0001, ns: no significance). (C1–C2) Neurological deficit was scored. The results were represented as the mean ± SD or median ± interquartile range, and ANOVA followed by LSD's post hoc test or nonparametric Kruskal-Wallis followed by Bonferroni correction was used to compare differences between groups (n = 6, *P < 0.05, **P < 0.01, ***P < 0.001, ****P < 0.0001, ns: no significance).
Fig. 5 EphA4 Overexpression Worsened Neurobehavioral Function after Ischemia. (A1-A5) Representative swimming traces in MWM from different groups. (B1–B2) Escape latency, which indicated hippocampus-dependent spatial memory, was measured. The results were represented as the mean ± SD, and the differences between groups were compared with ANOVA followed by LSD's post hoc test (n = 6, *P < 0.05, **P < 0.01, ***P < 0.001, ****P < 0.0001, ns: no significance). (C1–C2) Neurological deficit was scored. The results were represented as the mean ± SD or median ± interquartile range, and ANOVA followed by LSD's post hoc test or nonparametric Kruskal-Wallis followed by Bonferroni correction was used to compare differences between groups (n = 6, *P < 0.05, **P < 0.01, ***P < 0.001, ****P < 0.0001, ns: no significance).CC BY · PubMed Central
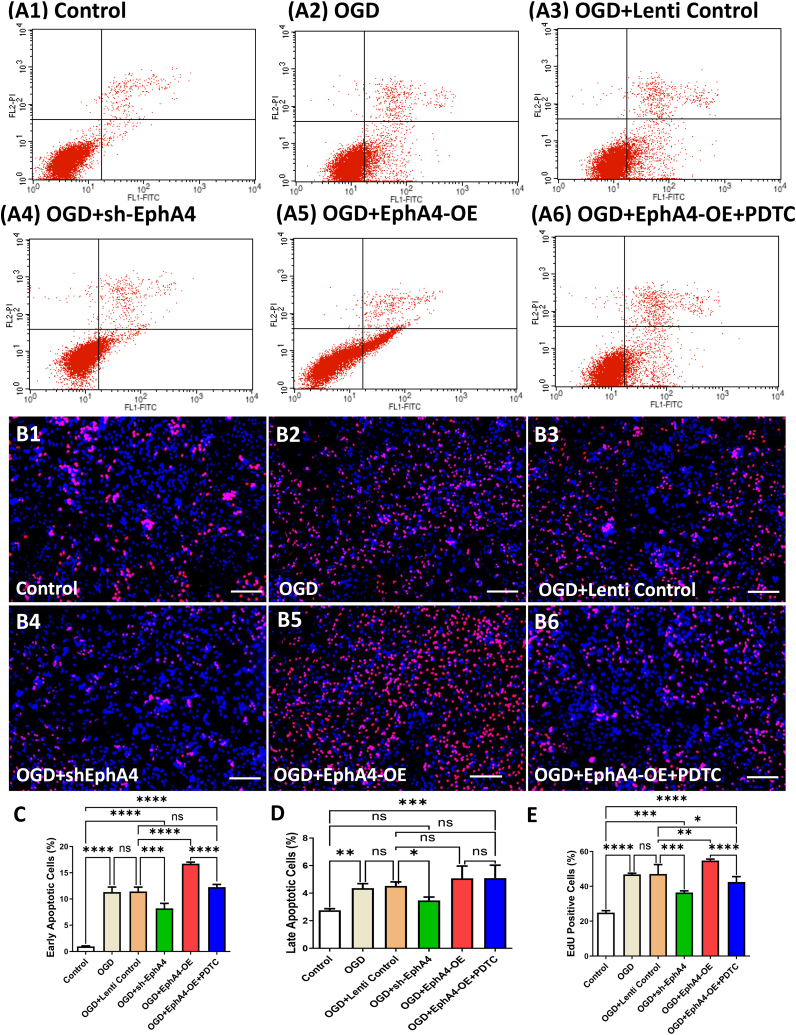
Fig. 6 EphA4 Overexpression Increased Apoptosis and Microglia Proliferation Induced by OGD. (A1-A6) Representative data of apoptosis detected by flow cytometry. (B1–B6) Microglia proliferation was tested via EdU (red) staining and DAPI staining (blue). Scale bar = 100 μm. (C–D) Summary of the percentage of apoptotic cells in each group. (E) Counting of EdU-positive microglia cells in co-cultures. The results were represented as the mean ± SD, and the differences between groups were compared with ANOVA followed by LSD's post hoc test (n = 5, *P < 0.05, **P < 0.01, ***P < 0.001, ****P < 0.0001, ns: no significance). (For interpretation of the references to colour in this figure legend, the reader is referred to the Web version of this article.)
Fig. 6 EphA4 Overexpression Increased Apoptosis and Microglia Proliferation Induced by OGD. (A1-A6) Representative data of apoptosis detected by flow cytometry. (B1–B6) Microglia proliferation was tested via EdU (red) staining and DAPI staining (blue). Scale bar = 100 μm. (C–D) Summary of the percentage of apoptotic cells in each group. (E) Counting of EdU-positive microglia cells in co-cultures. The results were represented as the mean ± SD, and the differences between groups were compared with ANOVA followed by LSD's post hoc test (n = 5, *P < 0.05, **P < 0.01, ***P < 0.001, ****P < 0.0001, ns: no significance). (For interpretation of the references to colour in this figure legend, the reader is referred to the Web version of this article.)CC BY · PubMed Central
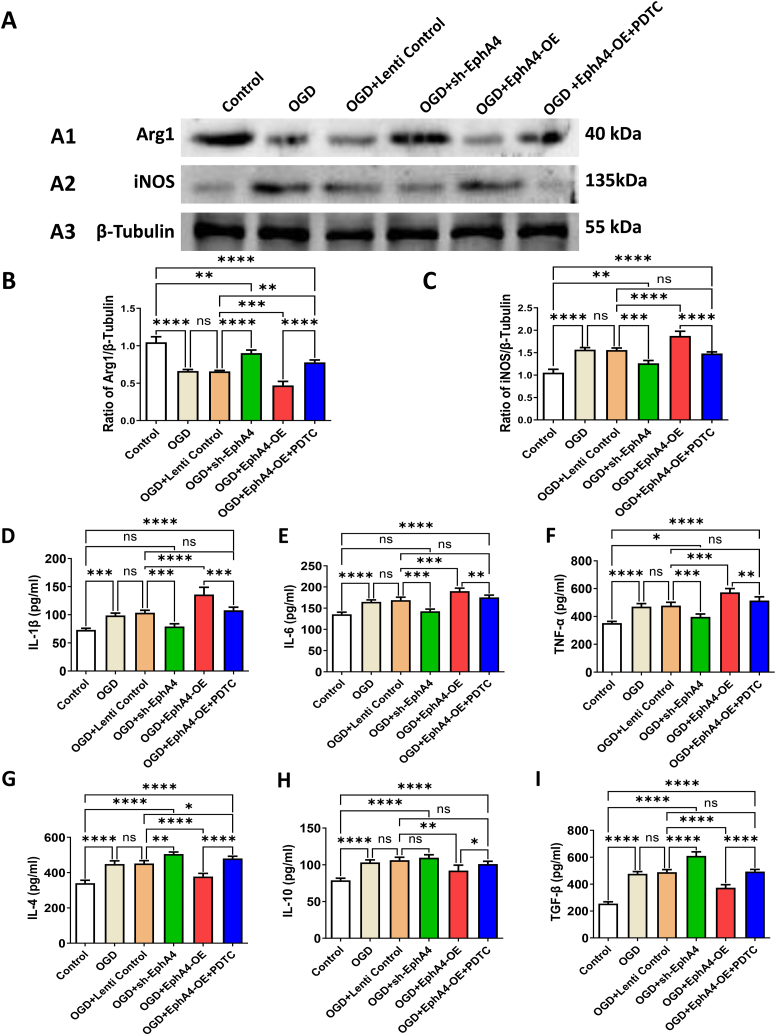
Fig. 7 Effects of Neuronal EphA4 Manipulation on The Polarization of Microglia. (A1-A3) Western Blot indicated protein level changes in Arg1 and iNOS. (B and C) Quantification of the protein levels of the Arg1 (B) and iNOS (C). Protein level was quantified and normalized to β-Tubulin. (D–I) Cytokine levels of IL-1β (D), IL-6 (E), TNF-α (F), IL-4 (G), IL-10 (H) and TGF-β (I) were detected by ELISA kit. The results were represented as the mean ± SD, and the differences between groups were compared with ANOVA followed by LSD's post hoc test (n = 5, *P < 0.05, **P < 0.01, ***P < 0.001, ****P < 0.0001, ns: no significance).
Fig. 7 Effects of Neuronal EphA4 Manipulation on The Polarization of Microglia. (A1-A3) Western Blot indicated protein level changes in Arg1 and iNOS. (B and C) Quantification of the protein levels of the Arg1 (B) and iNOS (C). Protein level was quantified and normalized to β-Tubulin. (D–I) Cytokine levels of IL-1β (D), IL-6 (E), TNF-α (F), IL-4 (G), IL-10 (H) and TGF-β (I) were detected by ELISA kit. The results were represented as the mean ± SD, and the differences between groups were compared with ANOVA followed by LSD's post hoc test (n = 5, *P < 0.05, **P < 0.01, ***P < 0.001, ****P < 0.0001, ns: no significance).CC BY · PubMed Central
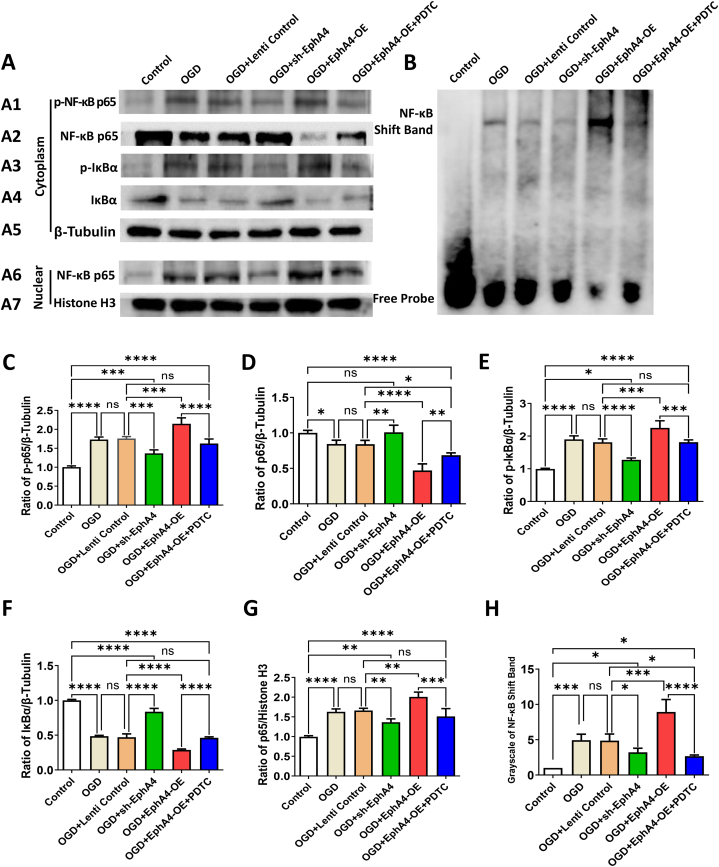
Fig. 8 EphA4 Manipulation Regulated the Microglia Polarization via NF-κB Signaling. (A1-A7) Representative Western blot images showed the protein levels of p–NF–κB p65, total NF-κB p65, p-IκBα, total IκBα and nuclear NF-κB p65. The β-Tubulin and histone H3 acted as loading control for cytoplasmic and nuclear proteins respectively. (B, H) EMSA with a DIG-labeled NF-κB probe was performed to explore the DNA binding activity of NF-κB. (C–G) Quantification of the protein levels of the cytoplasmic p–NF–κB p65 (C), cytoplasmic total NF-κB P65 (D), cytoplasmic p-IκBα (E), cytoplasmic total IκBα (F) and nuclear NF-κB p65 (G). The results were represented as the mean ± SD, and the differences between groups were compared with ANOVA followed by LSD's post hoc test (n = 5, *P < 0.05, **P < 0.01, ***P < 0.001, ****P < 0.0001, ns: no significance).
Fig. 8 EphA4 Manipulation Regulated the Microglia Polarization via NF-κB Signaling. (A1-A7) Representative Western blot images showed the protein levels of p–NF–κB p65, total NF-κB p65, p-IκBα, total IκBα and nuclear NF-κB p65. The β-Tubulin and histone H3 acted as loading control for cytoplasmic and nuclear proteins respectively. (B, H) EMSA with a DIG-labeled NF-κB probe was performed to explore the DNA binding activity of NF-κB. (C–G) Quantification of the protein levels of the cytoplasmic p–NF–κB p65 (C), cytoplasmic total NF-κB P65 (D), cytoplasmic p-IκBα (E), cytoplasmic total IκBα (F) and nuclear NF-κB p65 (G). The results were represented as the mean ± SD, and the differences between groups were compared with ANOVA followed by LSD's post hoc test (n = 5, *P < 0.05, **P < 0.01, ***P < 0.001, ****P < 0.0001, ns: no significance).CC BY · PubMed Central

Verification

Claims the paper makes

The claims and statistics of this paper haven’t been checked yet.

Run the check — free, no account needed. It reads the open-access text and checks the sources it cites.

A few free checks a day · papers already verified open instantly · results are public

Claims other papers make about this one

Each is checked against this paper’s own text: does it say what the citing paper says it does?

Self-check

Percentages, sums and reported differences re-computed from the paper’s own numbers.

The self-check needs the paper’s full text.

Citations

Cites

Research works printed but not linked: 36

  1. Lambertsen, 2019, Post-stroke inflammation-target or tool for therapy?, Acta Neuropathol., 137, 693, 10.1007/s00401-018-1930-z · DOI
  2. Ma, 2017, The biphasic function of microglia in ischemic stroke, Prog. Neurobiol., 157, 247, 10.1016/j.pneurobio.2016.01.005 · DOI · Paper page
  3. Wang, 2018, Treatment targets for M2 microglia polarization in ischemic stroke, Biomed. Pharmacother.= Biomedecine & pharmacotherapie, 105, 518, 10.1016/j.biopha.2018.05.143 · DOI
  4. Yang, 2018, Roles of Eph/ephrin bidirectional signaling in central nervous system injury and recovery, Exp. Ther. Med., 15, 2219
  5. Yang, 2014, Ephrin-A3 reverse signaling regulates hippocampal neuronal damage and astrocytic glutamate transport after transient global ischemia, J. Neurochem., 131, 383, 10.1111/jnc.12819 · DOI
  6. Wei, 2019, Neuronal EphA4 regulates OGD/R-Induced apoptosis by promoting alternative activation of microglia, Inflammation, 42, 572, 10.1007/s10753-018-0914-4 · DOI
  7. Munro, 2012, Differential gene expression in the EphA4 knockout spinal cord and analysis of the inflammatory response following spinal cord injury, PLoS One, 7, 10.1371/journal.pone.0037635 · DOI
  8. Kowalski, 2019, Peripheral loss of EphA4 ameliorates TBI-induced neuroinflammation and tissue damage, J. Neuroinflammation, 16, 210, 10.1186/s12974-019-1605-2 · DOI
  9. He, 2015, Huwe1 interacts with Gadd45b under oxygen-glucose deprivation and reperfusion injury in primary Rat cortical neuronal cells, Mol. Brain, 8, 88, 10.1186/s13041-015-0178-y · DOI
  10. Zhu, 2007, Inhibiting cell cycle progression reduces reactive astrogliosis initiated by scratch injury in vitro and by cerebral ischemia in vivo, Glia, 55, 546, 10.1002/glia.20476 · DOI
  11. Liu, 2014, Linolenic acid provides multi-cellular protective effects after photothrombotic cerebral ischemia in rats, Neurochem. Res., 39, 1797, 10.1007/s11064-014-1390-3 · DOI
  12. Nurmi, 2004, Nuclear factor-kappaB contributes to infarction after permanent focal ischemia, Stroke, 35, 987, 10.1161/01.STR.0000120732.45951.26 · DOI
  13. Schneider, 2012, NIH Image to ImageJ: 25 years of image analysis, Nat. Methods, 9, 671, 10.1038/nmeth.2089 · DOI · Paper page
  14. Garcia, 1995, Neurological deficit and extent of neuronal necrosis attributable to middle cerebral artery occlusion in rats, Stat. Valid. Stroke, 26, 627, 10.1161/01.STR.26.4.627 · DOI
  15. Vorhees, 2006, Morris water maze: procedures for assessing spatial and related forms of learning and memory, Nat. Protoc., 1, 848, 10.1038/nprot.2006.116 · DOI · Paper page
  16. Zujovic, 2003, Use of cocultured cell systems to elucidate chemokine-dependent neuronal/microglial interactions: control of microglial activation, Methods, 29, 345, 10.1016/S1046-2023(02)00358-4 · DOI
  17. Gingras, 2007, Optimized protocols for isolation of primary motor neurons, astrocytes and microglia from embryonic mouse spinal cord, J. Neurosci. Methods, 163, 111, 10.1016/j.jneumeth.2007.02.024 · DOI
  18. Livak, 2001, Analysis of relative gene expression data using real-time quantitative PCR and the 2(-Delta Delta C(T)) Method, Methods, 25, 402, 10.1006/meth.2001.1262 · DOI · Paper page
  19. Hu, 2015, Microglial and macrophage polarization-new prospects for brain repair, Nat. Rev. Neurol., 11, 56, 10.1038/nrneurol.2014.207 · DOI · Paper page
  20. Xue, 2021, Microglial polarization: novel therapeutic strategy against ischemic stroke, Agin. Dis., 12, 466, 10.14336/AD.2020.0701 · DOI
  21. Shih, 2015, NF-kappaB signaling pathways in neurological inflammation: a Mini review, Front. Mol. Neurosci., 8, 77, 10.3389/fnmol.2015.00077 · DOI
  22. Carmona, 2009, Glial ephrin-A3 regulates hippocampal dendritic spine morphology and glutamate transport, Proc. Natl. Acad. Sci. U. S. A., 106, 12524, 10.1073/pnas.0903328106 · DOI
  23. Filosa, 2009, Neuron-glia communication via EphA4/ephrin-A3 modulates LTP through glial glutamate transport, Nat. Neurosci., 12, 1285, 10.1038/nn.2394 · DOI
  24. Barnabei, 2021, NF-κB: at the borders of autoimmunity and inflammation, Front. Immunol., 12, 10.3389/fimmu.2021.716469 · DOI
  25. Mitchell, 2018, NF-kappaB and the transcriptional control of inflammation, Int. Rev. Cell Mol. Biol., 335, 41, 10.1016/bs.ircmb.2017.07.007 · DOI
  26. Ye, 2019, Meisoindigo protects against focal cerebral ischemia-reperfusion injury by inhibiting NLRP3 inflammasome activation and regulating microglia/macrophage polarization via TLR4/NF-kappaB signaling pathway, Front. Cell. Neurosci., 13, 553, 10.3389/fncel.2019.00553 · DOI
  27. Li, 2021, The phase changes of M1/M2 phenotype of microglia/macrophage following oxygen-induced retinopathy in mice, Inflamm. Res. : Off. J. Eur. Histam. Res. Soci., 70, 183, 10.1007/s00011-020-01427-w · DOI
  28. Yang, 2017, Resveratrol regulates microglia M1/M2 polarization via PGC-1alpha in conditions of neuroinflammatory injury, Brain Behav. Immun., 64, 162, 10.1016/j.bbi.2017.03.003 · DOI
  29. Fan, 2017, Critical role of EphA4 in early brain injury after subarachnoid hemorrhage in rat, Exp. Neurol., 296, 41, 10.1016/j.expneurol.2017.07.003 · DOI
  30. Xu, 2020, Activated ephrinA3/EphA4 forward signaling induces retinal ganglion cell apoptosis in experimental glaucoma, Neuropharmacology, 178, 10.1016/j.neuropharm.2020.108228 · DOI
  31. Fu, 2014, Blockade of EphA4 signaling ameliorates hippocampal synaptic dysfunctions in mouse models of Alzheimer's disease, Proc. Natl. Acad. Sci. U. S. A., 111, 9959, 10.1073/pnas.1405803111 · DOI · Paper page
  32. Vargas, 2018, Amyloid-beta oligomers synaptotoxicity: the emerging role of EphA4/c-Abl signaling in Alzheimer's disease, Biochim. Biophys. Acta, Mol. Basis Dis., 1864, 1148, 10.1016/j.bbadis.2018.01.023 · DOI
  33. Listwak, 2013, Minimal NF-kappaB activity in neurons, Neuroscience, 250, 282, 10.1016/j.neuroscience.2013.07.013 · DOI
  34. Boersma, 2011, A requirement for nuclear factor-kappaB in developmental and plasticity-associated synaptogenesis, J. Neurosci. : Off. J. Soci. Neurosci., 31, 5414, 10.1523/JNEUROSCI.2456-10.2011 · DOI · Paper page
  35. Poppe, 2019, EphA4 loss improves social memory performance and alters dendritic spine morphology without changes in amyloid pathology in a mouse model of Alzheimer's disease, Alzheimer's Res. Ther., 11, 102, 10.1186/s13195-019-0554-4 · DOI
  36. Wu, 2017, Potent and selective EphA4 agonists for the treatment of ALS, Cell Chem. Biol., 24, 293, 10.1016/j.chembiol.2017.01.006 · DOI

Cited by

Sorted by citations

See all 9

Metadata

Authors
Wei, H.-X., Guan, Y.-N., Chen, P.-P., Rao, Z.-Z., & Yang, J.-S.
Venue
Heliyon
Publisher
Elsevier BV
Published
2023-07
Volume
9
Issue
7
Pages
e18429
ISSN
2405-8440
Cited by
9
References
3
Language
en
Funders
  • National Natural Science Foundation of China (81901209)
  • Natural Science Foundation of Fujian Province (2020J01958)

About these checks

Registry, retraction, Cites and statistics results are computed, not judged, with one exception: a printed reference that no index lists is read once by a model before it counts as a citation error. Claims are extracted by a model and kept only when their quote appears verbatim in the text; each cited source is then checked, with a model’s help, for whether it says what the claim relies on. Those verdicts can be wrong — read the claim’s quote and the cited source before relying on one.

Statistics and arithmetic are recomputed, not judged.

Confidence bands are shown only for fields calibrated on our annotated test set. None is calibrated yet, so no band is shown.

What counts as a claim ›How we measure confidence ›How we check this ›

Are you an author, or do you see a problem with this page? Request a review