Cited by 32

The DOI matches its Crossref record.

Increased LDL receptor by SREBP2 or SREBP2-induced lncRNA LDLR-AS promotes triglyceride accumulation in fish

Cao, Xiufei, Fang, Wei, Li, Xueshan, Wang, Xiuneng, Mai, Kangsen, Ai, Qinghui·2022·iScience

Overview

The claims and statistics of this paper haven’t been checked yet.

Run the check — free, no account needed. It reads the open-access text and checks the sources it cites.

A few free checks a day · papers already verified open instantly · results are public

Integrity signals

Registry

Crossref · 10.1016/j.isci.2022.104670

Cites

Statistics

Figures

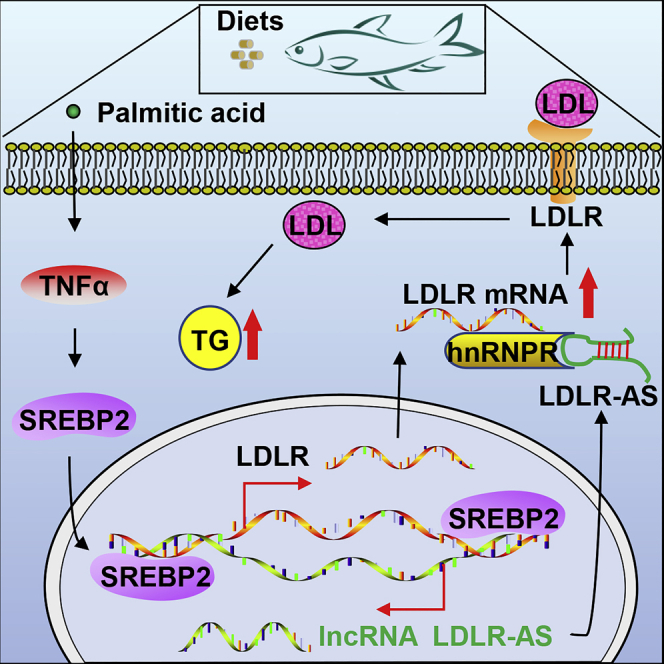
Graphical abstract
Graphical abstract CC BY-NC-ND · PubMed Central
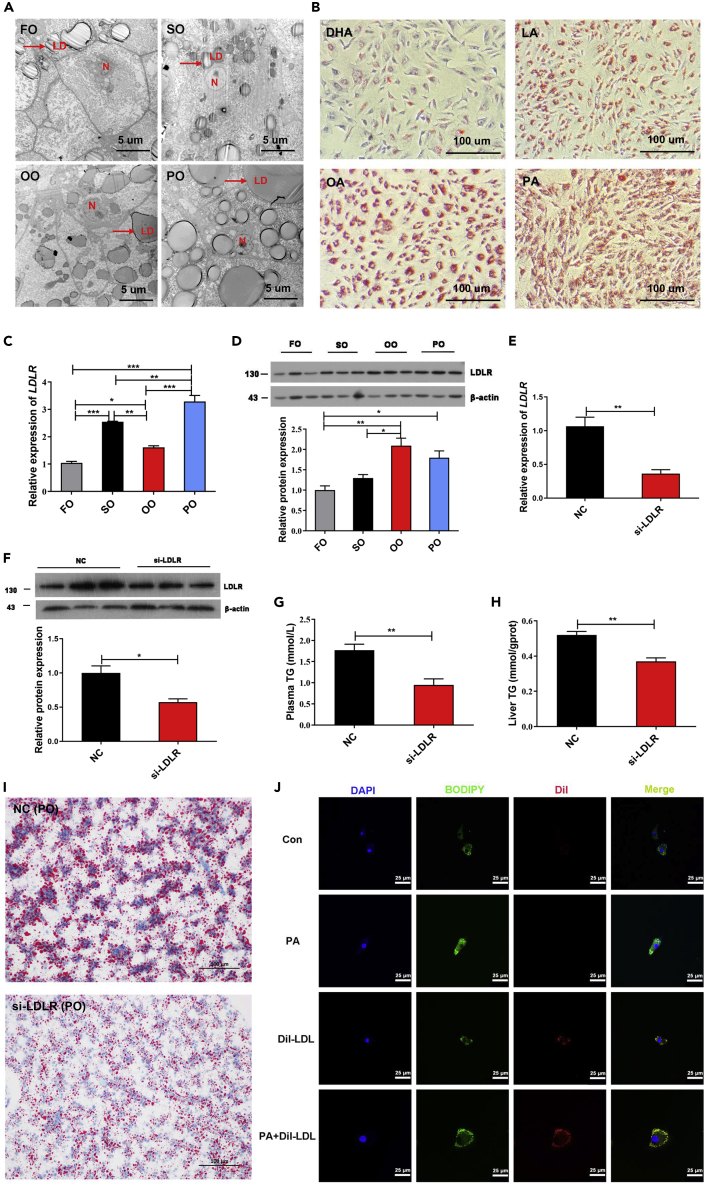
Figure 1 LDLR induced by PA promotes TG accumulation via the uptake of LDL (A) Lipid droplets in the liver were identified by transmission electron microscope (TEM) in fish fed with FO, SO, OO, and PO diets (Scale bars, 5 μm). The red arrow indicates lipid droplets. N, nucleus; LD, lipid droplets. (B) Lipid accumulation in fish hepatocytes was observed by Oil Red O staining after treatment with DHA, LA, OA, or PA for 12 h (Scale bars, 100 μm). (C and D) RT-qPCR and Western blot assays were used to evaluate the expressions of LDLR in the liver of fish fed with different diets. Data are presented as mean ± SEM, n = 3, one-way ANOVA, ∗p < 0.05, ∗∗p < 0.01, ∗∗∗p < 0.001. (E and F) RT-qPCR and Western blot assays were used to evaluate the expressions of LDLR in the liver of fish fed with PO diets after injection with control siRNA and si-LDLR for 48 h. Data are presented as mean ± SEM, n = 3, Student’s t-test, ∗p < 0.05, ∗∗p < 0.01. (G and H) Plasma and hepatic TG contents were tested in fish fed with PO diets after injection with control siRNA and si-LDLR for 48 h. Data are presented as mean ± SEM, n = 3, Student’s t-test, ∗∗p < 0.01. (I) Oil Red O staining was used to evaluate lipid accumulation in the liver from fish fed with PO diets after injection with control siRNA and si-LDLR for 48 h (Scale bars, 100 μm). (J) Fluorescent microscopy images were used to evaluate lipid droplets accumulation in fish hepatocytes treated with PA alone, Dil-LDL alone, or a combination of PA and Dil-LDL for 6 h (Scale bars, 25 μm). DAPI displays blue; BODIPY displays green; Dil-LDL displays red. FO, fish oil; SO, soybean oil; OO, olive oil, PO, palm oil; DHA, docosahexaenoic acid; LA, linoleic acid; OA, oleic acid; PA, palmitic acid. See also Figure S1.
Figure 1 LDLR induced by PA promotes TG accumulation via the uptake of LDL (A) Lipid droplets in the liver were identified by transmission electron microscope (TEM) in fish fed with FO, SO, OO, and PO diets (Scale bars, 5 μm). The red arrow indicates lipid droplets. N, nucleus; LD, lipid droplets. (B) Lipid accumulation in fish hepatocytes was observed by Oil Red O staining after treatment with DHA, LA, OA, or PA for 12 h (Scale bars, 100 μm). (C and D) RT-qPCR and Western blot assays were used to evaluate the expressions of LDLR in the liver of fish fed with different diets. Data are presented as mean ± SEM, n = 3, one-way ANOVA, ∗p < 0.05, ∗∗p < 0.01, ∗∗∗p < 0.001. (E and F) RT-qPCR and Western blot assays were used to evaluate the expressions of LDLR in the liver of fish fed with PO diets after injection with control siRNA and si-LDLR for 48 h. Data are presented as mean ± SEM, n = 3, Student’s t-test, ∗p < 0.05, ∗∗p < 0.01. (G and H) Plasma and hepatic TG contents were tested in fish fed with PO diets after injection with control siRNA and si-LDLR for 48 h. Data are presented as mean ± SEM, n = 3, Student’s t-test, ∗∗p < 0.01. (I) Oil Red O staining was used to evaluate lipid accumulation in the liver from fish fed with PO diets after injection with control siRNA and si-LDLR for 48 h (Scale bars, 100 μm). (J) Fluorescent microscopy images were used to evaluate lipid droplets accumulation in fish hepatocytes treated with PA alone, Dil-LDL alone, or a combination of PA and Dil-LDL for 6 h (Scale bars, 25 μm). DAPI displays blue; BODIPY displays green; Dil-LDL displays red. FO, fish oil; SO, soybean oil; OO, olive oil, PO, palm oil; DHA, docosahexaenoic acid; LA, linoleic acid; OA, oleic acid; PA, palmitic acid. See also Figure S1.CC BY-NC-ND · PubMed Central
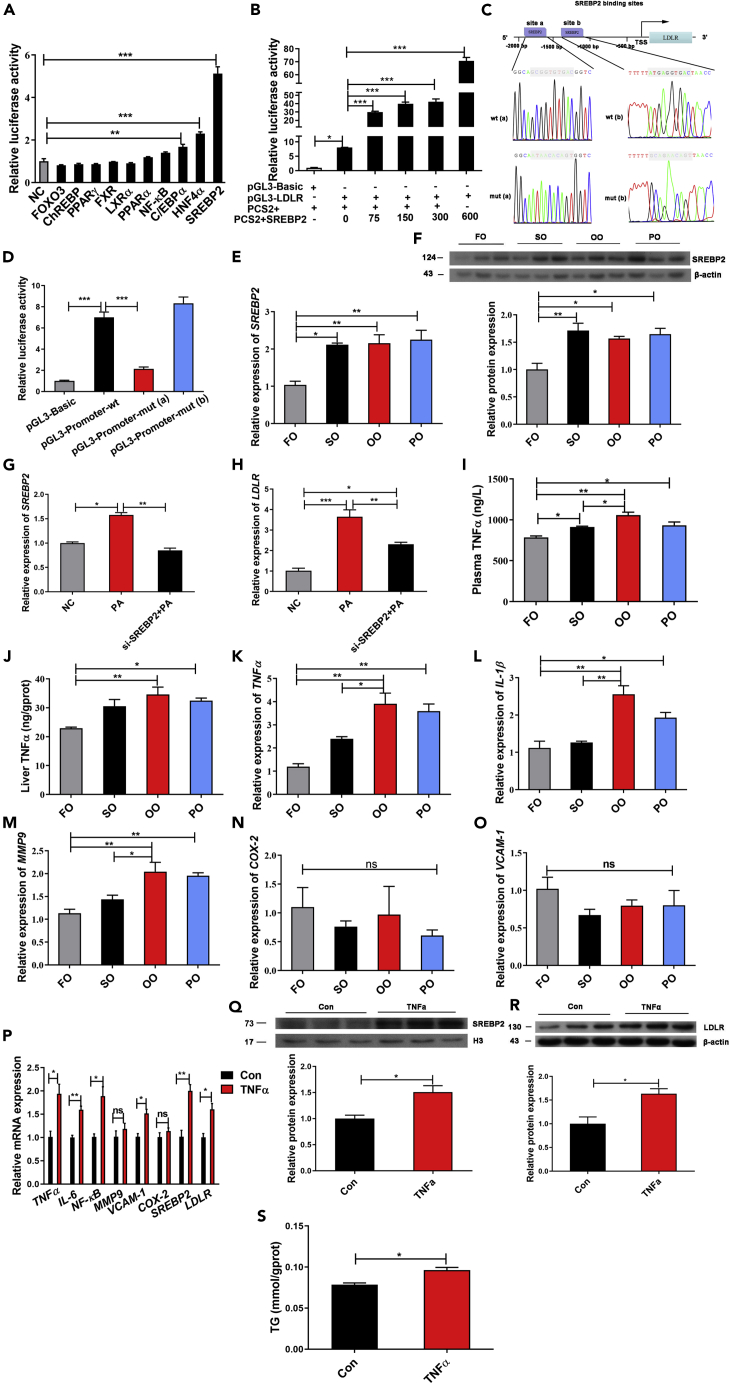
Figure 2 SREBP2 activated by TNFα increases the transcription of LDLR (A) LDLR promoter activity was analyzed by dual-luciferase reporter after co-transfection of LDLR promoter with PCS2+ vector or 10 transcription factors involved in lipid metabolism in HEK293T cells. Data are presented as mean ± SEM, n = 4, one-way ANOVA, ∗∗p < 0.01, ∗∗∗p < 0.001. (B) LDLR promoter activity was analyzed by dual-luciferase reporter after co-transfection of LDLR promoter with PCS2+ or PCS2+SREBP2 vectors in different doses (range: 0–600 ng/μL) in HEK293T cells. Data are presented as mean ± SEM, n = 3, one-way ANOVA, ∗p < 0.05, ∗∗∗p < 0.001. (C) The schematic diagram shows that two predicted SREBP2-binding sites (a and b) contained at LDLR promoter were mutated. (D) LDLR promoter activity was analyzed by dual-luciferase reporter after co-transfection of wt/mut LDLR promoters with PCS2+ or PCS2+SREBP2 vectors in HEK293T cells. Data are presented as mean ± SEM, n = 4, one-way ANOVA, ∗∗∗p < 0.001. (E and F) The expression levels of SREBP2 mRNA and protein were analyzed by RT-qPCR and Western blot in the liver of fish fed with FO, SO, OO, and PO diets. Data are presented as mean ± SEM, n = 3, one-way ANOVA, ∗p < 0.05, ∗∗p < 0.01. (G and H) SREBP2 and LDLR mRNA expressions were detected by RT-qPCR in fish hepatocytes interfered with control siRNA or si-SREBP2 for 24 h after treatment with PA for 12 h. Data are presented as mean ± SEM, n = 3, one-way ANOVA, ∗p < 0.05, ∗∗p < 0.01, ∗∗∗p < 0.001. (I and J) Plasma and liver TNFα contents were detected in fish fed with FO, SO, OO, and PO diets. Data are presented as mean ± SEM, n = 3, one-way ANOVA, ∗p < 0.05, ∗∗p < 0.01. (K–O) Genes (TNFα, IL-1β, MMP9, COX-2, and VCAM-1) involved in inflammatory response were analyzed by RT-qPCR in the liver of fish fed with FO, SO, OO, and PO diets. Data are presented as mean ± SEM, n = 3, one-way ANOVA, ∗p < 0.05, ∗∗p < 0.01, ns = not significant. (P) Genes (TNFα, IL-6, NF-κB, MMP9, VCAM-1, COX-2, SREBP2, and LDLR) were analyzed after fish hepatocytes were treated with TNFα for 24 h. Data are presented as mean ± SEM, n = 3, Student’s t-test, ∗p < 0.05, ∗∗p < 0.01, ns = not significant. (Q and R) Western blot analysis of SREBP2 in nucleus and LDLR protein expressions in fish hepatocytes treated with TNFα for 24 h. Data are presented as mean ± SEM, n = 3, Student’s t-test, ∗p < 0.05. (S) TG content in fish hepatocytes was analyzed after TNFα treatment for 24 h. Data are presented as mean ± SEM, n = 3, Student’s t-test, ∗p < 0.05. FO, fish oil; SO, soybean oil; OO, olive oil, PO, palm oil; PA, palmitic acid. See also Figure S2.
Figure 2 SREBP2 activated by TNFα increases the transcription of LDLR (A) LDLR promoter activity was analyzed by dual-luciferase reporter after co-transfection of LDLR promoter with PCS2+ vector or 10 transcription factors involved in lipid metabolism in HEK293T cells. Data are presented as mean ± SEM, n = 4, one-way ANOVA, ∗∗p < 0.01, ∗∗∗p < 0.001. (B) LDLR promoter activity was analyzed by dual-luciferase reporter after co-transfection of LDLR promoter with PCS2+ or PCS2+SREBP2 vectors in different doses (range: 0–600 ng/μL) in HEK293T cells. Data are presented as mean ± SEM, n = 3, one-way ANOVA, ∗p < 0.05, ∗∗∗p < 0.001. (C) The schematic diagram shows that two predicted SREBP2-binding sites (a and b) contained at LDLR promoter were mutated. (D) LDLR promoter activity was analyzed by dual-luciferase reporter after co-transfection of wt/mut LDLR promoters with PCS2+ or PCS2+SREBP2 vectors in HEK293T cells. Data are presented as mean ± SEM, n = 4, one-way ANOVA, ∗∗∗p < 0.001. (E and F) The expression levels of SREBP2 mRNA and protein were analyzed by RT-qPCR and Western blot in the liver of fish fed with FO, SO, OO, and PO diets. Data are presented as mean ± SEM, n = 3, one-way ANOVA, ∗p < 0.05, ∗∗p < 0.01. (G and H) SREBP2 and LDLR mRNA expressions were detected by RT-qPCR in fish hepatocytes interfered with control siRNA or si-SREBP2 for 24 h after treatment with PA for 12 h. Data are presented as mean ± SEM, n = 3, one-way ANOVA, ∗p < 0.05, ∗∗p < 0.01, ∗∗∗p < 0.001. (I and J) Plasma and liver TNFα contents were detected in fish fed with FO, SO, OO, and PO diets. Data are presented as mean ± SEM, n = 3, one-way ANOVA, ∗p < 0.05, ∗∗p < 0.01. (K–O) Genes (TNFα, IL-1β, MMP9, COX-2, and VCAM-1) involved in inflammatory response were analyzed by RT-qPCR in the liver of fish fed with FO, SO, OO, and PO diets. Data are presented as mean ± SEM, n = 3, one-way ANOVA, ∗p < 0.05, ∗∗p < 0.01, ns = not significant. (P) Genes (TNFα, IL-6, NF-κB, MMP9, VCAM-1, COX-2, SREBP2, and LDLR) were analyzed after fish hepatocytes were treated with TNFα for 24 h. Data are presented as mean ± SEM, n = 3, Student’s t-test, ∗p < 0.05, ∗∗p < 0.01, ns = not significant. (Q and R) Western blot analysis of SREBP2 in nucleus and LDLR protein expressions in fish hepatocytes treated with TNFα for 24 h. Data are presented as mean ± SEM, n = 3, Student’s t-test, ∗p < 0.05. (S) TG content in fish hepatocytes was analyzed after TNFα treatment for 24 h. Data are presented as mean ± SEM, n = 3, Student’s t-test, ∗p < 0.05. FO, fish oil; SO, soybean oil; OO, olive oil, PO, palm oil; PA, palmitic acid. See also Figure S2.CC BY-NC-ND · PubMed Central
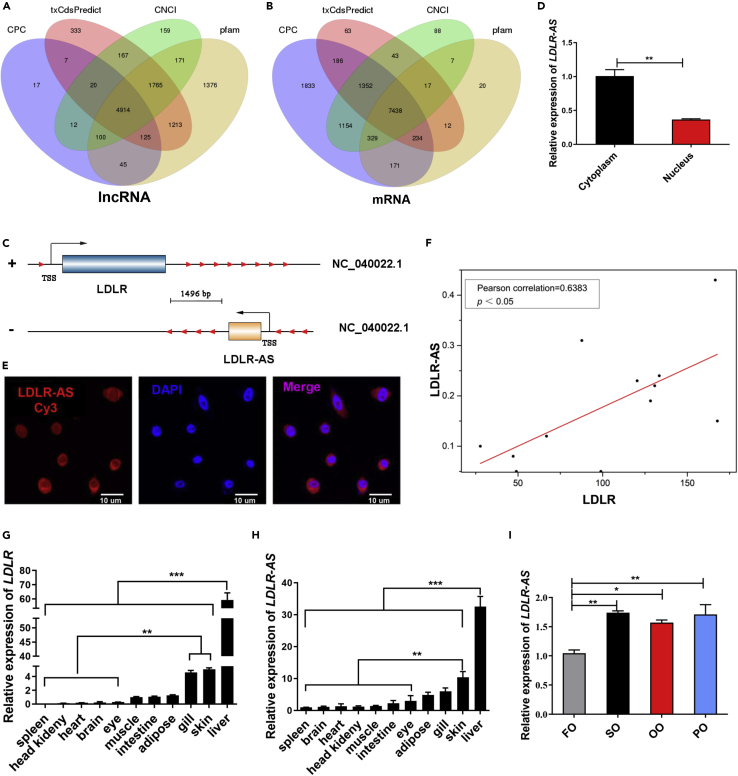
Figure 3 Screening and identification of lncRNA LDLR-AS associated with LDLR (A and B) Venn diagram was used for identifying novel lncRNAs and mRNAs expressed in the liver of fish fed with FO, SO, OO, and PO diets. (C) The schematic diagram of positional relationship between LDLR-AS and LDLR on the chromosome of large yellow croaker. “+” on the left side of strand represents the positive strand; “-” represents the negative strand. Red arrows indicate transcription direction, and two blocks with colors (light blue and yellow) represent the transcripts of LDLR and LDLR-AS, respectively. (D) The localization of LDLR-AS in fish hepatocytes was evaluated by nuclear/cytosolic fractionation, followed by RT-qPCR analysis. U6 and GAPDH were used as internal references of nuclear and cytoplasmic RNA, respectively. Data are presented as mean ± SEM, n = 3, Student’s t-test, ∗∗p < 0.01. (E) The subcellular distribution of Cy3-tagged LDLR-AS was visualized by RNA Fluorescent in situ hybridization (FISH) in fish hepatocytes (Scale bars, 10 μm). Nuclear were stained by DAPI. (F) Correlation between LDLR-AS and LDLR FPKM expression from transcriptome sequencing in the liver from fish fed with FO, SO, OO, and PO diets. The result was analyzed using Pearson correlation analysis (n = 12, Pearson correlation analysis, p < 0.05). (G and H) The tissue distribution of LDLR and LDLR-AS in large yellow croaker was analyzed by RT-qPCR. Data are presented as mean ± SEM, n = 3, one-way ANOVA, ∗∗p < 0.01, ∗∗∗p < 0.001. (I) RT-qPCR results of the expression of LDLR-AS in the liver of fish fed with FO, SO, OO, and PO diets. Data are presented as mean ± SEM, n = 3, one-way ANOVA, ∗p < 0.05, ∗∗p < 0.01. FO, fish oil; SO, soybean oil; OO, olive oil, PO, palm oil. See also Figure S3.
Figure 3 Screening and identification of lncRNA LDLR-AS associated with LDLR (A and B) Venn diagram was used for identifying novel lncRNAs and mRNAs expressed in the liver of fish fed with FO, SO, OO, and PO diets. (C) The schematic diagram of positional relationship between LDLR-AS and LDLR on the chromosome of large yellow croaker. “+” on the left side of strand represents the positive strand; “-” represents the negative strand. Red arrows indicate transcription direction, and two blocks with colors (light blue and yellow) represent the transcripts of LDLR and LDLR-AS, respectively. (D) The localization of LDLR-AS in fish hepatocytes was evaluated by nuclear/cytosolic fractionation, followed by RT-qPCR analysis. U6 and GAPDH were used as internal references of nuclear and cytoplasmic RNA, respectively. Data are presented as mean ± SEM, n = 3, Student’s t-test, ∗∗p < 0.01. (E) The subcellular distribution of Cy3-tagged LDLR-AS was visualized by RNA Fluorescent in situ hybridization (FISH) in fish hepatocytes (Scale bars, 10 μm). Nuclear were stained by DAPI. (F) Correlation between LDLR-AS and LDLR FPKM expression from transcriptome sequencing in the liver from fish fed with FO, SO, OO, and PO diets. The result was analyzed using Pearson correlation analysis (n = 12, Pearson correlation analysis, p < 0.05). (G and H) The tissue distribution of LDLR and LDLR-AS in large yellow croaker was analyzed by RT-qPCR. Data are presented as mean ± SEM, n = 3, one-way ANOVA, ∗∗p < 0.01, ∗∗∗p < 0.001. (I) RT-qPCR results of the expression of LDLR-AS in the liver of fish fed with FO, SO, OO, and PO diets. Data are presented as mean ± SEM, n = 3, one-way ANOVA, ∗p < 0.05, ∗∗p < 0.01. FO, fish oil; SO, soybean oil; OO, olive oil, PO, palm oil. See also Figure S3.CC BY-NC-ND · PubMed Central
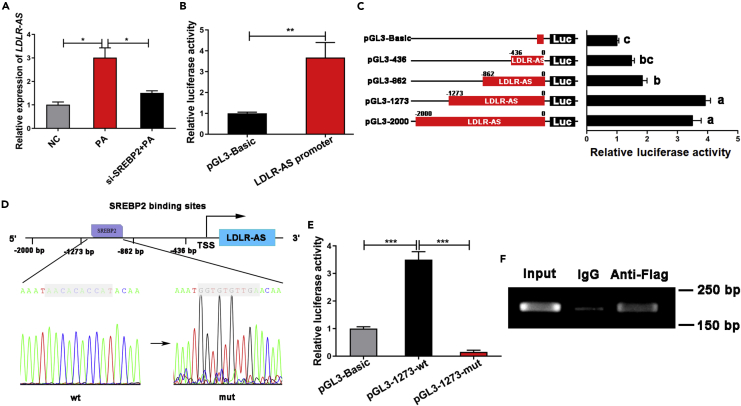
Figure 4 SREBP2 promotes the transcriptional level of LDLR-AS (A) LDLR-AS expression was detected by RT-qPCR in fish hepatocytes interfered with control siRNA or si-SREBP2 for 24 h after treatment with PA for 12 h. Data are presented as mean ± SEM, n = 3, one-way ANOVA, ∗p < 0.05. (B) LDLR-AS promoter activity was analyzed by dual-luciferase reporter after co-transfection of LDLR-AS promoter with PCS2+ or PCS2-SREBP2 vectors in HEK293T cells. Data are presented as mean ± SEM, n = 4, Student’s t-test, ∗∗p < 0.01. (C) LDLR-AS promoter activity was analyzed by dual-luciferase reporter after co-transfection of four truncated LDLR-AS promoters with PCS2+ or PCS2-SREBP2 vectors in HEK293T cells. Data are presented as mean ± SEM, n = 4, one-way ANOVA. (D) The schematic diagram shows that predicted SREBP2-binding site contained at −1273 ∼ −862 bp of LDLR-AS promoter was mutated. (E) The activities of wt/mut LDLR-AS promoter were analyzed by dual-luciferase reporter after co-transfection of wt/mut LDLR-AS promoters with PCS2+ or PCS2-SREBP2 vectors in HEK293T cells. Data are presented as mean ± SEM, n = 4, one-way ANOVA, ∗∗∗p < 0.001. (F) ChIP-PCR assay of SREBP2-binding region at −1273 ∼ - 862 bp from LDLR-AS promoter using IgG or Flag antibody.
Figure 4 SREBP2 promotes the transcriptional level of LDLR-AS (A) LDLR-AS expression was detected by RT-qPCR in fish hepatocytes interfered with control siRNA or si-SREBP2 for 24 h after treatment with PA for 12 h. Data are presented as mean ± SEM, n = 3, one-way ANOVA, ∗p < 0.05. (B) LDLR-AS promoter activity was analyzed by dual-luciferase reporter after co-transfection of LDLR-AS promoter with PCS2+ or PCS2-SREBP2 vectors in HEK293T cells. Data are presented as mean ± SEM, n = 4, Student’s t-test, ∗∗p < 0.01. (C) LDLR-AS promoter activity was analyzed by dual-luciferase reporter after co-transfection of four truncated LDLR-AS promoters with PCS2+ or PCS2-SREBP2 vectors in HEK293T cells. Data are presented as mean ± SEM, n = 4, one-way ANOVA. (D) The schematic diagram shows that predicted SREBP2-binding site contained at −1273 ∼ −862 bp of LDLR-AS promoter was mutated. (E) The activities of wt/mut LDLR-AS promoter were analyzed by dual-luciferase reporter after co-transfection of wt/mut LDLR-AS promoters with PCS2+ or PCS2-SREBP2 vectors in HEK293T cells. Data are presented as mean ± SEM, n = 4, one-way ANOVA, ∗∗∗p < 0.001. (F) ChIP-PCR assay of SREBP2-binding region at −1273 ∼ - 862 bp from LDLR-AS promoter using IgG or Flag antibody.CC BY-NC-ND · PubMed Central
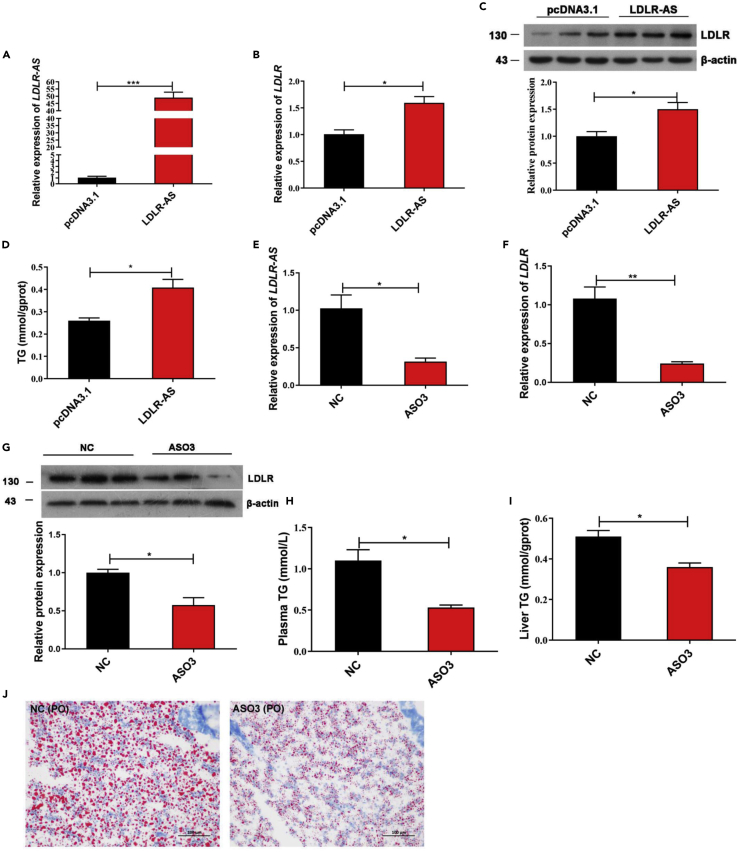
Figure 5 LDLR-AS affects hepatic triglyceride content by regulating LDLR expression (A) Overexpression of LDLR-AS was detected by RT-qPCR after pcDNA3.1 or pcDNA3.1-LDLR-AS plasmids were electroporated into fish hepatocytes for 48 h pcDNA3.1 plasmid was used as a negative control. Data are presented as mean ± SEM, n = 3, Student’s t-test, ∗∗∗p < 0.001. (B and C) RT-qPCR and Western blot assays were used to evaluate the expressions of LDLR in fish hepatocytes after LDLR-AS overexpression. Data are presented as mean ± SEM, n = 3, Student’s t-test, ∗p < 0.05. (D) TG content in fish hepatocytes was analyzed after LDLR-AS overexpression. Data are presented as mean ± SEM, n = 3, Student’s t-test, ∗p < 0.05. (E) LDLR-AS expression was knocked down in the PO diets group by injecting control siRNA (NC) or LDLR-AS ASO3 (ASO3). Data are presented as mean ± SEM, n = 3, Student’s t-test, ∗p < 0.05. (F and G) The expression levels of LDLR mRNA and protein were analyzed by RT-qPCR and Western blot after LDLR-AS knockdown. Data are presented as mean ± SEM, n = 3, Student’s t-test, ∗p < 0.05, ∗∗p < 0.01. (H and I) Plasma and liver TG levels were detected after LDLR-AS knockdown. Data are presented as mean ± SEM, n = 3, Student’s t-test, ∗p < 0.05. (J) Lipid accumulation in the liver was observed by Oil Red O staining after LDLR-AS knockdown (Scale bars, 100 μm). See also Figure S4.
Figure 5 LDLR-AS affects hepatic triglyceride content by regulating LDLR expression (A) Overexpression of LDLR-AS was detected by RT-qPCR after pcDNA3.1 or pcDNA3.1-LDLR-AS plasmids were electroporated into fish hepatocytes for 48 h pcDNA3.1 plasmid was used as a negative control. Data are presented as mean ± SEM, n = 3, Student’s t-test, ∗∗∗p < 0.001. (B and C) RT-qPCR and Western blot assays were used to evaluate the expressions of LDLR in fish hepatocytes after LDLR-AS overexpression. Data are presented as mean ± SEM, n = 3, Student’s t-test, ∗p < 0.05. (D) TG content in fish hepatocytes was analyzed after LDLR-AS overexpression. Data are presented as mean ± SEM, n = 3, Student’s t-test, ∗p < 0.05. (E) LDLR-AS expression was knocked down in the PO diets group by injecting control siRNA (NC) or LDLR-AS ASO3 (ASO3). Data are presented as mean ± SEM, n = 3, Student’s t-test, ∗p < 0.05. (F and G) The expression levels of LDLR mRNA and protein were analyzed by RT-qPCR and Western blot after LDLR-AS knockdown. Data are presented as mean ± SEM, n = 3, Student’s t-test, ∗p < 0.05, ∗∗p < 0.01. (H and I) Plasma and liver TG levels were detected after LDLR-AS knockdown. Data are presented as mean ± SEM, n = 3, Student’s t-test, ∗p < 0.05. (J) Lipid accumulation in the liver was observed by Oil Red O staining after LDLR-AS knockdown (Scale bars, 100 μm). See also Figure S4.CC BY-NC-ND · PubMed Central
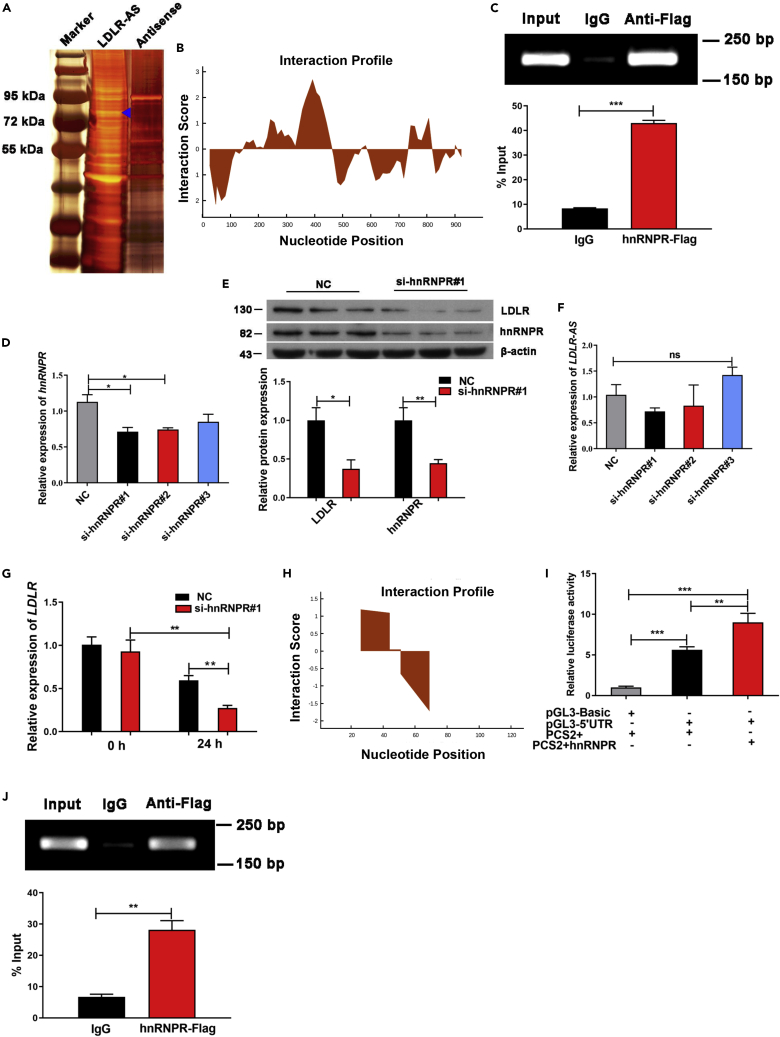
Figure 6 LDLR-AS interacts with hnRNPR to stabilize LDLR mRNA (A) Silver staining of proteins pulled down with biotinylated LDLR-AS RNA and a negative control with antisense sequences. Blue triangle denotes the band identified as hnRNPR by mass spectrometry. (B) Interaction profiles for LDLR-AS interaction with hnRNPR were predicted using the catRAPID website. (C) ChIP-qPCR assay was performed to measure the binding ability of hnRNPR to LDLR-AS. Data are presented as mean ± SEM, n = 3, Student’s t-test, ∗∗∗p < 0.001. (D) RT-qPCR results of hnRNPR knockdown in fish hepatocytes transfected with si-hnRNPR#1/2/3 for 24 h. Data are presented as mean ± SEM, n = 3, one-way ANOVA, ∗p < 0.05. (E) Western blot of LDLR and hnRNPR protein in fish hepatocytes transfected with si-hnRNPR#1 for 48 h. Data are presented as mean ± SEM, n = 3, one-way ANOVA, ∗p < 0.05, ∗∗p < 0.01. (F) RT-qPCR results of LDLR-AS expression in fish hepatocytes transfected with si-hnRNPR#1/2/3 for 24 h. Data are presented as mean ± SEM, n = 3, one-way ANOVA, ns = not significant. (G) RT-qPCR analysis was used to evaluate the stability of LDLR mRNA after fish hepatocytes were transfected with si-hnRNPR#1 for 24 h, then further exposed to 5 μg/mL actinomycin D for 24 h. Data are presented as mean ± SEM, n = 3, Student’s t-test, ∗∗p < 0.01. (H) Interaction profiles for LDLR at the 5′-UTR interaction with hnRNPR were predicted using the catRAPID website. (I) The luciferase activity of 5′-UTR of LDLR mRNA was detected in HEK293T cells transfected pGL3-Basic, pGL3-5′UTR, or PCS2+hnRNPR vectors. Data are presented as mean ± SEM, n = 3, one-way ANOVA, ∗∗p < 0.01, ∗∗∗p < 0.001. (J) ChIP-qPCR assay was performed to measure the binding ability of hnRNPR to the 5′-UTR of LDLR. Data are presented as mean ± SEM, n = 3, Student’s t-test, ∗∗p < 0.01.
Figure 6 LDLR-AS interacts with hnRNPR to stabilize LDLR mRNA (A) Silver staining of proteins pulled down with biotinylated LDLR-AS RNA and a negative control with antisense sequences. Blue triangle denotes the band identified as hnRNPR by mass spectrometry. (B) Interaction profiles for LDLR-AS interaction with hnRNPR were predicted using the catRAPID website. (C) ChIP-qPCR assay was performed to measure the binding ability of hnRNPR to LDLR-AS. Data are presented as mean ± SEM, n = 3, Student’s t-test, ∗∗∗p < 0.001. (D) RT-qPCR results of hnRNPR knockdown in fish hepatocytes transfected with si-hnRNPR#1/2/3 for 24 h. Data are presented as mean ± SEM, n = 3, one-way ANOVA, ∗p < 0.05. (E) Western blot of LDLR and hnRNPR protein in fish hepatocytes transfected with si-hnRNPR#1 for 48 h. Data are presented as mean ± SEM, n = 3, one-way ANOVA, ∗p < 0.05, ∗∗p < 0.01. (F) RT-qPCR results of LDLR-AS expression in fish hepatocytes transfected with si-hnRNPR#1/2/3 for 24 h. Data are presented as mean ± SEM, n = 3, one-way ANOVA, ns = not significant. (G) RT-qPCR analysis was used to evaluate the stability of LDLR mRNA after fish hepatocytes were transfected with si-hnRNPR#1 for 24 h, then further exposed to 5 μg/mL actinomycin D for 24 h. Data are presented as mean ± SEM, n = 3, Student’s t-test, ∗∗p < 0.01. (H) Interaction profiles for LDLR at the 5′-UTR interaction with hnRNPR were predicted using the catRAPID website. (I) The luciferase activity of 5′-UTR of LDLR mRNA was detected in HEK293T cells transfected pGL3-Basic, pGL3-5′UTR, or PCS2+hnRNPR vectors. Data are presented as mean ± SEM, n = 3, one-way ANOVA, ∗∗p < 0.01, ∗∗∗p < 0.001. (J) ChIP-qPCR assay was performed to measure the binding ability of hnRNPR to the 5′-UTR of LDLR. Data are presented as mean ± SEM, n = 3, Student’s t-test, ∗∗p < 0.01.CC BY-NC-ND · PubMed Central

Verification

Claims the paper makes

The claims and statistics of this paper haven’t been checked yet.

Run the check — free, no account needed. It reads the open-access text and checks the sources it cites.

A few free checks a day · papers already verified open instantly · results are public

Claims other papers make about this one

Each is checked against this paper’s own text: does it say what the citing paper says it does?

Self-check

Percentages, sums and reported differences re-computed from the paper’s own numbers.

The self-check needs the paper’s full text.

Citations

Cites

No references could be resolved yet.

Research works printed but not linked: 41

  1. Ananthanarayanan, 2016, A novel long noncoding RNA regulating cholesterol and bile acid homeostasis: a new kid on the block and a potential therapeutic target?, Hepatology, 64, 16, 10.1002/hep.28525 · DOI
  2. Barale, 2021, PCSK9 biology and its role in atherothrombosis, Int. J. Mol. Sci., 22, 5880, 10.3390/ijms22115880 · DOI
  3. Cao, 2018, The lncLocator: a subcellular localization predictor for long non-coding RNAs based on a stacked ensemble classifier, Bioinformatics, 34, 2185, 10.1093/bioinformatics/bty085 · DOI
  4. Carrieri, 2015, Progress and prospects of long noncoding RNAs in lipid homeostasis, Mol. Metab., 5, 164
  5. Chen, 2015, Progress and prospects of long noncoding RNAs in lipid homeostasis, Mol. Metab., 5, 164, 10.1016/j.molmet.2015.12.003 · DOI
  6. Chen, 2021, Acetyl-CoA derived from hepatic mitochondrial fatty acid β-oxidation aggravates inflammation by enhancing p65 acetylation, iScience, 24, 103244, 10.1016/j.isci.2021.103244 · DOI
  7. Du, 2020, Activation of the farnesoid X receptor (FXR) suppresses linoleic acid-induced inflammation in the large yellow croaker (Larimichthys crocea), J. Nutr., 150, 2469, 10.1093/jn/nxaa185 · DOI
  8. Dong, 2021, CARMN is an evolutionarily conserved smooth muscle cell-specific lncRNA that maintains contractile phenotype by binding myocardin, Circulation, 144, 1856, 10.1161/CIRCULATIONAHA.121.055949 · DOI
  9. Engelking, 2018, Developmental and extrahepatic physiological functions of SREBP pathway genes in mice, Semin. Cell Dev. Biol., 81, 98, 10.1016/j.semcdb.2017.07.011 · DOI
  10. Gu, 2019, A novel AR translational regulator lncRNA LBCS inhibits castration resistance of prostate cancer, Mol. Cancer, 18, 109, 10.1186/s12943-019-1037-8 · DOI
  11. Han, 2020, LncRNA ZFPM2-AS1 promotes lung adenocarcinoma progression by interacting with UPF1 to destabilize ZFPM2, Mol. Oncol., 14, 1074, 10.1002/1878-0261.12631 · DOI
  12. Higashi, 2022, Long noncoding RNAs transcribed downstream of the human β-globin locus regulate β-globin gene expression, J. Biochem., 171, 287, 10.1093/jb/mvab130 · DOI
  13. Hu, 2021, Salidroside activates the AMP-activated protein kinase pathway to suppress nonalcoholic steatohepatitis in mice, Hepatology, 74, 3056, 10.1002/hep.32066 · DOI
  14. Kusnadi, 2019, The cytokine TNF promotes transcription factor SREBP activity and binding to inflammatory genes to activate macrophages and limit tissue repair, Immunity, 51, 241, 10.1016/j.immuni.2019.06.005 · DOI · Paper page
  15. Kwon, 2021, hnRNP K supports the maintenance of RORγ circadian rhythm through ERK signaling, FASEB J., 35, e21507, 10.1096/fj.202002076R · DOI
  16. Lan, 2019, Long noncoding RNA lnc-HC regulates PPARγ-mediated hepatic lipid metabolism through miR-130b-3p, Nucleic Acids, 18, 954, 10.1016/j.omtn.2019.10.018 · DOI
  17. Lebeau, 2022, Caffeine blocks SREBP2-induced hepatic PCSK9 expression to enhance LDLR-mediated cholesterol clearance, Nat. Commun., 13, 770, 10.1038/s41467-022-28240-9 · DOI
  18. Li, 2009, Identification of mRNA binding proteins that regulate the stability of LDL receptor mRNA through AU-rich elements, J. Lipid Res., 50, 820, 10.1194/jlr.M800375-JLR200 · DOI · Paper page
  19. Li, 2015, A liver-enriched long non-coding RNA, lncLSTR, regulates systemic lipid metabolism in mice, Cell Metab., 21, 455, 10.1016/j.cmet.2015.02.004 · DOI
  20. Li, 2019, High level of dietary olive oil decreased growth, increased liver lipid deposition and induced inflammation by activating the p38 MAPK and JNK pathways in large yellow croaker (Larimichthys crocea), Fish Shellfish Immunol., 94, 157, 10.1016/j.fsi.2019.08.062 · DOI
  21. Li, 2019, High percentage of dietary palm oil suppressed growth and antioxidant capacity and induced the inflammation by activation of TLR-NF-κB signaling pathway in large yellow croaker (Larimichthys crocea), Fish Shellfish Immunol., 87, 600, 10.1016/j.fsi.2019.01.055 · DOI
  22. Li, 2022, Environmental adaptation in fish induced changes in the regulatory region of fatty acid elongase gene, elovl5, involved in long-chain polyunsaturated fatty acid biosynthesis, Int. J. Biol. Macromol., 204, 144, 10.1016/j.ijbiomac.2022.01.184 · DOI
  23. Liao, 2015, Dietary olive and perilla oils affect liver mitochondrial DNA methylation in large yellow croakers, J. Nutr., 145, 2479, 10.3945/jn.115.216481 · DOI
  24. Lin, 2021, Pterostilbene increases LDL metabolism in HL-1 cardiomyocytes by modulating the PCSK9/HNF1α/SREBP2/LDLR signaling cascade, upregulating epigenetic hsa-miR-335 and hsa-miR-6825, and LDL receptor expression, Antioxidants, 10, 1280, 10.3390/antiox10081280 · DOI
  25. Minahk, 2008, Conversion of low-density lipoprotein-associated phosphatidylcholine to triacylglycerol by primary hepatocytes, J. Biol. Chem., 283, 6449, 10.1074/jbc.M706995200 · DOI
  26. Munschauer, 2018, Nuclear lncRNA stabilization in the host response to bacterial infection, EMBO J., 37, e99875, 10.15252/embj.201899875 · DOI
  27. Muret, 2019, Long noncoding RNAs in lipid metabolism: literature review and conservation analysis across species, BMC Genomics, 20, 882, 10.1186/s12864-019-6093-3 · DOI
  28. Reches, 2016, HNRNPR regulates the expression of classical and nonclassical MHC class I proteins, J. Immunol., 196, 4967, 10.4049/jimmunol.1501550 · DOI
  29. Rothzerg, 2021, Upregulation of 15 antisense long non-coding RNAs in osteosarcoma, Genes, 12, 1132, 10.3390/genes12081132 · DOI
  30. Ryu, 2021, HNRNP A1 promotes lung cancer cell proliferation by modulating VRK1 translation, Int. J. Mol. Sci., 22, 5506, 10.3390/ijms22115506 · DOI
  31. Sun, 2018, Nuclear long noncoding RNAs: key regulators of gene expression, Trends Genet., 34, 142, 10.1016/j.tig.2017.11.005 · DOI
  32. Thibault, 2021, hnRNP A/B proteins: an encyclopedic assessment of their roles in homeostasis and disease, Biology (Basel)., 10, 712
  33. Tian, 2021, Histone methylatic modification mediates the tumor-suppressive activity of curcumol in hepatocellular carcinoma via an Hotair/EZH2 regulatory axis, J. Ethnopharmacol., 280, 114413, 10.1016/j.jep.2021.114413 · DOI
  34. Wang, 2020, The novel long noncoding RNA Lnc19959.2 modulates triglyceride metabolism-associated genes through the interaction with Purb and hnRNPA2B1, Mol. Metab., 37, 100996, 10.1016/j.molmet.2020.100996 · DOI
  35. Xia, 2021, Regulation of PCSK9 expression and function: mechanisms and therapeutic implications, Front. Cardiovasc. Med., 8, 764038, 10.3389/fcvm.2021.764038 · DOI · Paper page
  36. Xu, 2020, Are fish what they eat? A fatty acid's perspective, Prog. Lipid Res., 80, 101064, 10.1016/j.plipres.2020.101064 · DOI
  37. Yang, 2020, ω-6 Polyunsaturated fatty acids (linoleic acid) activate both autophagy and antioxidation in a synergistic feedback loop via TOR-dependent and TOR-independent signaling pathways, Cell Death Dis., 11, 607, 10.1038/s41419-020-02750-0 · DOI
  38. Yang, 2020, Cholesterol in LDL receptor recycling and degradation, Clin. Chim. Acta, 500, 81, 10.1016/j.cca.2019.09.022 · DOI · Paper page
  39. Yu, 2021, Inducible degrader of LDLR: a potential novel therapeutic target and emerging treatment for hyperlipidemia, Vascul. Pharmacol., 140, 106878, 10.1016/j.vph.2021.106878 · DOI
  40. Zelcer, 2009, LXR regulates cholesterol uptake through IDOL-dependent ubiquitination of the LDL receptor, Science, 325, 100, 10.1126/science.1168974 · DOI · Paper page
  41. Zhu, 2018, Influence of a dietary vegetable oil blend on serum lipid profiles in large yellow croaker (Larimichthys crocea), J. Agric. Food Chem., 66, 9097, 10.1021/acs.jafc.8b03382 · DOI

Cited by

Sorted by citations

Metadata

Authors
Cao, X., Fang, W., Li, X., Wang, X., Mai, K., & Ai, Q.
Venue
iScience
Publisher
Elsevier BV
Published
2022-07
Volume
25
Issue
7
Pages
104670
ISSN
2589-0042
Cited by
32
References
0
Language
en
Funders
  • National Natural Science Foundation of China (31830103)
  • China National Funds for Distinguished Young Scientists (31525024, CS31117200001)
  • Agriculture Research System of China (CARS47-11)

About these checks

Registry, retraction, Cites and statistics results are computed, not judged, with one exception: a printed reference that no index lists is read once by a model before it counts as a citation error. Claims are extracted by a model and kept only when their quote appears verbatim in the text; each cited source is then checked, with a model’s help, for whether it says what the claim relies on. Those verdicts can be wrong — read the claim’s quote and the cited source before relying on one.

Statistics and arithmetic are recomputed, not judged.

Confidence bands are shown only for fields calibrated on our annotated test set. None is calibrated yet, so no band is shown.

What counts as a claim ›How we measure confidence ›How we check this ›

Are you an author, or do you see a problem with this page? Request a review