Cited by 14Pluripotent Stem Cells ResearchEpigenetics and DNA MethylationDevelopmental Biology and Gene Regulation

The DOI matches its Crossref record; 3 of the 3 references it cites were found in a registry or an index.

The cytoplasmic fraction of the histone lysine methyltransferase Setdb1 is essential for embryonic stem cells

Open access
Rapone, Roberta, Del Maestro, Laurence, Bouyioukos, Costas, Albini, Sonia, Cruz-Tapias, Paola, Joliot, Véronique, Cosson, Bertrand, Ait-Si-Ali, Slimane·2023·iScience

Published version of a preprint

Abstract

Abstract Embryonic stem cells (ESCs) fate is regulated both at transcriptional and post-transcriptional levels. Indeed, several studies showed that, in addition to gene transcription, mRNA stability and protein synthesis are finely tuned and strongly control the ESCs pluripotency and fate changes. An increasing number of RNA-binding proteins (RBPs) involved in post-transcriptional and translational regulation of gene expression has been identified as regulators of ESC identity. The major lysine methyltransferase Setdb1 is essential for the self-renewal and viability of ESCs. Setdb1 was primarily known to methylate the lysine 9 of histone 3 (H3K9) in the nucleus, where it regulates chromatin functions. However, Setdb1 is also massively localized in the cytoplasm, including in mouse ESCs, where its role remains unknown. Here we show that the cytoplasmic Setdb1 (cSetdb1) is essential for the survival of mESCs. Functional assays further demonstrate that cSetdb1 regulates gene expression post-transcriptionally, affecting the abundance of mRNAs and the rate of newly synthetized proteins. A yeast-two-hybrid assay shows that cSetdb1 interacts with several regulators of mRNA stability and protein translation machinery, such as the ESCs-specific E3 ubiquitin ligase and mRNA silencer Trim71/Lin41. Finally, proteomic analyses reveal that cSetdb1 is required for the integrity of Trim71 complexes involved in mRNA metabolism and translation. Altogether, our data uncover the essential cytoplasmic function of a firstly supposed nuclear “histone” lysine methyltransferase, Setdb1, and provide new insights into the cytoplasmic/post-transcriptional regulation of gene expression mediated by a key epigenetic regulator.

Overview

The claims and statistics of this paper haven’t been checked yet.

Run the check — free, no account needed. It reads the open-access text and checks the sources it cites.

A few free checks a day · papers already verified open instantly · results are public

Integrity signals

Registry

Crossref · 10.1016/j.isci.2023.107386

Cites

3 of 3 references verified0 citation errors · 0 not checkable

Statistics

Figures

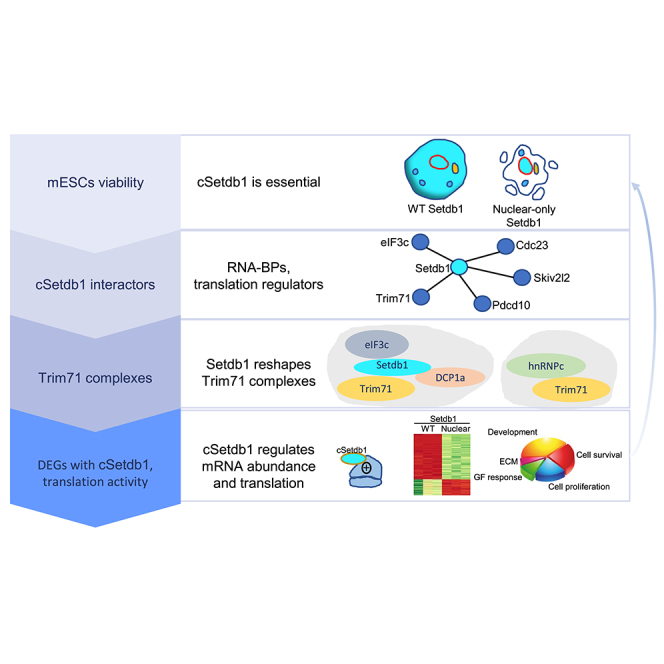
Graphical abstract
Graphical abstract CC BY-NC-ND · PubMed Central
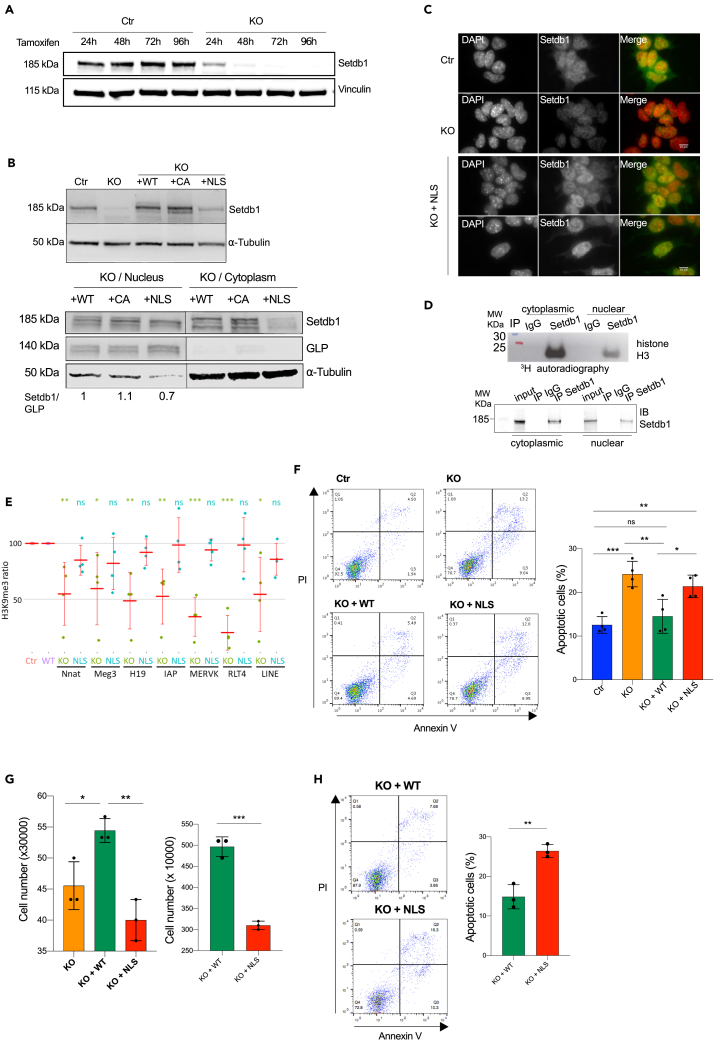
Figure 1 Cytoplasmic Setdb1 is essential for the survival of mESCs (A) Setdb1 protein level in total protein extracts from ES cells (genetically modified TT2 cells, inducible for an acute Setdb1 KO through Tamoxifen treatment). Setdb1 expression was analyzed in ES cells (Ctr) and Setdb1 KO ES cells after 24 h, 48 h, 72 h, and 96 h of Tamoxifen treatment. Vinculin is used as loading control. (B) Upper panel, Setdb1 expression was analyzed after 48-hour-Tamoxifen treatment in Setdb1 KO ES cells. Setdb1 inducible KO ES cells stably expressing wild-type Flag-Setdb1 (KO + WT), the enzymatically dead point mutant (KO + CA), or the nuclear-specific form of Flag-Setdb1 (KO + NLS), and in non-treated ES cells (Ctr). Vinculin or Tubulin is used as Western blot loading control. Lower panel, Setdb1 protein level obtained from nuclear/cytoplasmic fractionation. GLP is used as a nuclear extraction control; tubulin detection is used as a cytoplasmic extraction control. Setdb1 expression was analyzed in Ctr, KO, KO + WT, KO + CA, KO + NLS. (C) Immunofluorescence using anti-Setdb1 antibody, performed in Ctr, KO and KO + NLS ES cells. Green: Setdb1; red: DAPI. (D) In vitro radioactive methylation test using histone H3 within purified nucleosomes as substrate, radioactive S-Adenosyl Methionine (SAM) as methyl donor and immunoprecipitated Setdb1 from the cytoplasmic or nuclear fractions of mESCs. Upper panel, autoradiography; lower panel, Western blot. (E) H3K9me3 level was analyzed for Setdb1 gene targets by ChIP-qPCR in Ctr, KO, KO + WT and KO + NLS cells. For each gene, the methylation level was expressed as a percentage of the level in Ctr cells for KO cells, and to KO + WT cells for KO + NLS cells and therefore was set to 100% for Ctr and KO + WT cells. The values represent the mean ± SD of four independent experiments. Statistic test: unpaired t-test ∗p value <0.1; ∗∗p value <0.05; ∗∗∗p value <0.01; ns = not significant. (F) Annexin V FITC Assay to detect apoptotic cells (Annexin V+/PI- and Annexin V+/PI + cells) in Ctr, KO, KO + WT, KO + NLS ES cells (Setdb1 KO was obtained after 96 h of Tamoxifen treatment). FACS data: the quadrant on the lower left includes analyzed living cells (Annexin V-/PI-), the quadrant on the lower right includes cells in the early stage of apoptosis (Annexin V+/PI-), the quadrant on the upper right includes cells in the late stage of apoptosis (Annexin V+/PI+) and the quadrant on the upper left includes the cells in necrosis (Annexin V-/PI+). FACS data were quantified and represented as scatterplot with bars. N = 4. Statistic test: unpaired t-test ∗p value <0.05; ∗∗p value <0.01; ∗∗∗p value <0.001; ns = not significant. (G) Live cell number was determined in KO, KO + WT, KO + NLS (Setdb1 KO was obtained with Tamoxifen treatment for 96h (left panel) or 120h (right panel)), using Trypan Blue staining assay. N = 3. Statistic test: t-test ∗p value <0.05; ∗∗p value <0.01. (H) Left: Annexin V FITC Assay to detect apoptotic cells (Annexin V+/PI- and Annexin V+/PI + cells) in KO + WT, KO + NLS, after 5 days of Tamoxifen treatment. FACS data were quantified and represented as scatterplot with bars. N = 3. Statistic test: t-test ∗∗p value <0.01.
Figure 1 Cytoplasmic Setdb1 is essential for the survival of mESCs (A) Setdb1 protein level in total protein extracts from ES cells (genetically modified TT2 cells, inducible for an acute Setdb1 KO through Tamoxifen treatment). Setdb1 expression was analyzed in ES cells (Ctr) and Setdb1 KO ES cells after 24 h, 48 h, 72 h, and 96 h of Tamoxifen treatment. Vinculin is used as loading control. (B) Upper panel, Setdb1 expression was analyzed after 48-hour-Tamoxifen treatment in Setdb1 KO ES cells. Setdb1 inducible KO ES cells stably expressing wild-type Flag-Setdb1 (KO + WT), the enzymatically dead point mutant (KO + CA), or the nuclear-specific form of Flag-Setdb1 (KO + NLS), and in non-treated ES cells (Ctr). Vinculin or Tubulin is used as Western blot loading control. Lower panel, Setdb1 protein level obtained from nuclear/cytoplasmic fractionation. GLP is used as a nuclear extraction control; tubulin detection is used as a cytoplasmic extraction control. Setdb1 expression was analyzed in Ctr, KO, KO + WT, KO + CA, KO + NLS. (C) Immunofluorescence using anti-Setdb1 antibody, performed in Ctr, KO and KO + NLS ES cells. Green: Setdb1; red: DAPI. (D) In vitro radioactive methylation test using histone H3 within purified nucleosomes as substrate, radioactive S-Adenosyl Methionine (SAM) as methyl donor and immunoprecipitated Setdb1 from the cytoplasmic or nuclear fractions of mESCs. Upper panel, autoradiography; lower panel, Western blot. (E) H3K9me3 level was analyzed for Setdb1 gene targets by ChIP-qPCR in Ctr, KO, KO + WT and KO + NLS cells. For each gene, the methylation level was expressed as a percentage of the level in Ctr cells for KO cells, and to KO + WT cells for KO + NLS cells and therefore was set to 100% for Ctr and KO + WT cells. The values represent the mean ± SD of four independent experiments. Statistic test: unpaired t-test ∗p value <0.1; ∗∗p value <0.05; ∗∗∗p value <0.01; ns = not significant. (F) Annexin V FITC Assay to detect apoptotic cells (Annexin V+/PI- and Annexin V+/PI + cells) in Ctr, KO, KO + WT, KO + NLS ES cells (Setdb1 KO was obtained after 96 h of Tamoxifen treatment). FACS data: the quadrant on the lower left includes analyzed living cells (Annexin V-/PI-), the quadrant on the lower right includes cells in the early stage of apoptosis (Annexin V+/PI-), the quadrant on the upper right includes cells in the late stage of apoptosis (Annexin V+/PI+) and the quadrant on the upper left includes the cells in necrosis (Annexin V-/PI+). FACS data were quantified and represented as scatterplot with bars. N = 4. Statistic test: unpaired t-test ∗p value <0.05; ∗∗p value <0.01; ∗∗∗p value <0.001; ns = not significant. (G) Live cell number was determined in KO, KO + WT, KO + NLS (Setdb1 KO was obtained with Tamoxifen treatment for 96h (left panel) or 120h (right panel)), using Trypan Blue staining assay. N = 3. Statistic test: t-test ∗p value <0.05; ∗∗p value <0.01. (H) Left: Annexin V FITC Assay to detect apoptotic cells (Annexin V+/PI- and Annexin V+/PI + cells) in KO + WT, KO + NLS, after 5 days of Tamoxifen treatment. FACS data were quantified and represented as scatterplot with bars. N = 3. Statistic test: t-test ∗∗p value <0.01.CC BY-NC-ND · PubMed Central
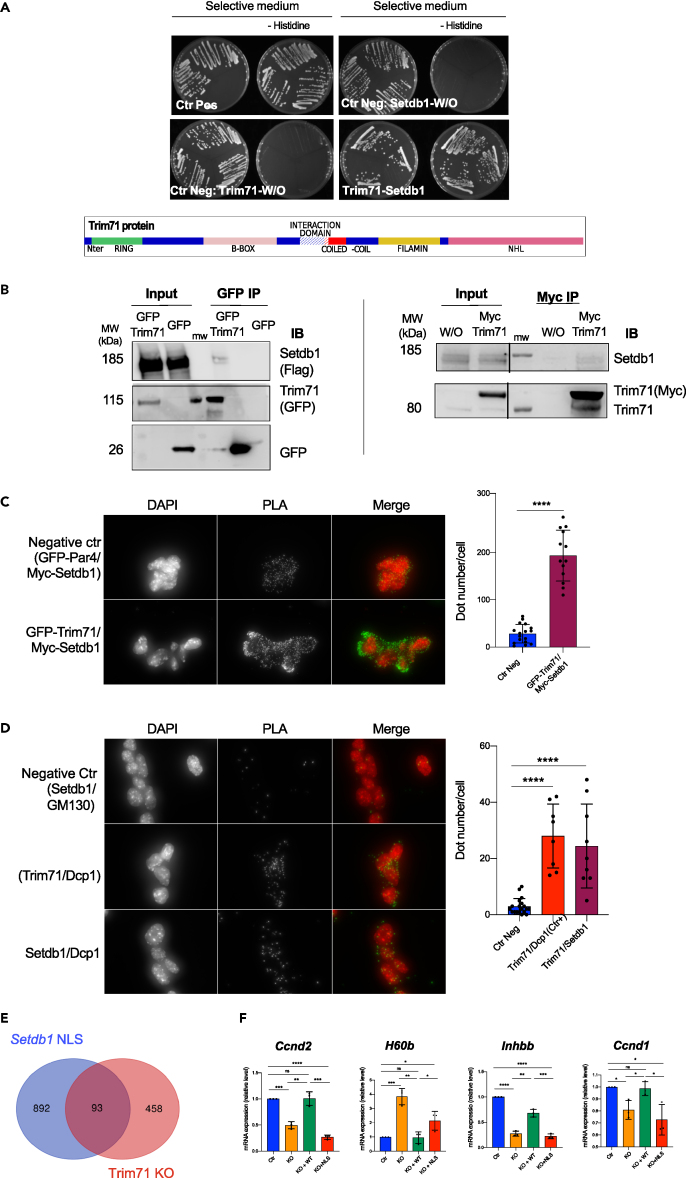
Figure 2 Cytoplasmic Setdb1 interacts with Trim71, a mESC-specific regulator of gene expression (A) Top panel: Directed Yeast-two-hybrid test showing the interaction between Setdb1 and Trim71. Bottom panel: representation of the Trim71 major domains and the domain which mediates the interaction between Trim71 and Setdb1 (hatched white, aa 358–397). (B) Co-Immunoprecipitation assay performed from the cytoplasmic fraction of ES cells stably expressing flagged WT-Setdb1 and transiently expressing GFP-Trim71 (on the left) or Myc-Trim71 (on the right). Trim71 was detected with anti-GFP (on the left) or anti-Myc or anti-Trim71 (on the right) antibodies and the co-immunoprecipitated Setdb1 was detected with anti-Flag (on the left) or anti-Setdb1 (on the right) antibodies. The plasmid expressing GFP (on the left) or the empty plasmid (on the right, W/O) were used as negative controls. MW: molecular weight marker. (C) In situ proximity ligation assay using anti-Myc and anti-GFP antibodies, performed in ES cells transiently expressing Myc-Setdb1 and GFP-Trim71. ES cells transiently expressing Myc-Setdb1 and GFP-Par4 were used as negative control. Green: PLA signal. Red: DAPI. PLA signals were quantified (number of spots) and represented as scatterplot with bars. ∗∗∗∗p value <0.0001. (D) In situ proximity ligation assay using anti-Setdb1 and anti-Dcp1a performed in ES cells. Anti-GM130 was used as negative control Green: PLA signal. Red: DAPI. PLA signals were quantified (number of spots) and represented as scatterplot with bars. ∗∗∗∗p value <0.0001. (E) Venn diagram showing the numbers and the significant overlap (p value < 0.0001) of RNAs that are differentially abundant between KO + WT and KO + NLS (differentially expressed genes (DEGs) were selected for a logFC ≥ 1 and p value< 0.01) and differentially regulated genes after Trim71-KO.27 (F) RT-qPCR for endogenous Ccnd2, H60b, Inhbb, Ccnd1 mRNAs performed in Ctr, KO, KO + WT, KO + NLS to validate RNAseq results. N = 3. Statistic test: t-test ∗p value <0.05; ∗∗p value <0.01; ∗∗∗p value <0.001; ∗∗∗∗p value <0.0001; ns = not significant.
Figure 2 Cytoplasmic Setdb1 interacts with Trim71, a mESC-specific regulator of gene expression (A) Top panel: Directed Yeast-two-hybrid test showing the interaction between Setdb1 and Trim71. Bottom panel: representation of the Trim71 major domains and the domain which mediates the interaction between Trim71 and Setdb1 (hatched white, aa 358–397). (B) Co-Immunoprecipitation assay performed from the cytoplasmic fraction of ES cells stably expressing flagged WT-Setdb1 and transiently expressing GFP-Trim71 (on the left) or Myc-Trim71 (on the right). Trim71 was detected with anti-GFP (on the left) or anti-Myc or anti-Trim71 (on the right) antibodies and the co-immunoprecipitated Setdb1 was detected with anti-Flag (on the left) or anti-Setdb1 (on the right) antibodies. The plasmid expressing GFP (on the left) or the empty plasmid (on the right, W/O) were used as negative controls. MW: molecular weight marker. (C) In situ proximity ligation assay using anti-Myc and anti-GFP antibodies, performed in ES cells transiently expressing Myc-Setdb1 and GFP-Trim71. ES cells transiently expressing Myc-Setdb1 and GFP-Par4 were used as negative control. Green: PLA signal. Red: DAPI. PLA signals were quantified (number of spots) and represented as scatterplot with bars. ∗∗∗∗p value <0.0001. (D) In situ proximity ligation assay using anti-Setdb1 and anti-Dcp1a performed in ES cells. Anti-GM130 was used as negative control Green: PLA signal. Red: DAPI. PLA signals were quantified (number of spots) and represented as scatterplot with bars. ∗∗∗∗p value <0.0001. (E) Venn diagram showing the numbers and the significant overlap (p value < 0.0001) of RNAs that are differentially abundant between KO + WT and KO + NLS (differentially expressed genes (DEGs) were selected for a logFC ≥ 1 and p value< 0.01) and differentially regulated genes after Trim71-KO.27 (F) RT-qPCR for endogenous Ccnd2, H60b, Inhbb, Ccnd1 mRNAs performed in Ctr, KO, KO + WT, KO + NLS to validate RNAseq results. N = 3. Statistic test: t-test ∗p value <0.05; ∗∗p value <0.01; ∗∗∗p value <0.001; ∗∗∗∗p value <0.0001; ns = not significant.CC BY-NC-ND · PubMed Central
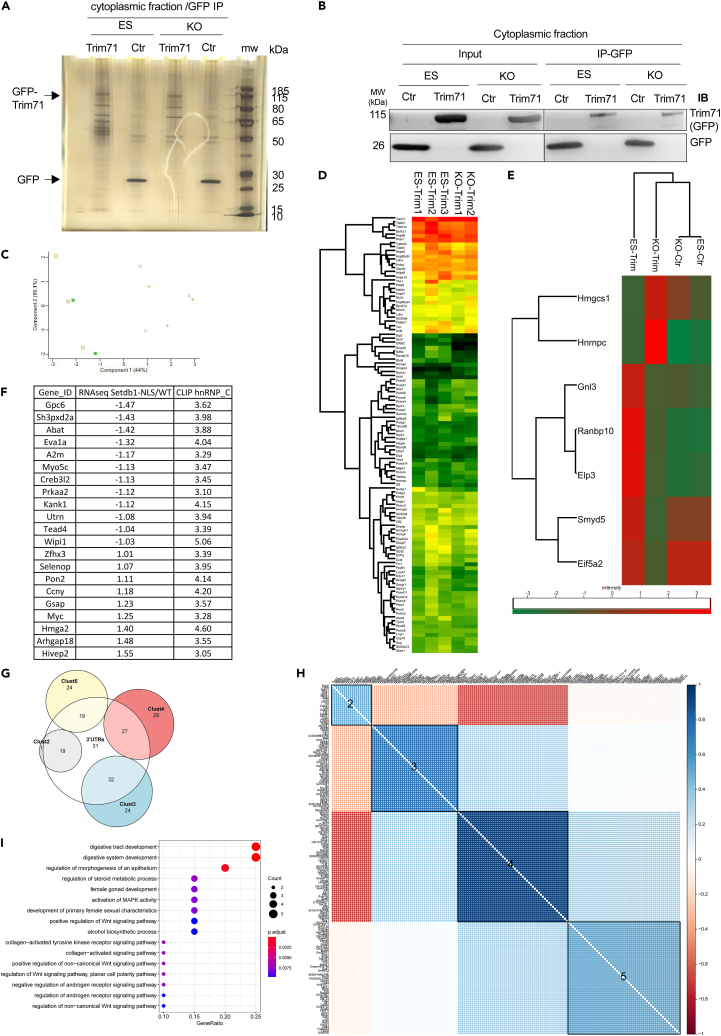
Figure 3 Integrity of Trim71 complex(es), involved in mRNA stability and translation, is affected in the absence of Setdb1 (A and B) GFP-Trim71 (Trim71) was immunoprecipitated from the cytoplasmic fractions of control or Setdb1 KO ES cells. GFP (Ctr) was used as a control of the immunoprecipitation. (A) Silver staining to detect proteins of immunoprecipitated proteins. (B) The amount of immunoprecipitated proteins Trim71 and GFP in ES or KO cells was checked by western blot. (C) PCA analysis. ES-Ctr (orange cross), KO-Ctr (green diagonal cross), ES-Trim71 (orange square), KO-Trim71 (green filled square). (D) Differential analysis (multiple sample test ANOVA) after quantification of almost 800 proteins of which 108 are differentially enriched at FDR <0.1 level. Heatmap after clustering of these significant proteins with the sum of their intensities. (E) Heatmap after clustering of the significant proteins with the score obtained by the Tukey’s honestly significant difference with an FDR <0.05 (THSD, B). (F) List of gene names of the mRNAs that are differentially expressed in KO + WT and found associated to hnRNP-c by eCLIP, see text for details. Number refers to LogFC. (G) Clustered correlation plot of the 291 differentially abundant mRNAs reveals 4 distinct co-expressed modules. Soft-thresholded correlation matrix of the 291 DEG TPMs clustered by hierarchical clustering and the Ward D2 linkage identifies the structure of 5 modules (the 5th module containing the rest 117 DEGs with relatively low correlation, was excluded from the figure). Each module represents a set of co-expressed genes which might also be co-regulated. (H) Venn diagram showing the clusters of the 157 mRNAs differentially abundant in absence of cSetdb1 function and the mRNAs whose 3′UTR are potential binding site of hnRNP-C (white circle). (I) GO enrichment DotPlot of the second co-expressed module (Cluster 2) of the correlation plot of panel H. Enrichment identifies GO categories related to MAPK activation and WNT signaling. Again (like in Figure 4) categories are sorted according to GeneRatios and color and size correspond to the corrected p value and the gene count for each category.
Figure 3 Integrity of Trim71 complex(es), involved in mRNA stability and translation, is affected in the absence of Setdb1 (A and B) GFP-Trim71 (Trim71) was immunoprecipitated from the cytoplasmic fractions of control or Setdb1 KO ES cells. GFP (Ctr) was used as a control of the immunoprecipitation. (A) Silver staining to detect proteins of immunoprecipitated proteins. (B) The amount of immunoprecipitated proteins Trim71 and GFP in ES or KO cells was checked by western blot. (C) PCA analysis. ES-Ctr (orange cross), KO-Ctr (green diagonal cross), ES-Trim71 (orange square), KO-Trim71 (green filled square). (D) Differential analysis (multiple sample test ANOVA) after quantification of almost 800 proteins of which 108 are differentially enriched at FDR <0.1 level. Heatmap after clustering of these significant proteins with the sum of their intensities. (E) Heatmap after clustering of the significant proteins with the score obtained by the Tukey’s honestly significant difference with an FDR <0.05 (THSD, B). (F) List of gene names of the mRNAs that are differentially expressed in KO + WT and found associated to hnRNP-c by eCLIP, see text for details. Number refers to LogFC. (G) Clustered correlation plot of the 291 differentially abundant mRNAs reveals 4 distinct co-expressed modules. Soft-thresholded correlation matrix of the 291 DEG TPMs clustered by hierarchical clustering and the Ward D2 linkage identifies the structure of 5 modules (the 5th module containing the rest 117 DEGs with relatively low correlation, was excluded from the figure). Each module represents a set of co-expressed genes which might also be co-regulated. (H) Venn diagram showing the clusters of the 157 mRNAs differentially abundant in absence of cSetdb1 function and the mRNAs whose 3′UTR are potential binding site of hnRNP-C (white circle). (I) GO enrichment DotPlot of the second co-expressed module (Cluster 2) of the correlation plot of panel H. Enrichment identifies GO categories related to MAPK activation and WNT signaling. Again (like in Figure 4) categories are sorted according to GeneRatios and color and size correspond to the corrected p value and the gene count for each category.CC BY-NC-ND · PubMed Central
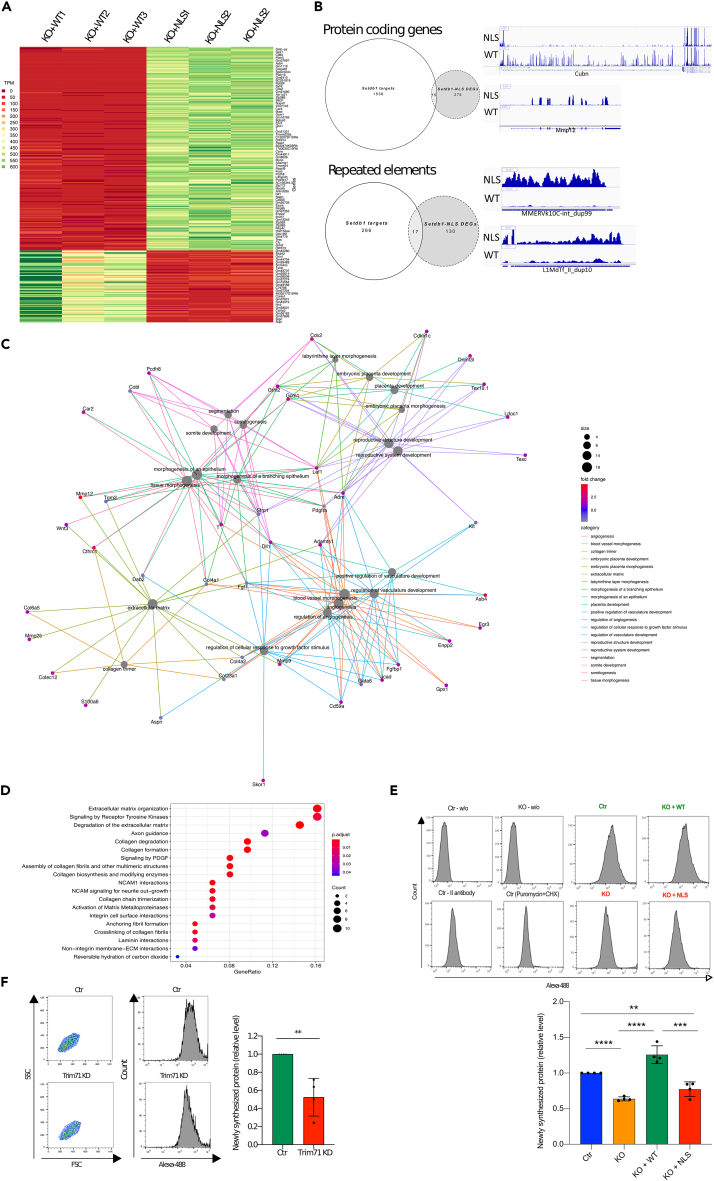
Figure 4 Cytoplasmic Setdb1 regulates the abundance of mRNAs and newly synthesized proteins (A) K-means clustering (k = 2) of the normalized transcripts per million (TPM) of all the 291 differentially expressed genes (DEGs). DEGs were selected for a logFC ≥ 1.5 and p value < 0.01. On the plot their expression levels in the three KO + WT and the three KO + NLS samples are highlighted, with red highlighting low and green highlighting high expression level. The two groups of DEGs are clearly separated and these two are the only two robust clusters obtained by k-means clustering. (B) The differentially regulated genes in Setdb1-NLS do not overlap with the Setdb1-bound genes in the mESCs. Setdb1 direct target genes from the ChIP-Seq data (purple circle) of a landmark publication (6; Table S4) were intersected with the 291 DEGs from coding genes we found from our Setdb1-NLS RNA-Seq data (green circle). The same was done for transcripts from repeated elements (blue and red circles). The overlap of these two sets was not significant (only 15 and 17 genes respectively for coding genes and repetitive elements, expected number >20, p value >0.1). Right panels: genome browser (IGV) screenshots of some differentially regulated RNAs, either from coding genes (upper part) or repeated elements (lower part). (C) Category Network plot (cnetplot) of the top 20 enriched terms from the gene ontology biological processes. Cnetplots represent relationships between biological concepts (here GO Biological Processes) and the genes contained in them. Each different concept link is highlighted with different colors. The size of circles corresponds to the concept enrichment and the green-red gradient for each gene represents its log fold change. (D) DEGs pathway enrichment. DotPlot diagram for pathway enrichment of differentially expressed genes in KO + NLS compared to KO + WT (Fold change >1.5, p value <0.01). Pathways are sorted according to the ratio of the number of DGEs found in each pathway over the number of genes in such pathway (GeneRatio horizontal axis). The color of each circle corresponds to the -corrected for multiple testing-p value of the enrichment test and the size of each circle is equivalent to the number of DEGs found in each pathway. (E) SUnSET experiment performed in Ctr, KO, KO + WT and KO + NLS. Setdb1 KO condition correspond to 48 h of Tamoxifen treatment. Cells were treated with 1 μg/mL Puromycin for 20 min, then analyzed by FACS after the addition of anti-puromycin antibody and a fluorescent secondary antibody. Several experimental controls were used: cells without any treatment and any antibodies labeling (Ctr-w/o; KO-w/o), cells labeled only with the secondary antibody in order to detect the experiment background (Ctr - II antibody); cells treated with both Puromycin and Cycloheximide, a translation inhibitor (Ctr (Puromycin + CHX)) as negative control. FACS data were quantified (using the median values) and represented as scatterplot with bars. N = 4. Statistic test: t-test ∗p value <0.05; ∗∗p value <0.01; ∗∗∗p value <0.001; ns: not significant. (F) SUnSET experiment performed as in E in Ctr and Trim71 KD cells. Trim71 KD was obtained after 72 h of siRNA treatment. N = 4. Statistic test: t-test ∗∗p value <0.01.
Figure 4 Cytoplasmic Setdb1 regulates the abundance of mRNAs and newly synthesized proteins (A) K-means clustering (k = 2) of the normalized transcripts per million (TPM) of all the 291 differentially expressed genes (DEGs). DEGs were selected for a logFC ≥ 1.5 and p value < 0.01. On the plot their expression levels in the three KO + WT and the three KO + NLS samples are highlighted, with red highlighting low and green highlighting high expression level. The two groups of DEGs are clearly separated and these two are the only two robust clusters obtained by k-means clustering. (B) The differentially regulated genes in Setdb1-NLS do not overlap with the Setdb1-bound genes in the mESCs. Setdb1 direct target genes from the ChIP-Seq data (purple circle) of a landmark publication (6; Table S4) were intersected with the 291 DEGs from coding genes we found from our Setdb1-NLS RNA-Seq data (green circle). The same was done for transcripts from repeated elements (blue and red circles). The overlap of these two sets was not significant (only 15 and 17 genes respectively for coding genes and repetitive elements, expected number >20, p value >0.1). Right panels: genome browser (IGV) screenshots of some differentially regulated RNAs, either from coding genes (upper part) or repeated elements (lower part). (C) Category Network plot (cnetplot) of the top 20 enriched terms from the gene ontology biological processes. Cnetplots represent relationships between biological concepts (here GO Biological Processes) and the genes contained in them. Each different concept link is highlighted with different colors. The size of circles corresponds to the concept enrichment and the green-red gradient for each gene represents its log fold change. (D) DEGs pathway enrichment. DotPlot diagram for pathway enrichment of differentially expressed genes in KO + NLS compared to KO + WT (Fold change >1.5, p value <0.01). Pathways are sorted according to the ratio of the number of DGEs found in each pathway over the number of genes in such pathway (GeneRatio horizontal axis). The color of each circle corresponds to the -corrected for multiple testing-p value of the enrichment test and the size of each circle is equivalent to the number of DEGs found in each pathway. (E) SUnSET experiment performed in Ctr, KO, KO + WT and KO + NLS. Setdb1 KO condition correspond to 48 h of Tamoxifen treatment. Cells were treated with 1 μg/mL Puromycin for 20 min, then analyzed by FACS after the addition of anti-puromycin antibody and a fluorescent secondary antibody. Several experimental controls were used: cells without any treatment and any antibodies labeling (Ctr-w/o; KO-w/o), cells labeled only with the secondary antibody in order to detect the experiment background (Ctr - II antibody); cells treated with both Puromycin and Cycloheximide, a translation inhibitor (Ctr (Puromycin + CHX)) as negative control. FACS data were quantified (using the median values) and represented as scatterplot with bars. N = 4. Statistic test: t-test ∗p value <0.05; ∗∗p value <0.01; ∗∗∗p value <0.001; ns: not significant. (F) SUnSET experiment performed as in E in Ctr and Trim71 KD cells. Trim71 KD was obtained after 72 h of siRNA treatment. N = 4. Statistic test: t-test ∗∗p value <0.01.CC BY-NC-ND · PubMed Central

Verification

Claims the paper makes

The claims and statistics of this paper haven’t been checked yet.

Run the check — free, no account needed. It reads the open-access text and checks the sources it cites.

A few free checks a day · papers already verified open instantly · results are public

Self-check

Percentages, sums and reported differences re-computed from the paper’s own numbers.

The self-check needs the paper’s full text.

Citations

Cites

Research works printed but not linked: 50

  1. Gabut, 2020, Ribosome and Translational Control in Stem Cells, Cells, 9, 10.3390/cells9020497 · DOI
  2. Kwon, 2013, The RNA-binding protein repertoire of embryonic stem cells, Nat. Struct. Mol. Biol., 20, 1122, 10.1038/nsmb.2638 · DOI
  3. Ye, 2014, Regulation of pluripotency by RNA binding proteins, Cell Stem Cell, 15, 271, 10.1016/j.stem.2014.08.010 · DOI
  4. You, 2015, Role of the small subunit processome in the maintenance of pluripotent stem cells, Genes Dev., 29, 2004, 10.1101/gad.267112.115 · DOI
  5. Dodge, 2004, Histone H3-K9 methyltransferase ESET is essential for early development, Mol. Cell Biol., 24, 2478, 10.1128/MCB.24.6.2478-2486.2004 · DOI
  6. Bilodeau, 2009, SetDB1 contributes to repression of genes encoding developmental regulators and maintenance of ES cell state, Genes Dev., 23, 2484, 10.1101/gad.1837309 · DOI
  7. Lohmann, 2010, KMT1E mediated H3K9 methylation is required for the maintenance of embryonic stem cells by repressing trophectoderm differentiation, Stem Cell., 28, 201, 10.1002/stem.278 · DOI
  8. Yeap, 2009, ERG-associated protein with SET domain (ESET)-Oct4 interaction regulates pluripotency and represses the trophectoderm lineage, Epigenet. Chromatin, 2, 12, 10.1186/1756-8935-2-12 · DOI
  9. An, 2014, The histone methyltransferase ESET is required for the survival of spermatogonial stem/progenitor cells in mice, Cell Death Dis., 5, 10.1038/cddis.2014.171 · DOI
  10. Lawson, 2013, Mesenchyme-specific knockout of ESET histone methyltransferase causes ectopic hypertrophy and terminal differentiation of articular chondrocytes, J. Biol. Chem., 288, 32119, 10.1074/jbc.M113.473827 · DOI
  11. Tan, 2012, Essential roles of the histone methyltransferase ESET in the epigenetic control of neural progenitor cells during development, Development, 139, 3806, 10.1242/dev.082198 · DOI
  12. Lawson, 2013, ESET histone methyltransferase regulates osteoblastic differentiation of mesenchymal stem cells during postnatal bone development, FEBS Lett., 587, 3961, 10.1016/j.febslet.2013.10.028 · DOI
  13. Beyer, 2016, Canonical Wnt signalling regulates nuclear export of Setdb1 during skeletal muscle terminal differentiation, Cell Discov., 2
  14. Yang, 2013, ESET histone methyltransferase is essential to hypertrophic differentiation of growth plate chondrocytes and formation of epiphyseal plates, Dev. Biol., 380, 99, 10.1016/j.ydbio.2013.04.031 · DOI
  15. Loyola, 2006, PTMs on H3 variants before chromatin assembly potentiate their final epigenetic state, Mol. Cell., 24, 309, 10.1016/j.molcel.2006.08.019 · DOI
  16. Lin, 2023, Binary Colloidal Crystals Promote Cardiac Differentiation of Human Pluripotent Stem Cells via Nuclear Accumulation of SETDB1, ACS Nano, 17, 3181, 10.1021/acsnano.3c00009 · DOI
  17. Cho, 2013, Regulated nuclear entry of over-expressed Setdb1, Gene Cell., 18, 694, 10.1111/gtc.12068 · DOI
  18. Matsui, 2010, Proviral silencing in embryonic stem cells requires the histone methyltransferase ESET, Nature, 464, 927, 10.1038/nature08858 · DOI
  19. Fisher, 2017, An efficient method for generation of bi-allelic null mutant mouse embryonic stem cells and its application for investigating epigenetic modifiers, Nucleic Acids Res., 45, e174, 10.1093/nar/gkx811 · DOI
  20. Thompson, 2015, hnRNP K coordinates transcriptional silencing by SETDB1 in embryonic stem cells, PLoS Genet., 11, 10.1371/journal.pgen.1004933 · DOI
  21. Chang, 2012, Trim71 cooperates with microRNAs to repress Cdkn1a expression and promote embryonic stem cell proliferation, Nat. Commun., 3, 923, 10.1038/ncomms1909 · DOI
  22. Loedige, 2013, The mammalian TRIM-NHL protein TRIM71/LIN-41 is a repressor of mRNA function, Nucleic Acids Res., 41, 518, 10.1093/nar/gks1032 · DOI
  23. Torres-Fernández, 2019, The mRNA repressor TRIM71 cooperates with Nonsense-Mediated Decay factors to destabilize the mRNA of CDKN1A/p21, Nucleic Acids Res., 47, 11861
  24. Wu, 2020, SETDB1-Mediated Cell Fate Transition between 2C-Like and Pluripotent States, Cell Rep., 30, 25, 10.1016/j.celrep.2019.12.010 · DOI
  25. Welte, 2019, The RNA hairpin binder TRIM71 modulates alternative splicing by repressing MBNL1, Genes Dev., 33, 1221, 10.1101/gad.328492.119 · DOI
  26. Van Nostrand, 2016, Robust transcriptome-wide discovery of RNA-binding protein binding sites with enhanced CLIP (eCLIP), Nat. Methods, 13, 508, 10.1038/nmeth.3810 · DOI · Paper page
  27. Kim, 2003, Heterogeneous nuclear ribonucleoprotein C modulates translation of c-myc mRNA in a cell cycle phase-dependent manner, Mol. Cell Biol., 23, 708, 10.1128/MCB.23.2.708-720.2003 · DOI
  28. Mitschka, 2015, Co-existence of intact stemness and priming of neural differentiation programs in mES cells lacking Trim71, Sci. Rep., 5, 10.1038/srep11126 · DOI
  29. Rivera, 2015, Methylation of histone H3 lysine 9 occurs during translation, Nucleic Acids Res., 43, 9097, 10.1093/nar/gkv929 · DOI
  30. Schmidt, 2009, SUnSET, a nonradioactive method to monitor protein synthesis, Nat. Methods, 6, 275, 10.1038/nmeth.1314 · DOI · Paper page
  31. Sampath, 2008, A hierarchical network controls protein translation during murine embryonic stem cell self-renewal and differentiation, Cell Stem Cell, 2, 448, 10.1016/j.stem.2008.03.013 · DOI · Paper page
  32. Takai, 2014, 5-Hydroxymethylcytosine plays a critical role in glioblastomagenesis by recruiting the CHTOP-methylosome complex, Cell Rep., 9, 48, 10.1016/j.celrep.2014.08.071 · DOI
  33. Chang, 2013, Chtop is a component of the dynamic TREX mRNA export complex, EMBO J., 32, 473, 10.1038/emboj.2012.342 · DOI
  34. Yang, 2017, 5-methylcytosine promotes mRNA export - NSUN2 as the methyltransferase and ALYREF as an m(5)C reader, Cell Res., 27, 606, 10.1038/cr.2017.55 · DOI
  35. Jeffery, 2004, Components of the DNA methylation system of chromatin control are RNA-binding proteins, J. Biol. Chem., 279, 49479, 10.1074/jbc.M409070200 · DOI
  36. Aeschimann, 2017, LIN41 Post-transcriptionally Silences mRNAs by Two Distinct and Position-Dependent Mechanisms, Mol. Cell., 65, 476, 10.1016/j.molcel.2016.12.010 · DOI
  37. Rybak, 2009, The let-7 target gene mouse lin-41 is a stem cell specific E3 ubiquitin ligase for the miRNA pathway protein Ago2, Nat. Cell Biol., 11, 1411, 10.1038/ncb1987 · DOI
  38. Worringer, 2014, The let-7/LIN-41 pathway regulates reprogramming to human induced pluripotent stem cells by controlling expression of prodifferentiation genes, Cell Stem Cell, 14, 40, 10.1016/j.stem.2013.11.001 · DOI
  39. Castello, 2012, Insights into RNA biology from an atlas of mammalian mRNA-binding proteins, Cell, 149, 1393, 10.1016/j.cell.2012.04.031 · DOI · Paper page
  40. Christian, 2008, Interaction of heterogeneous nuclear ribonucleoprotein C1/C2 with a novel cis-regulatory element within p53 mRNA as a response to cytostatic drug treatment, Mol. Pharmacol., 73, 1558, 10.1124/mol.107.042507 · DOI
  41. Prendergast, 1999, Mechanisms of apoptosis by c-Myc, Oncogene, 18, 2967, 10.1038/sj.onc.1202727 · DOI
  42. McMahon, 2014, MYC and the control of apoptosis, Cold Spring Harb. Perspect. Med., 4, a014407, 10.1101/cshperspect.a014407 · DOI
  43. Zakharova, 2022, SETDB1 fuels the lung cancer phenotype by modulating epigenome, 3D genome organization and chromatin mechanical properties, Nucleic Acids Res., 50, 4389, 10.1093/nar/gkac234 · DOI
  44. Fritsch, 2010, A subset of the histone H3 lysine 9 methyltransferases Suv39h1, G9a, GLP, and SETDB1 participate in a multimeric complex, Mol. Cell., 37, 46, 10.1016/j.molcel.2009.12.017 · DOI · Paper page
  45. Vojtek, 1993, Mammalian Ras interacts directly with the serine/threonine kinase Raf, Cell, 74, 205, 10.1016/0092-8674(93)90307-C · DOI
  46. Dobin, 2013, STAR: ultrafast universal RNA-seq aligner, Bioinformatics, 29, 15, 10.1093/bioinformatics/bts635 · DOI · Paper page
  47. Liao, 2019, The R package Rsubread is easier, faster, cheaper and better for alignment and quantification of RNA sequencing reads, Nucleic Acids Res., 47, e47, 10.1093/nar/gkz114 · DOI
  48. Yu, 2012, clusterProfiler: an R package for comparing biological themes among gene clusters, OMICS, 16, 284, 10.1089/omi.2011.0118 · DOI · Paper page
  49. Yates, 2020, Ensembl 2020, Nucleic Acids Res., 48, D682
  50. Paz, 2014, RBPmap: a web server for mapping binding sites of RNA-binding proteins, Nucleic Acids Res., 42, W361, 10.1093/nar/gku406 · DOI

Metadata

Authors
Rapone, R., Del Maestro, L., Bouyioukos, C., Albini, S., Cruz-Tapias, P., Joliot, V., Cosson, B., & Ait-Si-Ali, S.
Affiliations
Centre National de la Recherche Scientifique (FR)
Corresponding author
Cosson, Bertrand
Venue
iScience
Publisher
Elsevier BV
Published
2023-08
Volume
26
Issue
8
Pages
107386
ISSN
2589-0042 (ISSN-L)
OpenAlex
W4384157160
Cited by
14
References
3
Citations by year
2026: 6 · 2025: 6 · 2024: 2
FWCI
1.25
Type
journal article
Language
en
Open access
Locations
  • iScience (publishedVersion, cc-by-nc-nd)
  • Research Square (acceptedVersion, cc-by)
  • PubMed Central (publishedVersion, cc-by-nc-nd)
  • PubMed (publishedVersion)
  • HAL (submittedVersion)
  • HAL (submittedVersion, other-oa)
  • HAL (submittedVersion, cc-by-nc)
  • DOAJ (DOAJ: Directory of Open Access Journals) (submittedVersion, cc-by-sa)
Funders
  • Association française contre les myopathies
  • Fondation pour la Recherche Médicale (DEQ20160334922)
  • Agence Nationale de la Recherche (ANR-17-CE12-0010-01)
  • Université Paris Diderot (ANR-11-LABX-0071)
  • Universidad del Rosario
  • Fondation ARC pour la Recherche sur le Cancer
  • Departamento Administrativo de Ciencia, Tecnología e Innovación
  • Labex
Topics
  • Life Sciences › Biochemistry, Genetics and Molecular Biology › Molecular Biology › Pluripotent Stem Cells Research
  • Life Sciences › Biochemistry, Genetics and Molecular Biology › Molecular Biology › Epigenetics and DNA Methylation
  • Life Sciences › Biochemistry, Genetics and Molecular Biology › Molecular Biology › Developmental Biology and Gene Regulation
Keywords
SETDB1, embryonic stem cells, lysine methyltransferase, H3K9 methylation, mRNA stability, post-transcriptional regulation, E3 ubiquitin ligase, mRNA translation, self-renewal, epigenetic regulation, mRNA metabolism

About these checks

Registry, retraction, Cites and statistics results are computed, not judged, with one exception: a printed reference that no index lists is read once by a model before it counts as a citation error. Claims are extracted by a model and kept only when their quote appears verbatim in the text; each cited source is then checked, with a model’s help, for whether it says what the claim relies on. Those verdicts can be wrong — read the claim’s quote and the cited source before relying on one.

Statistics and arithmetic are recomputed, not judged.

Confidence bands are shown only for fields calibrated on our annotated test set. None is calibrated yet, so no band is shown.

What counts as a claim ›How we measure confidence ›How we check this ›

Are you an author, or do you see a problem with this page? Request a review