

The DOI matches its Crossref record; 37 of the 37 references it cites were found in a registry or an index.
Multiparametric magnetic resonance imaging predicts clinical outcomes in patients with chronic liver disease
Open accessAbstract
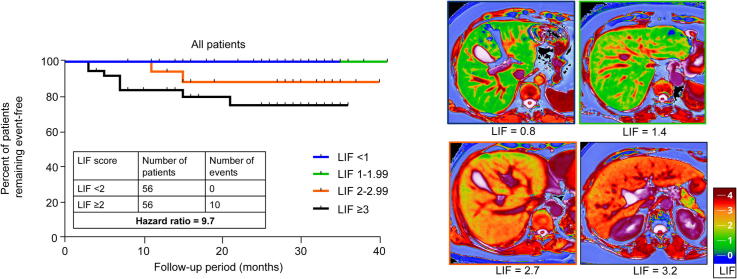
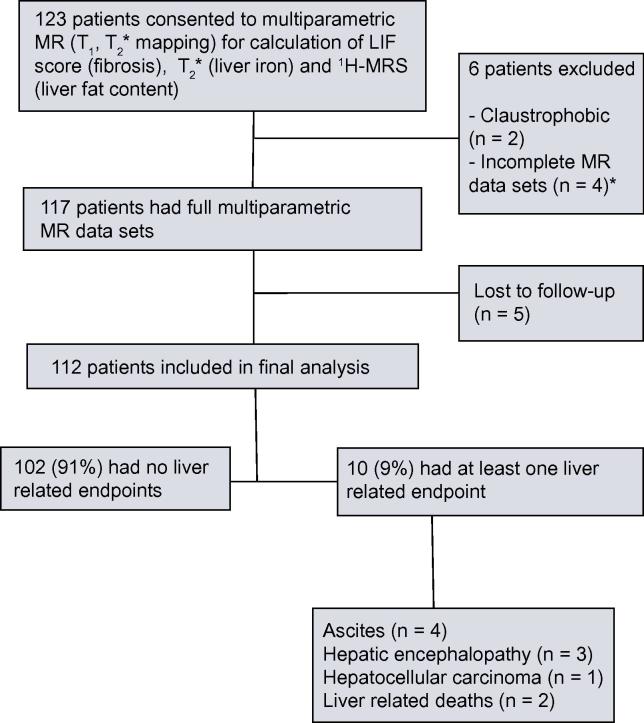
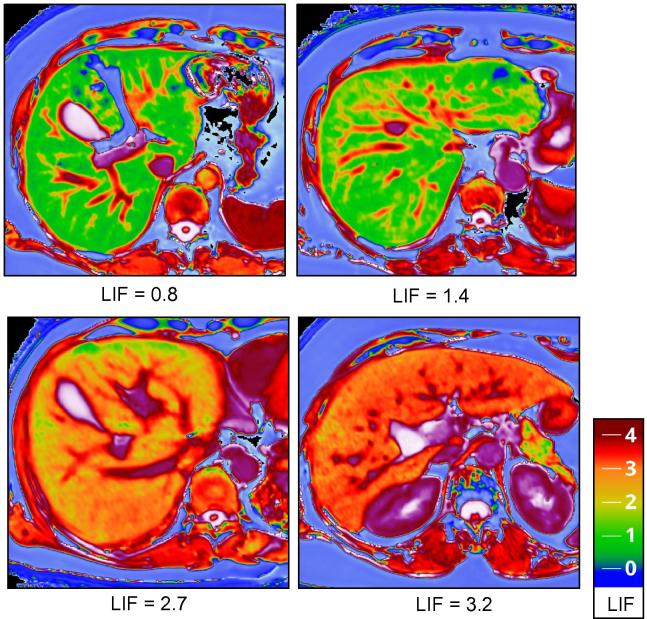
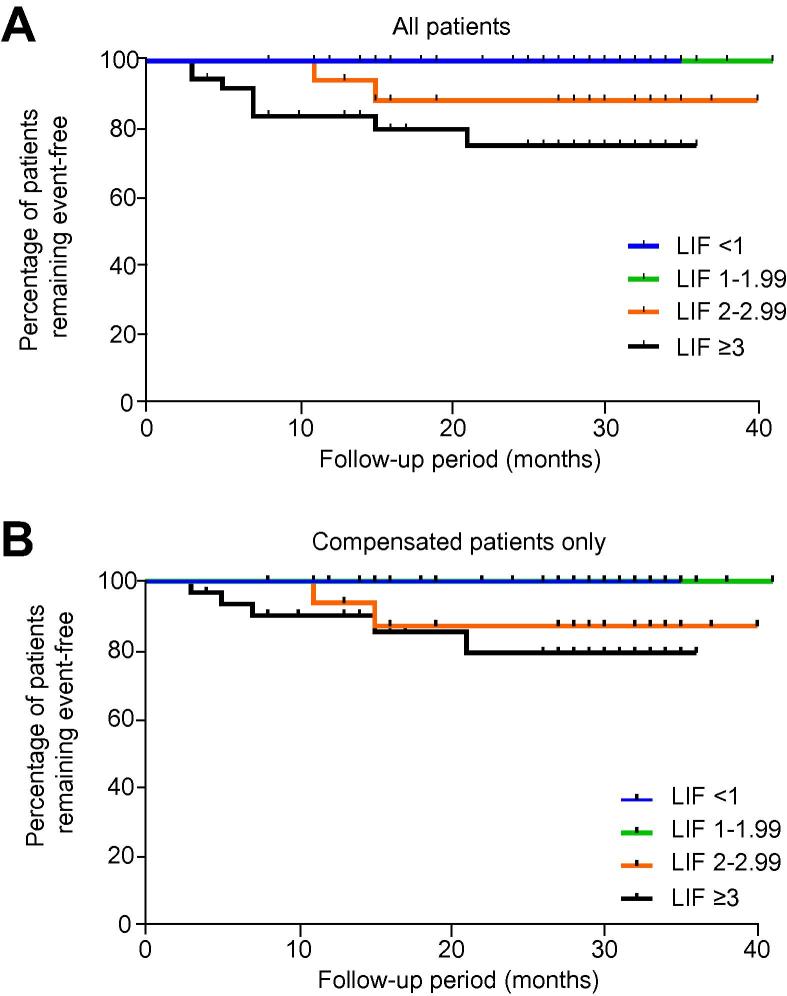
BACKGROUND & AIMS: Multiparametric magnetic resonance (MR) imaging has been demonstrated to quantify hepatic fibrosis, iron, and steatosis. The aim of this study was to determine if MR can be used to predict negative clinical outcomes in liver disease patients. METHODS: Patients with chronic liver disease (n=112) were recruited for MR imaging and data on the development of liver related clinical events were collected by medical records review. The median follow-up was 27months. MR data were analysed blinded for the Liver Inflammation and Fibrosis score (LIF; <1, 1-1.99, 2-2.99, and ⩾3 representing normal, mild, moderate, and severe liver disease, respectively), T2∗ for liver iron content and proportion of liver fat. Baseline liver biopsy was performed in 102 patients. RESULTS: Liver disease aetiologies included non-alcoholic fatty liver disease (35%) and chronic viral hepatitis (30%). Histologically, fibrosis was mild in 54 (48%), moderate in 17 (15%), and severe in 31 (28%) patients. Overall mortality was 5%. Ten patients (11%) developed at least one liver related clinical event. The negative predictive value of LIF<2 was 100%. Two patients with LIF 2-2.99 and eight with LIF⩾3 had a clinical event. Patients with LIF⩾3 had a higher cumulative risk for developing clinical events, compared to those with LIF<1 (p=0.02) and LIF 1-1.99 (p=0.03). Cox regression analysis including all 3 variables (fat, iron, LIF) resulted in an enhanced LIF predictive value. CONCLUSIONS: Non-invasive standardised multiparametric MR technology may be used to predict clinical outcomes in patients with chronic liver disease.
Overview
The claims and statistics of this paper haven’t been checked yet.
Run the check — free, no account needed. It reads the open-access text and checks the sources it cites.
Integrity signals
Registry
Cites
Statistics
Figures
Verification
Claims the paper makes
The claims and statistics of this paper haven’t been checked yet.
Run the check — free, no account needed. It reads the open-access text and checks the sources it cites.
Claims other papers make about this one
Each is checked against this paper’s own text: does it say what the citing paper says it does?
The cited source says what the claim attributes to it.
In the citing paper
“Resulting values provide a good estimate of the relative proportion of extracellular space and thus in fl ammatory activity and degree of fi brosis.”
From EASL-EASD-EASO Clinical Practice Guidelines on the management of metabolic dysfunction-associated steatotic liver disease (MASLD). (2024) · cites this paper as [161]
The check wasn’t confident either way, so it gives no verdict — never disputed.
In the citing paper
“However, low availability and high costs limit its wider use.”
From EASL-EASD-EASO Clinical Practice Guidelines on the management of metabolic dysfunction-associated steatotic liver disease (MASLD). (2024) · cites this paper as [161]
Experimental — accuracy not yet measured
Self-check
Percentages, sums and reported differences re-computed from the paper’s own numbers.
The self-check needs the paper’s full text.
Citations
Cites
Histological grading and staging of chronic hepatitis.
Ishak, K., Baptista, A., Bianchi, L., Callea, F., Groote, J. D., Gudat, F., Denk, H., Desmet, V., Korb, G., Macsween, R. N., et al. (1995) · Journal of Hepatology · doi:10.1016/0168-8278(95)80226-6 · Cited by 5,290
Global epidemiology of hepatitis C virus infection
Shepard, C. W., Finelli, L., & Alter, M. J. (2005) · The Lancet Infectious Diseases · doi:10.1016/s1473-3099(05)70216-4 · Cited by 2,758
D'Amico, G., Garcia-Tsao, G., & Pagliaro, L. (2006) · Journal of Hepatology · doi:10.1016/j.jhep.2005.10.013 · Cited by 2,687
Williams, C. D., Stengel, J. Z., Asike, M., Torres, D. M., Shaw, J. C., Contreras, M., Landt, C. L., & Harrison, S. A. (2010) · Gastroenterology · doi:10.1053/j.gastro.2010.09.038 · Cited by 2,182
Pitfalls of Liver Stiffness Measurement: A 5-Year Prospective Study of 13,369 Examinations
Castéra, L., Foucher, J., Bernard, P., Carvalho, F., Allaix, D., Merrouche, W., Couzigou, P., & de Lédinghen, V. (2009) · Hepatology · doi:10.1002/hep.23425 · Cited by 1,157
Serum markers detect the presence of liver fibrosis: A cohort study
Rosenberg, W. M., Voelker, M., Thiel, R. P., Becka, M., Burt, A. D., Schuppan, D., Hübscher, S. G., Roskams, T., Pinzani, M., & Arthur, M. J. P. (2004) · Gastroenterology · doi:10.1053/j.gastro.2004.08.052 · Cited by 1,103
Piechnik, S. K., Ferreira, V. M., Dall’Armellina, E., Cochlin, L. E., Greiser, A., Neubauer, S., & Robson, M. D. (2010) · Journal of Cardiovascular Magnetic Resonance · doi:10.1186/1532-429x-12-69 · Cited by 670
Self-citationWilliams, R. L., Aspinall, R., Bellis, M. A., Camps-Walsh, G., Cramp, M., Dhawan, A. K., Ferguson, J., Forton, D. M., Foster, G. R., Gilmore, S. I., et al. (2014) · The Lancet · doi:10.1016/s0140-6736(14)61838-9 · Cited by 601
Singh, S., Venkatesh, S. K., Wang, Z., Miller, F. H., Motosugi, U., Low, R. N., Hassanein, T., Asbach, P., Godfrey, E. M., Yin, M., et al. (2014) · Clinical Gastroenterology and Hepatology · doi:10.1016/j.cgh.2014.09.046 · Cited by 549
Pais, R., Charlotte, F., Fedchuk, L., Bédossa, P., Lebray, P., Poynard, T., & Ratziu, V. (2013) · Journal of Hepatology · doi:10.1016/j.jhep.2013.04.027 · Cited by 520
Cited by
Sorted by citations
Items 201–212 of 212
Demidova, T. Y., Titova, V. V., Levitskaya, A. N., & Gyozalyan, M. A. (2025) · Meditsinskiy sovet = Medical Council · doi:10.21518/ms2025-456
Rijnberg, F. M., Westenberg, J. J. M., van Assen, H. C., Juffermans, J. F., Kroft, L. J. M., Boogaard, P. J. V. D., Terol Espinosa de Los Monteros, C., Warmerdam, E. G., Leiner, T., Grotenhuis, H. B., et al. (2022) · Figshare · doi:10.6084/m9.figshare.19445780
López‐López, V., Maina, C., Ramos, L. H., Cáscales-Campos, P. A., Baroja‐Mazo, A., Eshmuminov, D., Pons, J. A., Carbonell, G., Hernández-Kakauridze, S., Rodríguez-Velázquez, M., et al. (2026) · Langenbeck s Archives of Surgery · doi:10.1007/s00423-026-03984-w
Николаевич, С. Ю., Труфанов, Г. Е., Fokin, V. A., Ionova, E. A., Эрнестович, А. С., & Бодрова, О. В. (2026) · Journal of radiology and nuclear medicine · doi:10.20862/0042-4676-2026-107-1-62-75
Toner, B. P., Goerke, U., Ahanonu, E., Johnson, K., Deshpande, V., Wu, H. H., Altbach, M. I., & Bilgin, A. (2026) · Magnetic Resonance in Medicine · doi:10.1002/mrm.70459
Imaging-based fibrosis assessment and risk stratification in MASLD
Jin, S., Zhou, T., Jin, D., Xie, J., Sheng, G., Li, H., Li, G., Qin, C., & Gao, P. (2026) · Frontiers in Medicine · doi:10.3389/fmed.2026.1880238
Ba-Ssalamah, S. A., Poetter‐Lang, S., Yitik, A. Y., El-Aal, T. A., Ba‐Ssalamah, A., Kannengießer, S., Gandon, Y., Langs, G., Bastati, N., & Attenberger, U. I. (2026) · European Journal of Radiology · doi:10.1016/j.ejrad.2026.113116
Bider, R., Ciobanu, C., Pazmiño, J. C., Fortier, V., McNabb, E., & Levesque, I. R. (2026) · Magnetic Resonance in Medicine · doi:10.1002/mrm.70516
Incomplete Spoiling Correction for 3D T1 Mapping
Belsley, G., Tyler, D. J., Robson, M. D., & Tunnicliffe, E. M. (2026) · Magnetic Resonance in Medicine · doi:10.1002/mrm.70559
Self-citationNavigating MASLD heterogeneity: from metabolic risk to precision stratification
Yan, C., Zhang, G., Liang, L., & He, H. (2026) · Frontiers in Medicine · doi:10.3389/fmed.2026.1966460
Metadata
- Authors
- Pavlides, M., Banerjee, R., Sellwood, J., Kelly, C. J., Robson, M. D., Booth, J. C., Collier, J., Neubauer, S., & Barnes, E.
- Affiliations
- University of Oxford (GB)
- Perspectum Ltd. (United Kingdom) (GB)
- Royal Berkshire Hospital (GB)
- Corresponding author
- Barnes, Eleanor
- ORCID
- Venue
- Journal of Hepatology
- Publisher
- Elsevier BV
- Published
- 2016-02
- Volume
- 64
- Issue
- 2
- Pages
- 308-315
- ISSN
- 0168-8278 (ISSN-L)
- PMC
- PMC4751288
- OpenAlex
- W2201457922
- Cited by
- 212
- References
- 37
- Citations by year
- 2026: 10 · 2025: 17 · 2024: 18 · 2023: 9 · 2022: 24 · 2021: 29 · 2020: 38 · 2019: 14 · 2018: 24 · 2017: 14 · 2016: 15
- FWCI
- 13.85
- Type
- journal article
- Language
- en
- Open access
- hybrid
- doi.org
- Locations
- Journal of Hepatology (publishedVersion, cc-by)
- Europe PMC (PubMed Central) (publishedVersion, cc-by)
- PubMed Central (publishedVersion, cc-by)
- PubMed (publishedVersion)
- Funders
- Oxford NIHR Biomedical Research Centre
- Topics
- Health Sciences › Medicine › Hepatology › Liver Disease Diagnosis and Treatment
- Health Sciences › Medicine › Radiology, Nuclear Medicine and Imaging › Advanced MRI Techniques and Applications
- Health Sciences › Medicine › Hepatology › Liver Disease and Transplantation
- Keywords
- chronic liver disease, multiparametric MRI, liver fibrosis, liver iron concentration, hepatic steatosis, non-alcoholic fatty liver disease, chronic viral hepatitis, T2-weighted imaging
- MeSH terms
- Adult, Biopsy, Female, Fibrosis, United Kingdom, Hepatitis, Chronic, Humans, Inflammation, Liver, Magnetic Resonance Imaging, Male, Middle Aged, Predictive Value of Tests, Prognosis, Severity of Illness Index, Risk Assessment, Kaplan-Meier Estimate, Non-alcoholic Fatty Liver Disease
About these checks
Registry, retraction, Cites and statistics results are computed, not judged, with one exception: a printed reference that no index lists is read once by a model before it counts as a citation error. Claims are extracted by a model and kept only when their quote appears verbatim in the text; each cited source is then checked, with a model’s help, for whether it says what the claim relies on. Those verdicts can be wrong — read the claim’s quote and the cited source before relying on one.
Statistics and arithmetic are recomputed, not judged.
Confidence bands are shown only for fields calibrated on our annotated test set. None is calibrated yet, so no band is shown.
What counts as a claim ›How we measure confidence ›How we check this ›
Are you an author, or do you see a problem with this page? Request a review
