

The DOI matches its Crossref record.
Unpiloted Aerial Vehicle (UAV) image velocimetry for validation of two-dimensional hydraulic model simulations
Open accessAbstract
Non-intrusive image-based techniques for measuring surface river velocities have rapidly evolved as a cost-effective and safe means for quantifying flow patterns. Large-scale particle image velocimetry (LSPIV) can provide instantaneous surface velocities over a large spatial footprint rapidly and with little pre-calibration as compared to traditional techniques. Assessment of the spatial distribution of flow velocities in hydraulic models has been comparatively harder to achieve than assessment of depth due to logistical challenges but would be aided using large observational datasets that represent the variability and distribution of flow hydraulics. Additionally, the efficacy of image velocimetry in assessing the accuracy of outputs from 2D hydraulic models has not been addressed. Here, we demonstrate how LSPIV can be used to calibrate and validate 2D model predictions in a gravel bed river reach. LSPIV velocities are depth-averaged using standard velocity coefficients ( α ) and then using the Probability Concept (PC) - a probabilistic formulation of velocity distributions that accounts for non-standard velocity profiles, typical in field settings. UAV surveys were used to acquire video for LSPIV and imagery for Structure from Motion (SfM) topographic modelling. We use spatially dense acoustic doppler current profiler (aDcp) velocity data for benchmark assessment of the velocity outputs of HEC-RAS 2D model simulations. 2D model prediction error, based on seeded LSPIV velocities, was within range (4.2%) of the aDcp parametrised model, with improvements in modelled versus predicted velocity correlations (up to 7.7%) when using PC to depth average LSPIV velocities. Validation bias reduced significantly (11%) with tighter error distributions when compared to the aDcp based model. Although additional hydraulic measurements are required to parametrise the Probability Concept algorithm, the performance of 2D hydraulic models calibrated/validated with LSPIV velocities is on par with traditional techniques, demonstrating the potential of this non-intrusive, low-cost approach.
Overview
The claims and statistics of this paper haven’t been checked yet.
Run the check — free, no account needed. It reads the open-access text and checks the sources it cites.
Integrity signals
Registry
Cites
Statistics
Figures
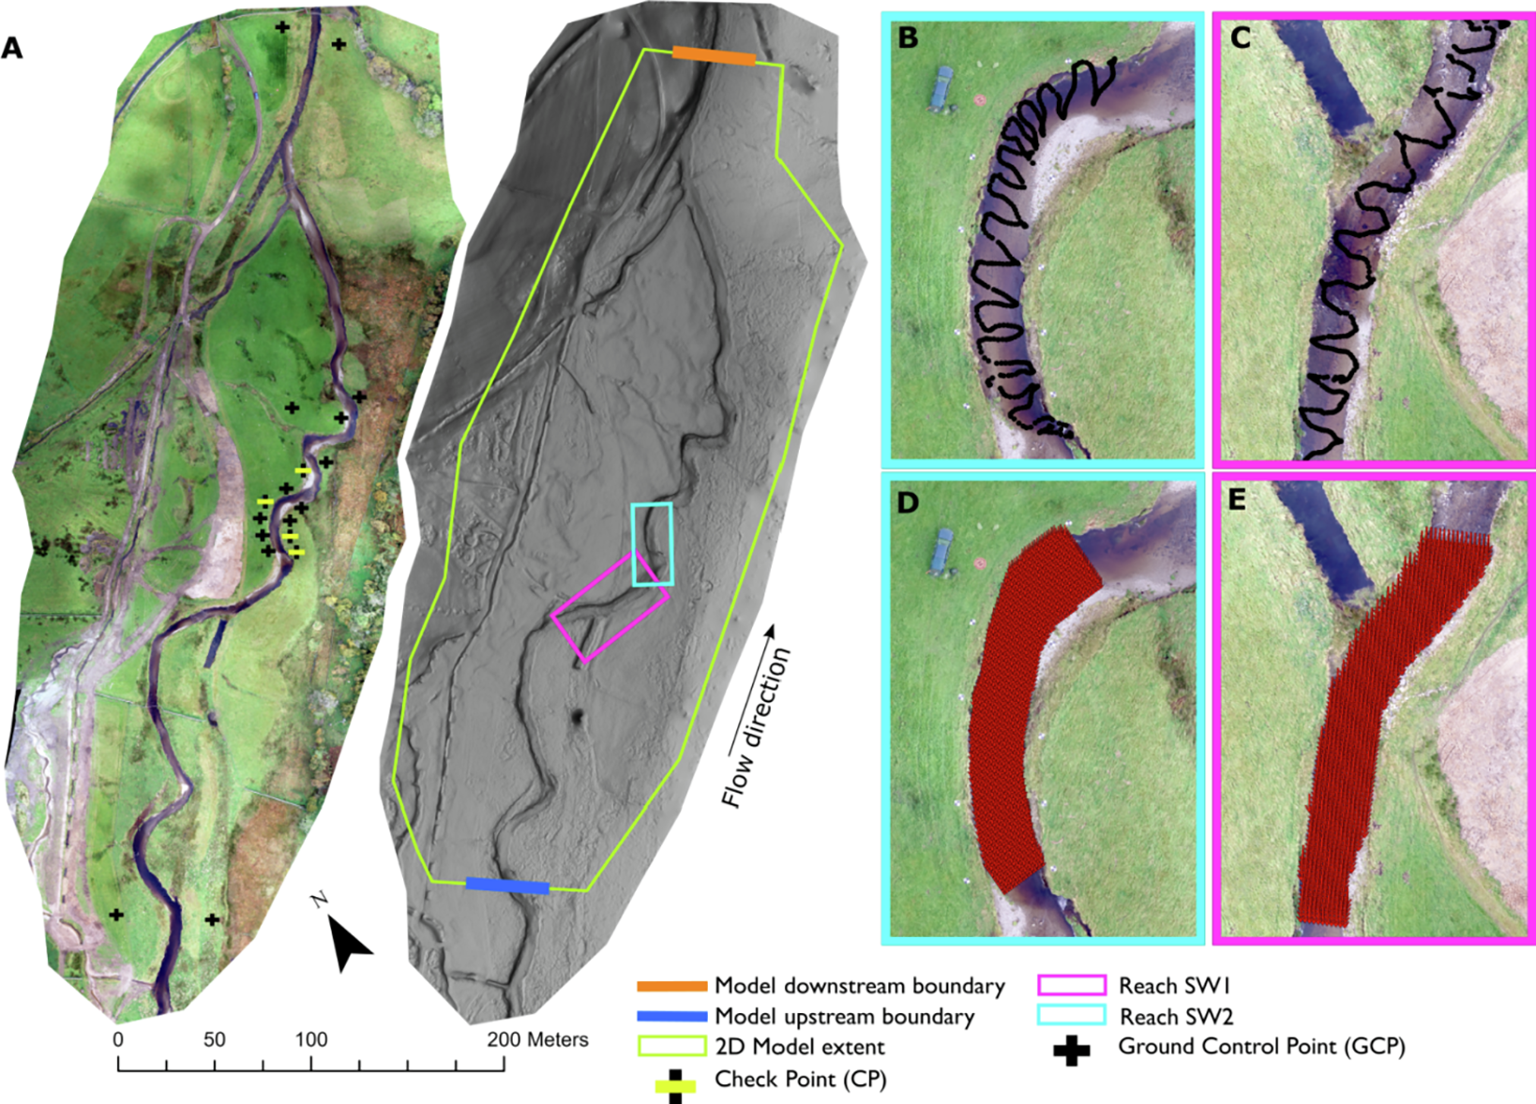
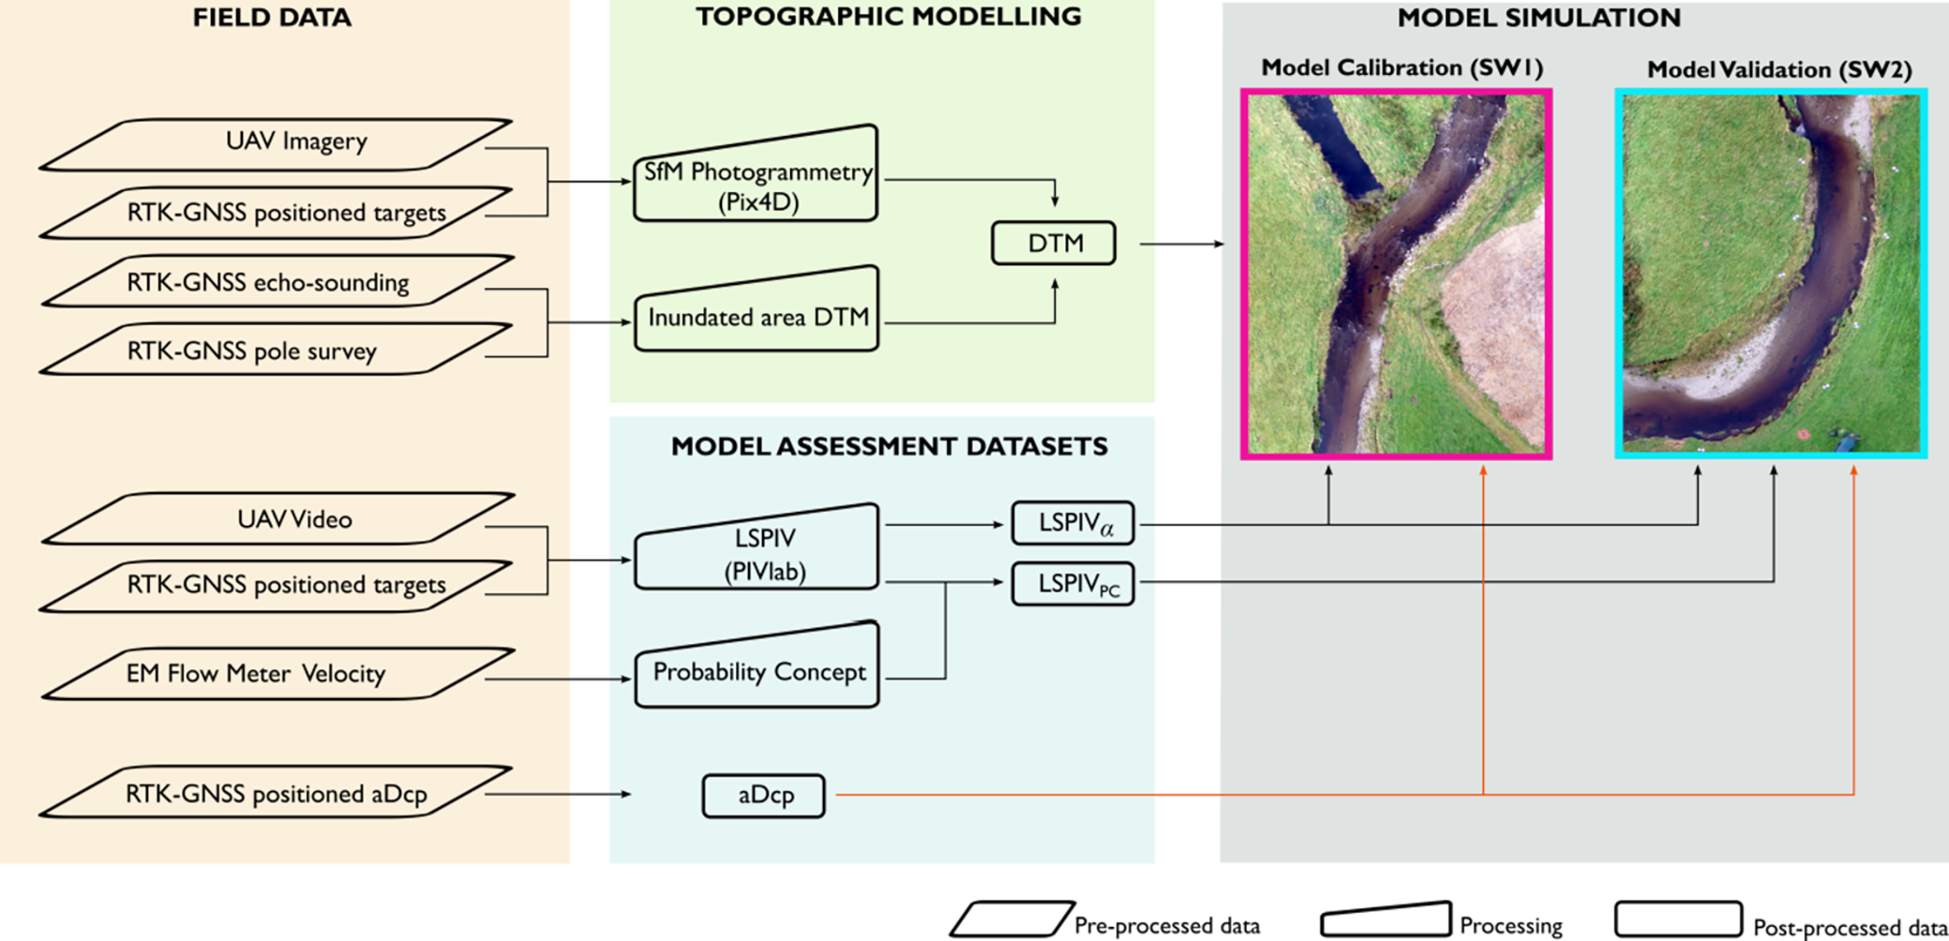
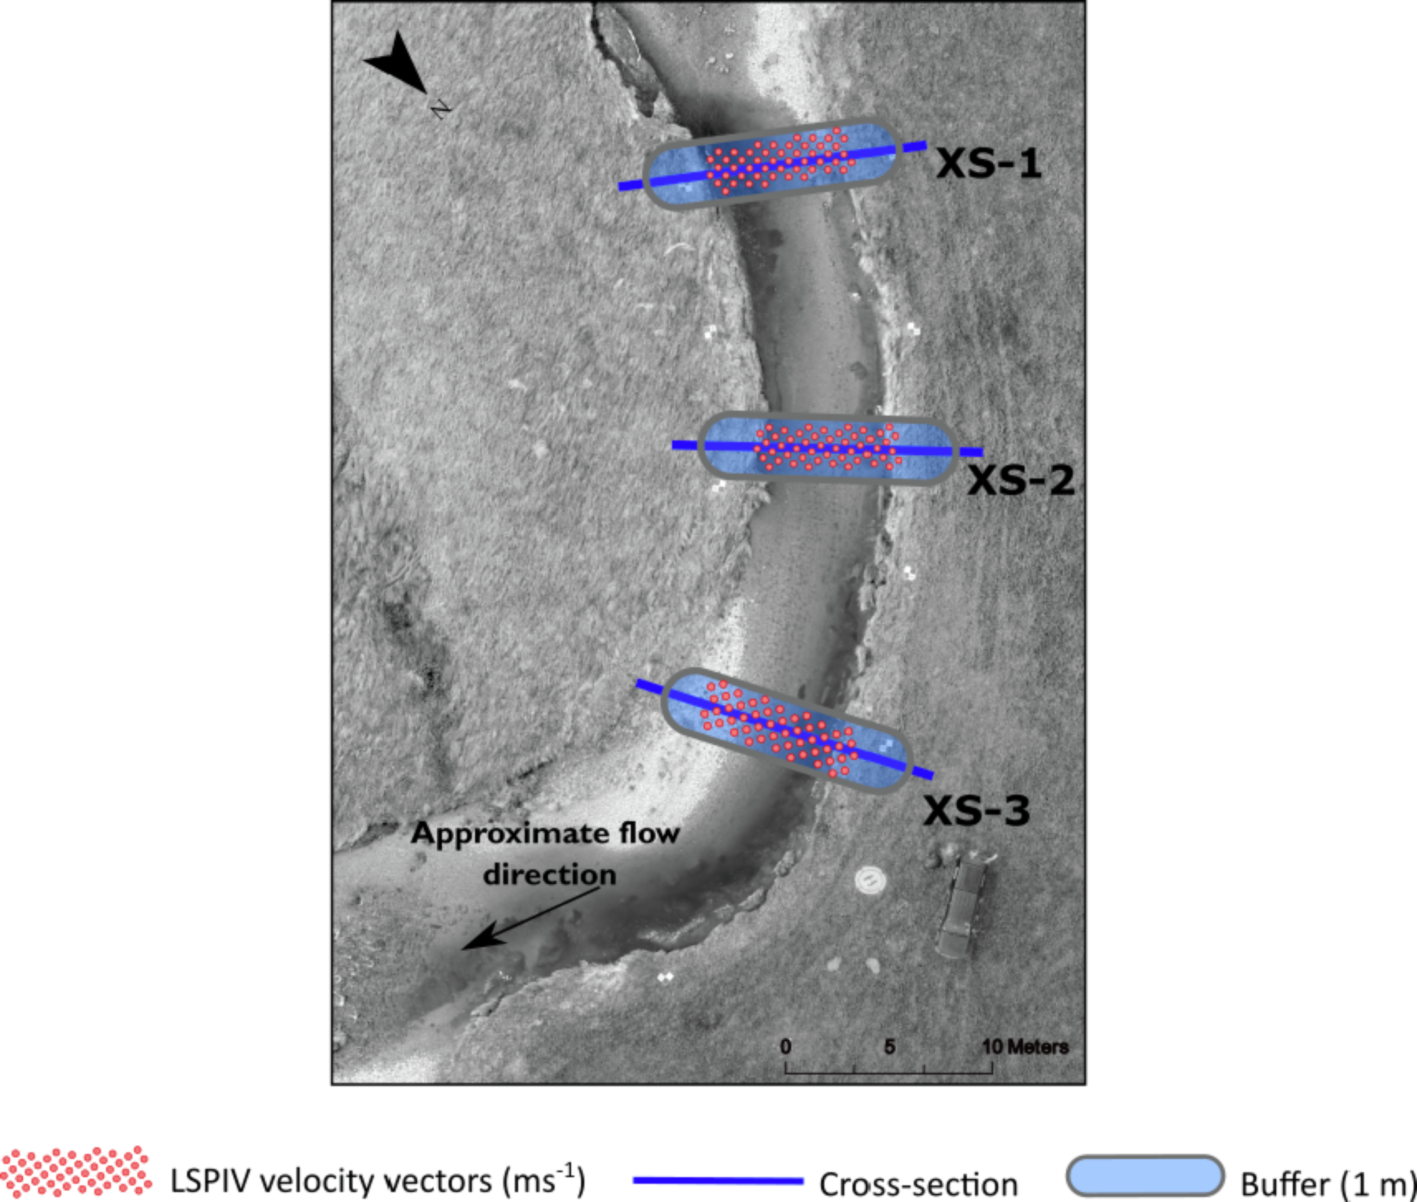
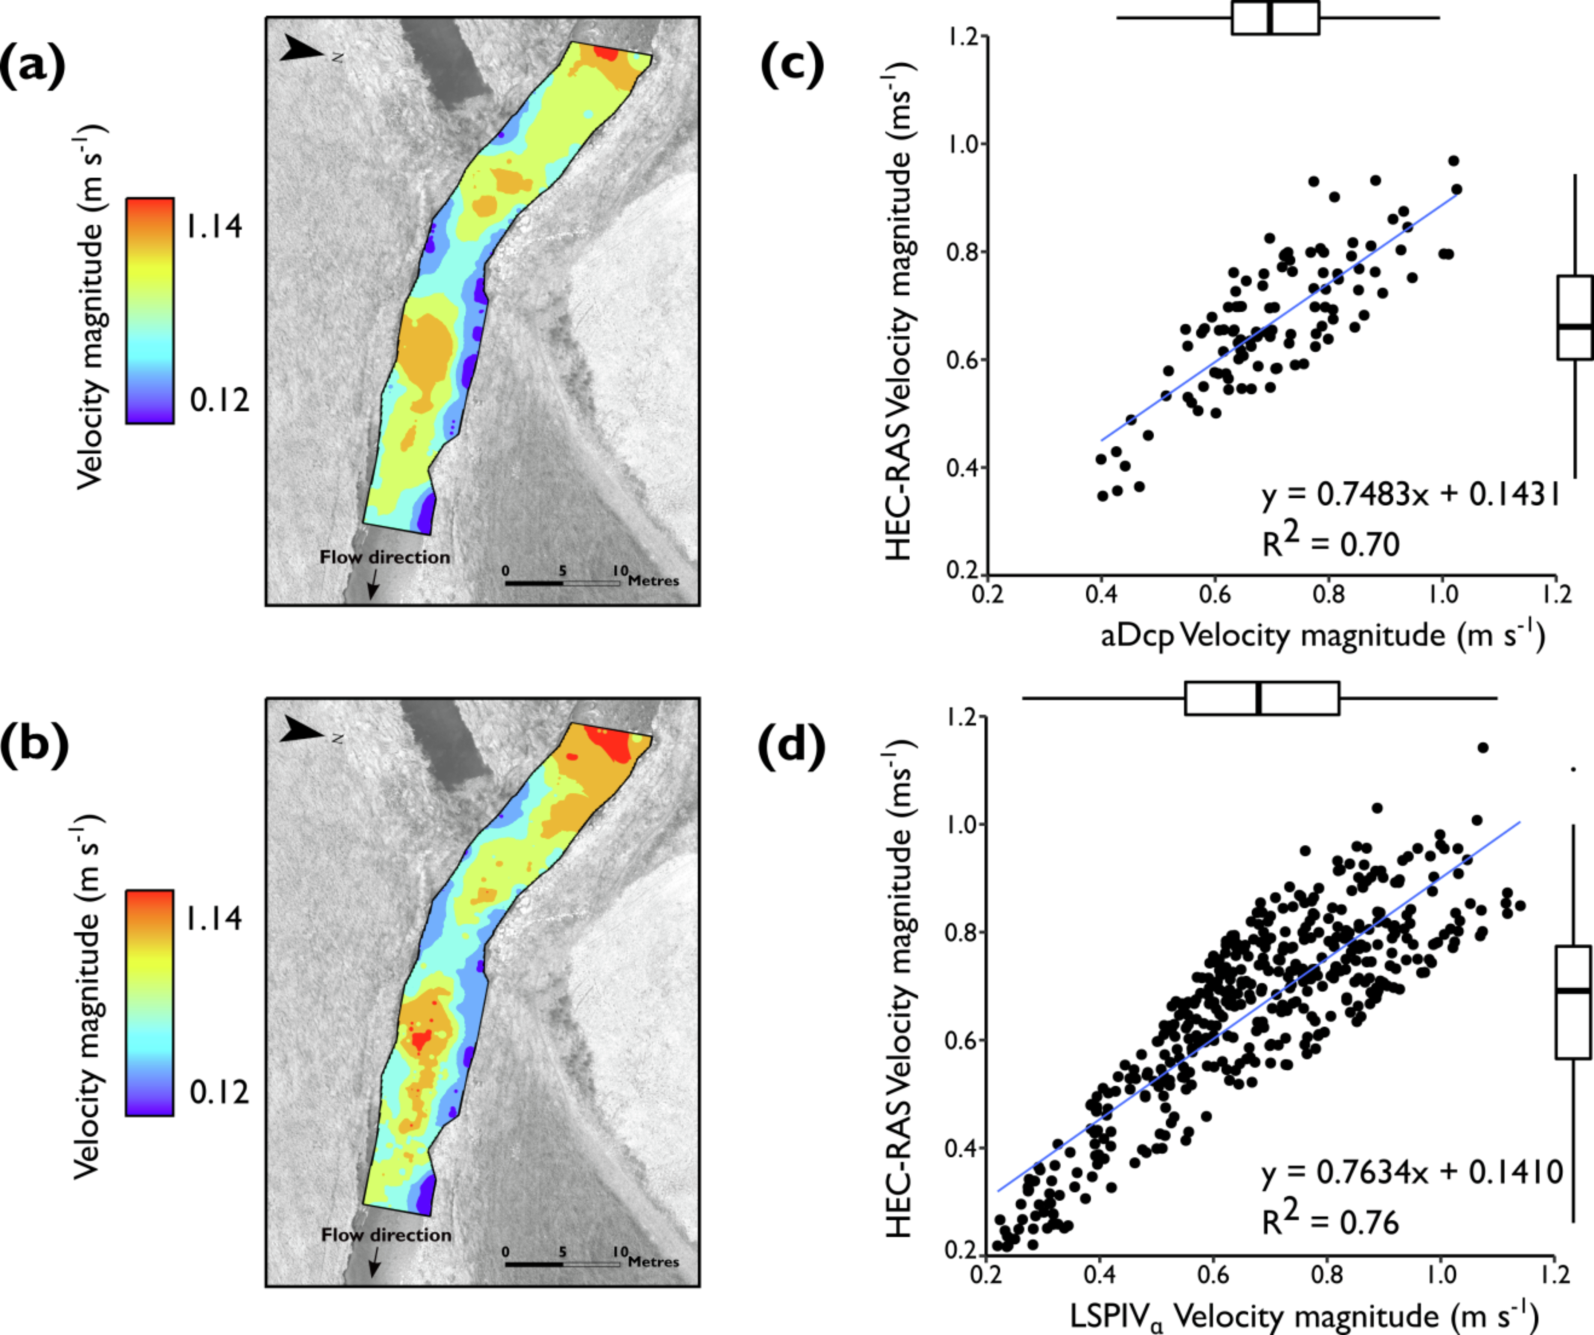
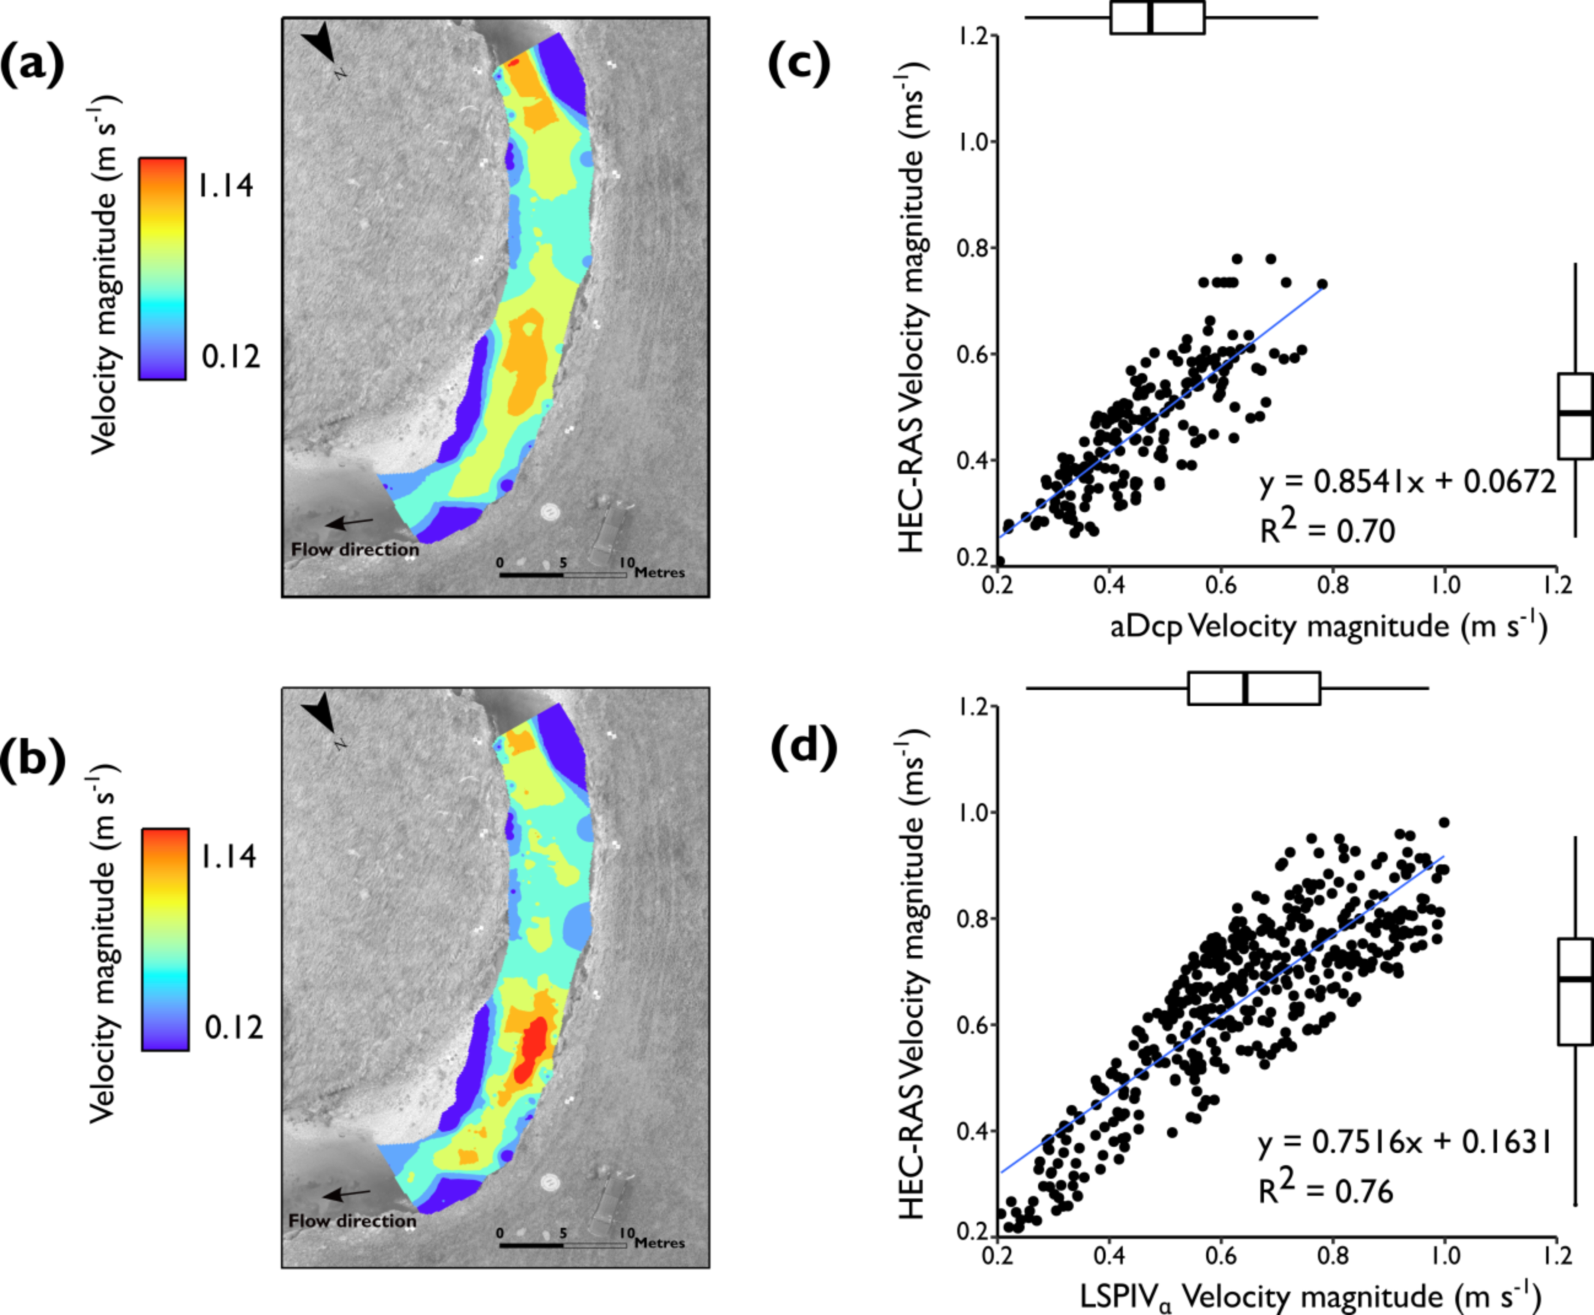
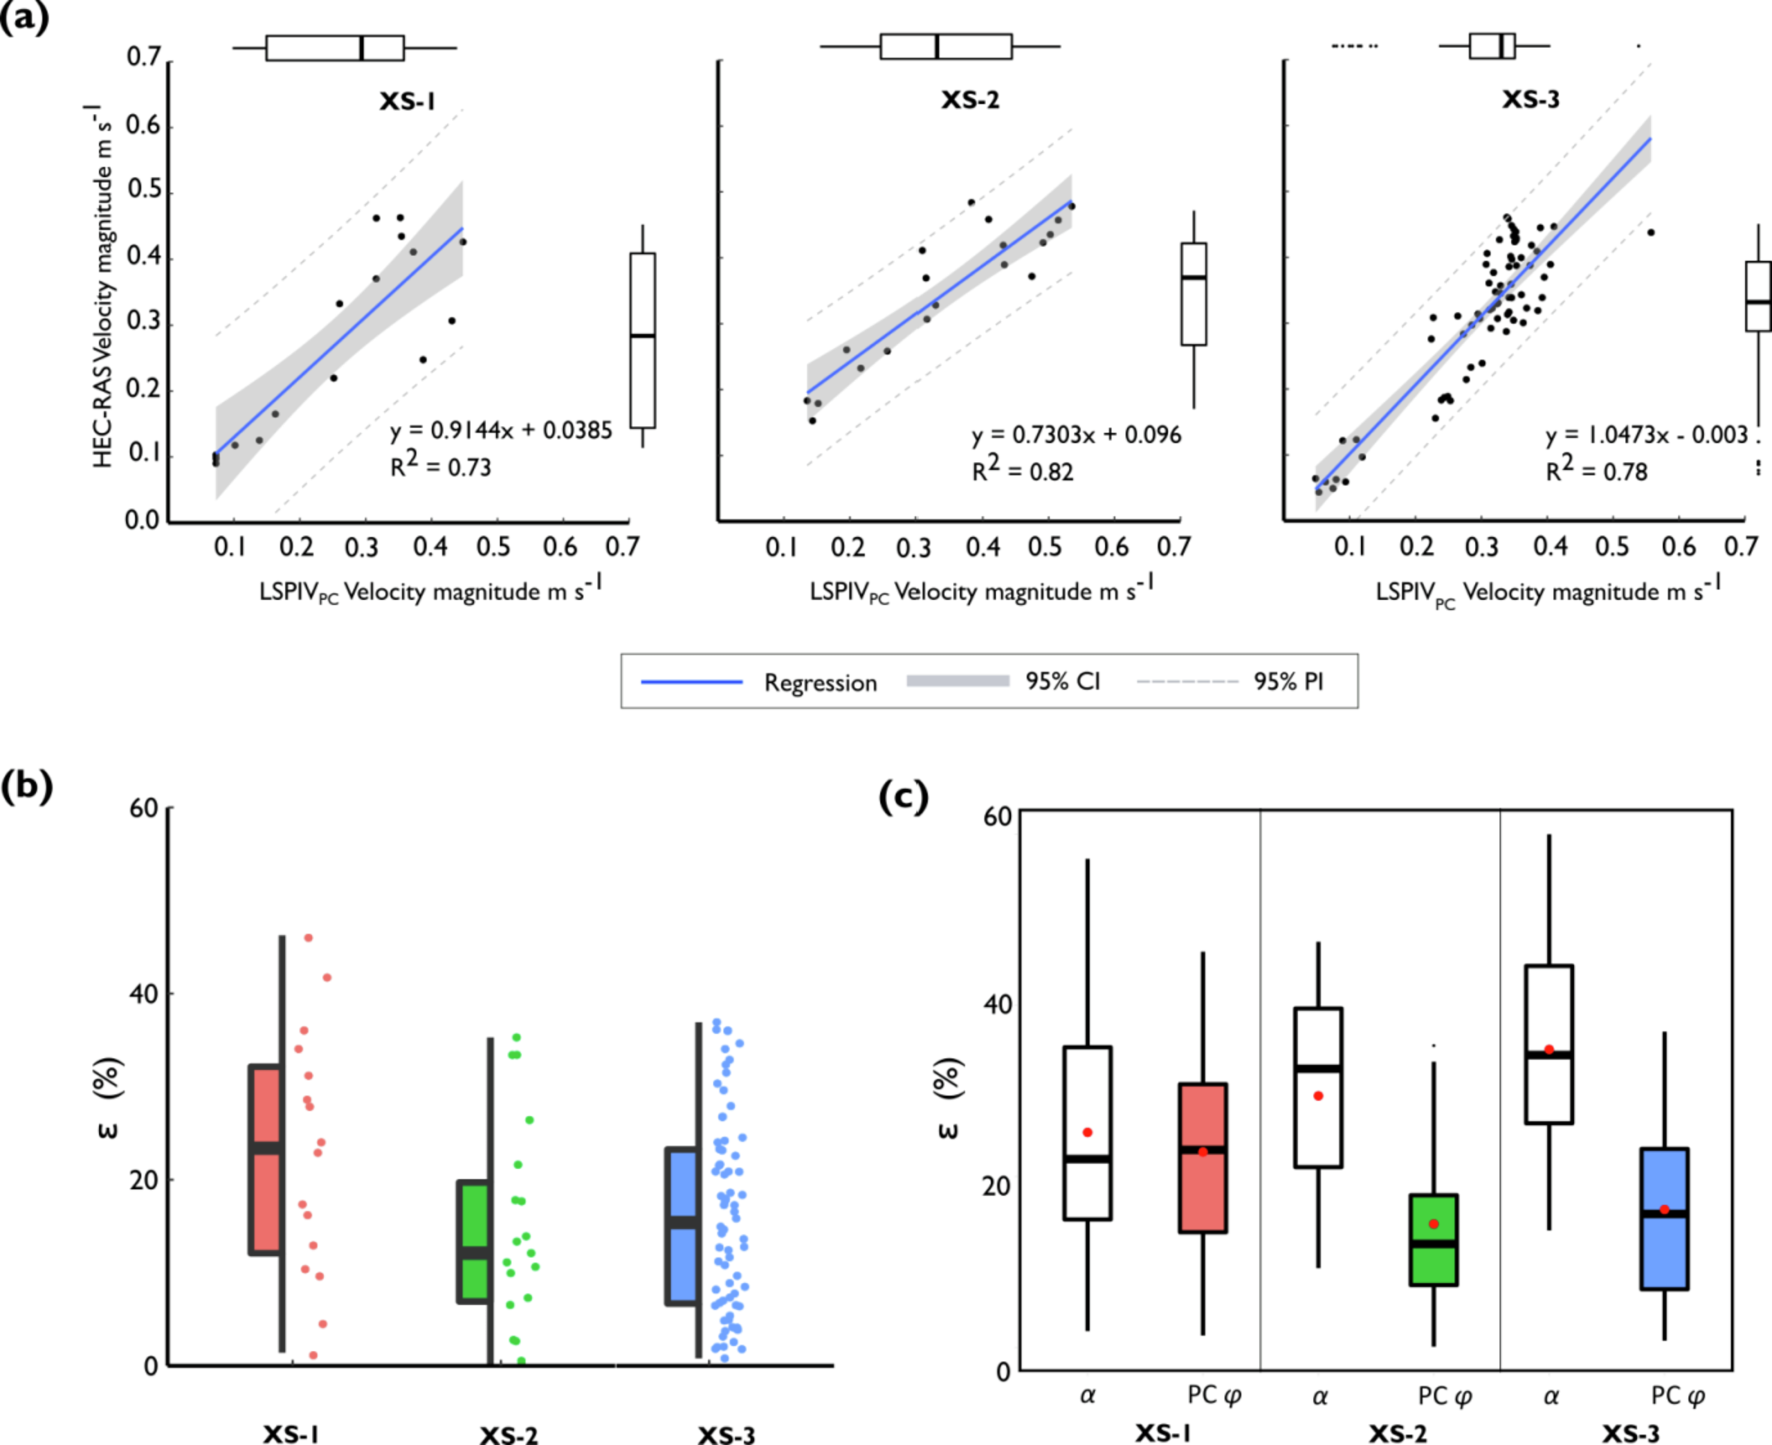
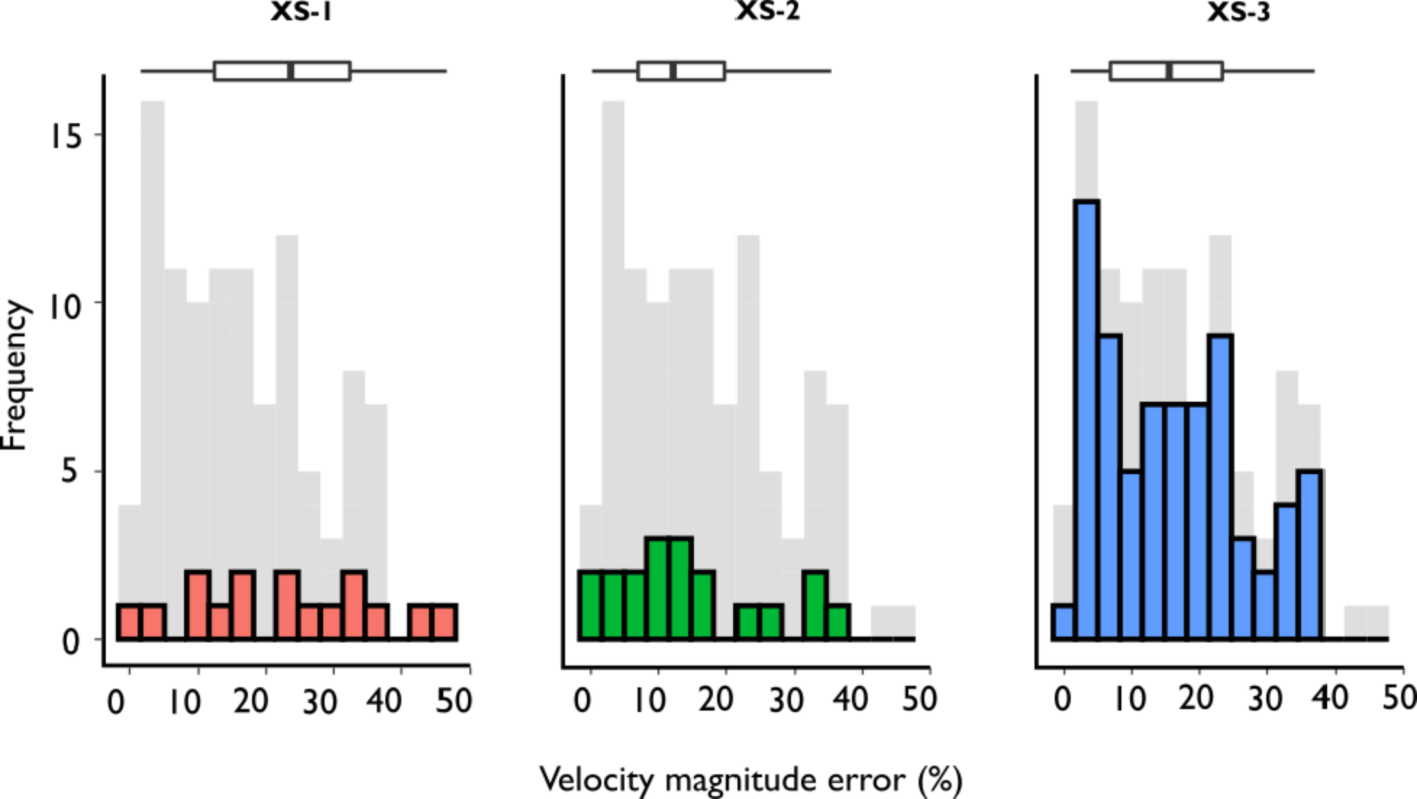
Verification
Claims the paper makes
The claims and statistics of this paper haven’t been checked yet.
Run the check — free, no account needed. It reads the open-access text and checks the sources it cites.
Claims other papers make about this one
Each is checked against this paper’s own text: does it say what the citing paper says it does?
The check wasn’t confident either way, so it gives no verdict — never disputed.
In the citing paper
“Additionally, hydrodynamic validation was constrained to a single monitoring point over a short temporal window with a chronological offset between the 2023 UAV acquisition and 2025 velocity record (Fig. 3) 41 .”
From AI-driven digital twinning quantifies the trade-off between flood conveyance and riparian stability under climate extremes (2026) · cites this paper as [41]
Experimental — accuracy not yet measured
Self-check
Percentages, sums and reported differences re-computed from the paper’s own numbers.
The self-check needs the paper’s full text.
Citations
Cites
No references could be resolved yet.
Research works printed but not linked: 88
- Abu-Aly, 2014, Effects of LiDAR-derived, spatially distributed vegetation roughness on two-dimensional hydraulics in a gravel-cobble river at flows of 0.2 to 20 times bankfull, Geomorphology, 206, 468, 10.1016/j.geomorph.2013.10.017 · DOI
- Adrian, 1991, Particle-imaging techniques for experimental fluid mechanics, Annu. Rev. Fluid Mech., 23, 261, 10.1146/annurev.fl.23.010191.001401 · DOI · Paper page
- Afshari, 2018, Comparison of new generation low-complexity flood inundation mapping tools with a hydrodynamic model, J. Hydrol., 556, 539, 10.1016/j.jhydrol.2017.11.036 · DOI
- Al-mamari, 2019, Real-time measurement of flash-flood in a wadi area by LSPIV and STIV, Hydrology, 6, 27, 10.3390/hydrology6010027 · DOI
- Amelinckx, 1971, Classical dynamics of particles and systems, Phys. Bull., 22, 157, 10.1088/0031-9112/22/3/020 · DOI
- Annis, 2020, UAV-DEMs for small-scale flood hazard mapping, Water, 12, 1717, 10.3390/w12061717 · DOI
- Baird, 2021, Two-dimensional numerical modeling of flow in physical models of rock vane and bendway weir configurations, Water, 13, 458, 10.3390/w13040458 · DOI
- Barker, 2018, Kayak drifter surface velocity observation for 2D hydraulic model validation, River Res. Appl., 34, 124, 10.1002/rra.3238 · DOI
- Bechle, 2014, An entropy-based surface velocity method for estuarine discharge measurement, Water Resour. Res., 50, 6106, 10.1002/2014WR015353 · DOI
- Bernhofen, 2018, A first collective validation of global fluvial flood models for major floods in Nigeria and Mozambique, Environ. Res. Lett., 13, 10.1088/1748-9326/aae014 · DOI
- Biondi, 2012, Validation of hydrological models: Conceptual basis, methodological approaches and a proposal for a code of practice, Phys. Chem. Earth Parts A/B/C, 42–44, 70, 10.1016/j.pce.2011.07.037 · DOI
- Brunner, G.W., 2002. Hec-ras (river analysis system), in: North American Water and Environment Congress & Destructive Water. ASCE, pp. 3782–3787.
- Cao, 2021, Airborne Feature Matching Velocimetry for surface flow measurements in rivers, J. Hydraul. Res., 59, 637, 10.1080/00221686.2020.1818309 · DOI
- Carrivick, 2019, Fluvial and aquatic applications of Structure from Motion photogrammetry and unmanned aerial vehicle/drone technology, WIREs Water, 6, e1328, 10.1002/wat2.1328 · DOI
- Cea, 2014, Experimental validation of a 2D overland flow model using high resolution water depth and velocity data, J. Hydrol., 513, 142, 10.1016/j.jhydrol.2014.03.052 · DOI
- Chiu, 1987, Entropy and probability concepts in hydraulics, J. Hydraul. Eng., 113, 583, 10.1061/(ASCE)0733-9429(1987)113:5(583) · DOI
- Chiu, 1986, Structure of 3-D Flow in rectangular open channels, J. Hydraul. Eng., 112, 1050, 10.1061/(ASCE)0733-9429(1986)112:11(1050) · DOI
- Chiu, 2006, Probabilistic approach to modeling of velocity distributions in fluid flows, J. Hydrol., 316, 28, 10.1016/j.jhydrol.2005.04.011 · DOI
- Creutin, 2003, River gauging using PIV techniques: a proof of concept experiment on the Iowa River, J. Hydrol., 277, 182, 10.1016/S0022-1694(03)00081-7 · DOI
- Dal Sasso, 2021, Recent advancements and perspectives in UAS-Based image velocimetry, Drones, 5, 81, 10.3390/drones5030081 · DOI
- Dal Sasso, 2021, Increasing LSPIV performances by exploiting the seeding distribution index at different spatial scales, J. Hydrol., 598, 10.1016/j.jhydrol.2021.126438 · DOI
- DeBell, L., Anderson, K., Brazier, R.E., King, N., Jones, L., 2016. Water resource management at catchment scales using lightweight UAVs: current capabilities and future perspectives 4, 24. · DOI
- Dobson, 2014, Fast, large-scale, particle image velocimetry-based estimations of river surface velocity, Comput. Geosci., 70, 35, 10.1016/j.cageo.2014.05.007 · DOI
- Dramais, 2011, Advantages of a mobile LSPIV method for measuring flood discharges and improving stage–discharge curves, J. Hydro-environ. Res., 5, 301, 10.1016/j.jher.2010.12.005 · DOI
- Eltner, 2019, Flow velocity and discharge measurement in rivers using terrestrial and UAV imagery, Hydrol. Earth Syst. Sci. Discuss., 1–29
- Environment Canada, 2004. Procedures for conducting ADCP Discharge Measurements, 1st edition. ed. Environment Canada.
- Escobar Villanueva, 2019, DEM generation from fixed-wing UAV imaging and LiDAR-derived ground control points for flood estimations, Sensors (Basel), 19, 3205, 10.3390/s19143205 · DOI · Paper page
- Euler, L., 2008. Principles of the motion of fluids. Physica D: Nonlinear Phenomena, Euler Equations: 250 Years On 237, 1840–1854. https://doi.org/10.1016/j.physd.2008.04.019. · DOI
- Fischer, 2015, Validation of a spatial model used to locate fish spawning reef construction sites in the St. Clair-Detroit River system, J. Great Lakes Res., 41, 1178, 10.1016/j.jglr.2015.09.019 · DOI
- Flener, 2015, Empirical modeling of spatial 3D flow characteristics using a remote-controlled ADCP system: monitoring a spring flood, Water, 7, 217, 10.3390/w7010217 · DOI
- Fujita, 1998, Large-scale particle image velocimetry for flow analysis in hydraulic engineering applications, J. Hydraul. Res., 36, 397, 10.1080/00221689809498626 · DOI
- Fulton, 2018, Computing under-ice discharge: a proof-of-concept using hydroacoustics and the Probability Concept, J. Hydrol., 562, 733, 10.1016/j.jhydrol.2018.04.073 · DOI
- Fulton, 2020, QCam: sUAS-based doppler radar for measuring river discharge, Remote Sensing, 12, 3317, 10.3390/rs12203317 · DOI
- Fulton, 2020, Near-field remote sensing of surface velocity and river discharge using radars and the probability concept at 10 U.S. geological survey streamgages, Remote Sens., 12, 1296, 10.3390/rs12081296 · DOI
- Fulton, 2008, Measuring real-time streamflow using emerging technologies: Radar, hydroacoustics, and the probability concept, J. Hydrol., 357, 1, 10.1016/j.jhydrol.2008.03.028 · DOI
- Garcia, 2010, Robust smoothing of gridded data in one and higher dimensions with missing values, Comput. Stat. Data Anal., 54, 1167, 10.1016/j.csda.2009.09.020 · DOI
- Hankin, 2019, Integration of hillslope hydrology and 2D hydraulic modelling for natural flood management, Hydrol. Res., 50, 1535, 10.2166/nh.2019.150 · DOI
- Hauet, 2018, Velocity profile and depth-averaged to surface velocity in natural streams: a review over alarge sample of rivers, E3S Web Conf., 40, 06015, 10.1051/e3sconf/20184006015 · DOI
- Huang, 2018, Estimating uncertainty of streamflow measurements with moving-boat acoustic Doppler current profilers, Hydrol. Sci. J., 63, 353, 10.1080/02626667.2018.1433833 · DOI
- James, 2019, Guidelines on the use of structure-from-motion photogrammetry in geomorphic research, Earth Surf. Proc. Land., 44, 2081, 10.1002/esp.4637 · DOI
- Javernick, 2014, Modeling the topography of shallow braided rivers using Structure-from-Motion photogrammetry, Geomorphology, 213, 166, 10.1016/j.geomorph.2014.01.006 · DOI
- Johnson, 2017, Remote determination of the velocity index and mean streamwise velocity profiles, Water Resour. Res., 53, 7521, 10.1002/2017WR020504 · DOI
- Kasvi, 2015, Two-dimensional and three-dimensional computational models in hydrodynamic and morphodynamic reconstructions of a river bend: sensitivity and functionality, Hydrol. Process., 29, 1604, 10.1002/hyp.10277 · DOI
- Kostaschuk, 2005, Measuring flow velocity and sediment transport with an acoustic Doppler current profiler, Geomorphol. Fluid Flow Sedim. Trans. Process. Geomorphol., 68, 25
- Koutalakis, 2019, UAVs for hydrologic scopes: application of a low-cost UAV to estimate surface water velocity by using three different image-based methods, Drones, 3, 14, 10.3390/drones3010014 · DOI
- Lane, 1999, The application of computational fluid dynamics to natural river channels: three-dimensional versus two-dimensional approaches, Geomorphology, 29, 1, 10.1016/S0169-555X(99)00003-3 · DOI
- Le Coz, 2010, Performance of image-based velocimetry (LSPIV) applied to flash-flood discharge measurements in Mediterranean rivers, J. Hydrol., 394, 42, 10.1016/j.jhydrol.2010.05.049 · DOI
- Lee, 2006, Electromagnetic wave surface velocimetry, J. Hydraul. Eng., 132, 146, 10.1061/(ASCE)0733-9429(2006)132:2(146) · DOI
- Legleiter, 2021, Surface flow velocities from space: particle image velocimetry of satellite video of a large, Sediment-Laden River, Front. Water, 3, 10.3389/frwa.2021.652213 · DOI
- Lewis, 2018, Integrating unmanned aerial systems and LSPIV for rapid, cost-effective stream gauging, J. Hydrol., 560, 230, 10.1016/j.jhydrol.2018.03.008 · DOI
- Liu, 2021, Large-scale particle image velocimetry to measure streamflow from videos recorded from unmanned aerial vehicle and fixed imaging system, Remote Sensing, 13, 2661, 10.3390/rs13142661 · DOI
- Marini, 2011, Entropy approach for 2D velocity distribution in open-channel flow, J. Hydraul. Res., 49, 784, 10.1080/00221686.2011.635889 · DOI
- McCabe, 2017, The future of Earth observation in hydrology, Hydrol. Earth Syst. Sci., 21, 3879, 10.5194/hess-21-3879-2017 · DOI
- Moramarco, 2017, From surface flow velocity measurements to discharge assessment by the entropy theory, Water, 9, 120, 10.3390/w9020120 · DOI
- Moriasi, 2007, Model evaluation guidelines for systematic quantification of accuracy in watershed simulations, Trans. ASABE, 50, 885, 10.13031/2013.23153 · DOI · Paper page
- Mueller, D.S., Wagner, C.R., Rehmel, M.S., Oberg, K.A., Rainville, F., 2013. Measuring discharge with acoustic Doppler current profilers from a moving boat (USGS Numbered Series No. 3-A22), Measuring discharge with acoustic Doppler current profilers from a moving boat, Techniques and Methods. U.S. Geological Survey, Reston, VA. https://doi.org/10.3133/tm3A22. · DOI
- Muste, 2008, Large-scale particle image velocimetry for measurements in riverine environments, Water Resour. Res., 44, 10.1029/2008WR006950 · DOI
- Naves, 2021, Assessing different imaging velocimetry techniques to measure shallow runoff velocities during rain events using an urban drainage physical model, Hydrol. Earth Syst. Sci., 25, 885, 10.5194/hess-25-885-2021 · DOI
- Parsapour-Moghaddam, 2018, Calibration of a 3D hydrodynamic meandering river model using fully spatially distributed 3D ADCP velocity data, J. Hydraul. Eng., 144, 04018010, 10.1061/(ASCE)HY.1943-7900.0001424 · DOI
- Pasternack, 2006, Error propagation for velocity and shear stress prediction using 2D models for environmental management, J. Hydrol. Measurem. Parameteriz. Rainfall Microstruct., 328, 227
- Patalano, 2017, Rectification of image velocity results (RIVeR): a simple and user-friendly toolbox for large scale water surface Particle Image Velocimetry (PIV) and Particle Tracking Velocimetry (PTV), Comput. Geosci., 109, 323, 10.1016/j.cageo.2017.07.009 · DOI
- Pearce, 2020, An Evaluation of image velocimetry techniques under low flow conditions and high seeding densities using unmanned aerial systems, Remote Sens., 12, 232, 10.3390/rs12020232 · DOI
- Perks, M.T., Sasso, S.F.D., Hauet, A., Jamieson, E., Coz, J.L., Pearce, S., Peña-Haro, S., Pizarro, A., Strelnikova, D., Tauro, F., Bomhof, J., Grimaldi, S., Goulet, A., Hortobágyi, B., Jodeau, M., Käfer, S., Ljubicˇic, R., Maddock, I., Mayr, P., Paulus, G., Pénard, L., Sinclair, L., Manfreda, S., 2020. Towards harmonisation of image velocimetry techniques for river surface velocity observations 15. · DOI
- Pilotti, 2020, Dam-break wave propagation in alpine valley with HEC-RAS 2D: experimental cancano test case, J. Hydraul. Eng., 146, 05020003, 10.1061/(ASCE)HY.1943-7900.0001779 · DOI
- Pizarro, 2020, Identifying the optimal spatial distribution of tracers for optical sensing of stream surface flow, Hydrol. Earth Syst. Sci., 24, 5173, 10.5194/hess-24-5173-2020 · DOI
- Pizarro, A., Sasso, S.F.D., Perks, M.T., Manfreda, S., 2020b. Identifying the optimal spatial distribution of tracers for optical sensing of stream surface flow. Hydrol. Earth Syst. Sci. 13. · DOI
- Pumo, 2021, Optical Methods for river monitoring: a simulation-based approach to explore optimal experimental setup for LSPIV, Water, 13, 247, 10.3390/w13030247 · DOI
- Ran, 2016, Application of an automated LSPIV system in a mountainous stream for continuous flood flow measurements, Hydrol. Process., 30, 3014, 10.1002/hyp.10836 · DOI
- Refsgaard, 2004, Modelling guidelines––terminology and guiding principles, Adv. Water Resour., 27, 71, 10.1016/j.advwatres.2003.08.006 · DOI
- Rennie, 2010, Mapping spatial distributions and uncertainty of water and sediment flux in a large gravel bed river reach using an acoustic Doppler current profiler, J. Geophys. Res. Earth Surf., 115, 10.1029/2009JF001556 · DOI
- Sawyer, 2010, Riffle-pool maintenance and flow convergence routing observed on a large gravel-bed river, Geomorphology, 114, 143, 10.1016/j.geomorph.2009.06.021 · DOI
- M. Schumann Andreadis, Rapid Mapping of Small-Scale River-Floodplain Environments Using UAV SfM Supports Classical Theory Remote Sensing 11 2019 982 10.3390/rs11080982. · DOI
- Shannon, 1948, A mathematical theory of communication, Bell Syst. Tech. J., 27, 379, 10.1002/j.1538-7305.1948.tb01338.x · DOI · Paper page
- Shustikova, 2019, Comparing 2D capabilities of HEC-RAS and LISFLOOD-FP on complex topography, Hydrol. Sci. J., 64, 1769, 10.1080/02626667.2019.1671982 · DOI
- Simpson, M.R., 2001. Discharge measurements using a broad-band acoustic Doppler current profiler. US Department of the Interior, US Geological Survey Reston. · DOI
- Smith, 2014, Reconstructing flash flood magnitudes using ‘Structure-from-Motion’: a rapid assessment tool, J. Hydrol., 519, 1914, 10.1016/j.jhydrol.2014.09.078 · DOI
- Stott, 2020, Ground Control point distribution for accurate kilometre-scale topographic mapping using an RTK-GNSS unmanned aerial vehicle and SfM photogrammetry, Drones, 4, 55, 10.3390/drones4030055 · DOI
- Tauro, 2017, Streamflow Observations from cameras: large-scale particle Image velocimetry or particle tracking velocimetry?: STREAMFLOW FROM CAMERAS: LSPIV OR PTV?, Water Resour. Res., 53, 10374, 10.1002/2017WR020848 · DOI
- Thielicke, 2014, PIVlab – Towards user-friendly, affordable and accurate digital particle image velocimetry in MATLAB, J. Open Res. Softw., 2, e30, 10.5334/jors.bl · DOI
- Tiffan, 2002, Quantifying flow-dependent changes in subyearling fall chinook salmon rearing habitat using two-dimensional spatially explicit modeling, North Am. J. Fish. Manage., 22, 713, 10.1577/1548-8675(2002)022<0713:QFDCIS>2.0.CO;2 · DOI
- Tokarczyk, 2015, High-quality observation of surface imperviousness for urban runoff modelling using UAV imagery, Hydrol. Earth Syst. Sci., 19, 4215, 10.5194/hess-19-4215-2015 · DOI
- Welber, 2016, Field assessment of noncontact stream gauging using portable surface velocity radars (SVR): FIELD ASSESSMENT OF PORTABLE SURFACE VELOCITY RADARS, Water Resour. Res., 52, 1108, 10.1002/2015WR017906 · DOI
- Wilcock, 1996, Estimating local bed shear stress from velocity observations, Water Resour. Res., 32, 3361, 10.1029/96WR02277 · DOI
- Wildhaweswater, Site Manager’s Journal: Restoring Swindale Beck. Wild Haweswater 2020 accessed 1.24.21.
- Williams, 2013, Hydraulic validation of two-dimensional simulations of braided river flow with spatially continuous aDcp data, Water Resour. Res., 49, 5183, 10.1002/wrcr.20391 · DOI
- Williams, 2015, Linking the spatial distribution of bed load transport to morphological change during high-flow events in a shallow braided river: Spatially distributed bedload transport, J. Geophys. Res. Earth Surf., 120, 604, 10.1002/2014JF003346 · DOI
- Wing, 2017, Validation of a 30 m resolution flood hazard model of the conterminous United States: 30 m Resolution Flood Model Of Conus, Water Resour. Res., 53, 7968, 10.1002/2017WR020917 · DOI
- Yalcin, 2020, Assessing the impact of topography and land cover data resolutions on two-dimensional HEC-RAS hydrodynamic model simulations for urban flood hazard analysis, Nat Hazards, 101, 995, 10.1007/s11069-020-03906-z · DOI
Cited by
Sorted by citations
Shin, J. H., Go, S. H., & Park, J. H. (2026) · Scientific Reports · doi:10.1038/s41598-026-63704-8
Metadata
- Authors
- Masafu, C., Williams, R., Shi, X., Yuan, Q., & Trigg, M.
- Affiliations
- University of Glasgow (GB)
- Wuhan University (CN)
- University of Leeds (GB)
- Corresponding author
- Masafu, Christopher
- Shi, Xiaogang
- Venue
- Journal of Hydrology
- Publisher
- Elsevier BV
- Published
- 2022-09
- Volume
- 612
- Pages
- 128217
- ISSN
- 0022-1694 (ISSN-L)
- OpenAlex
- W4285809653
- Cited by
- 28
- References
- 0
- Citations by year
- 2026: 11 · 2025: 5 · 2024: 7 · 2023: 4 · 2022: 1
- FWCI
- 2.21
- Type
- journal article
- Language
- en
- Open access
- hybrid
- doi.org
- Licence
- Locations
- Journal of Hydrology (publishedVersion, cc-by)
- ENLIGHTEN (Jurnal Bimbingan dan Konseling Islam) (acceptedVersion, cc-by-sa)
- White Rose Research Online (University of Leeds, The University of Sheffield, University of York) (acceptedVersion)
- Funders
- Natural Environment Research Council
- University of Glasgow
- Topics
- Physical Sciences › Earth and Planetary Sciences › Earth-Surface Processes › Hydrology and Sediment Transport Processes
- Physical Sciences › Engineering › Civil and Structural Engineering › Hydraulic flow and structures
- Physical Sciences › Environmental Science › Global and Planetary Change › Flood Risk Assessment and Management
- Keywords
- large-scale particle image velocimetry, model calibration, river surface velocity, gravel-bed rivers, depth-averaged velocity, probability concepts, velocity distribution, HEC-RAS, acoustic Doppler current profiler, non-invasive flow measurement
About these checks
Registry, retraction, Cites and statistics results are computed, not judged, with one exception: a printed reference that no index lists is read once by a model before it counts as a citation error. Claims are extracted by a model and kept only when their quote appears verbatim in the text; each cited source is then checked, with a model’s help, for whether it says what the claim relies on. Those verdicts can be wrong — read the claim’s quote and the cited source before relying on one.
Statistics and arithmetic are recomputed, not judged.
Confidence bands are shown only for fields calibrated on our annotated test set. None is calibrated yet, so no band is shown.
What counts as a claim ›How we measure confidence ›How we check this ›
Are you an author, or do you see a problem with this page? Request a review
