

The DOI matches its Crossref record; 43 of the 43 references it cites were found in a registry or an index.
Peptide lipidation stabilizes structure to enhance biological function
Open accessAbstract
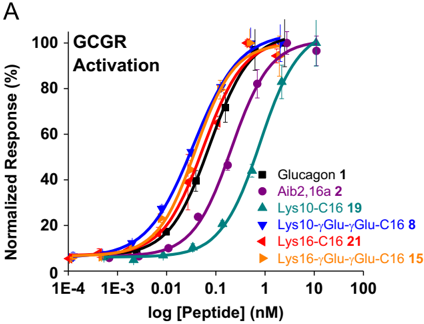
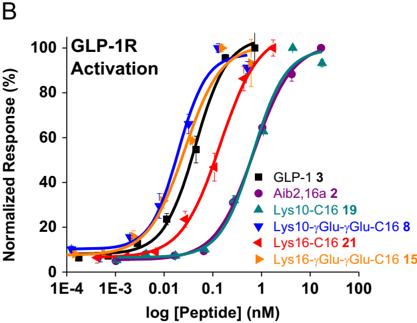
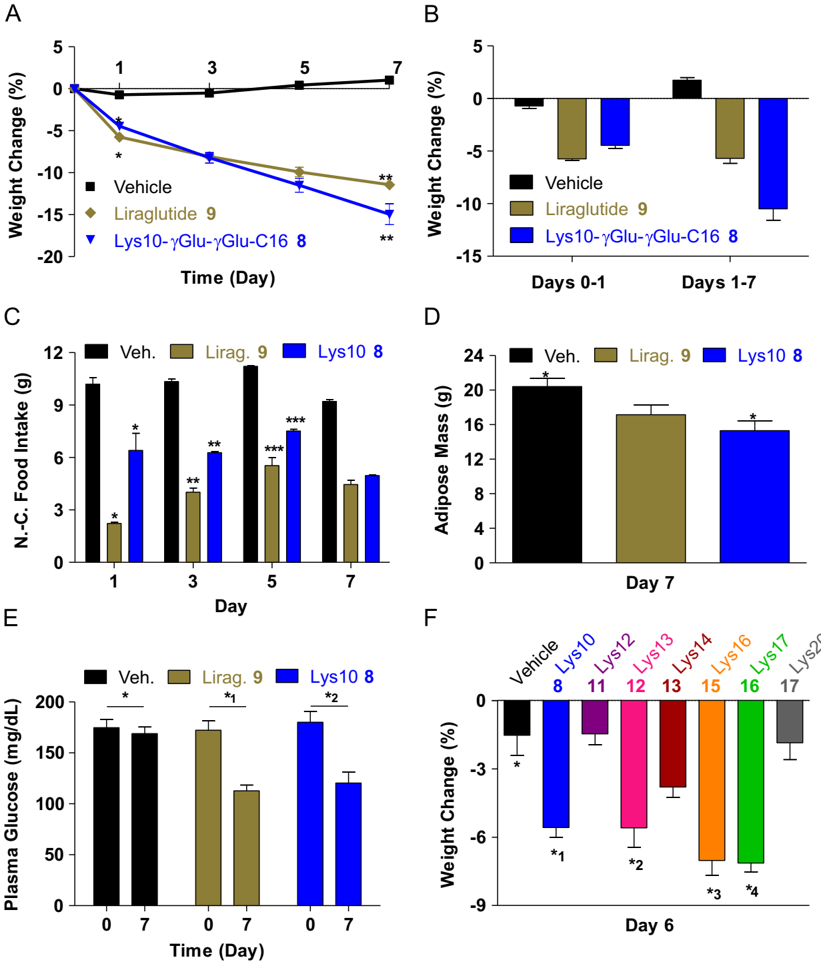
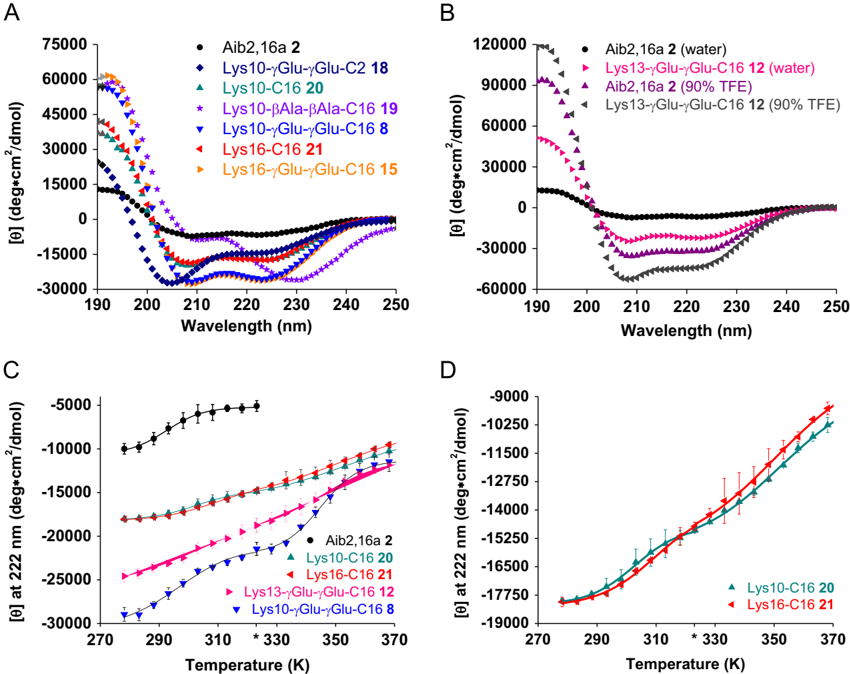
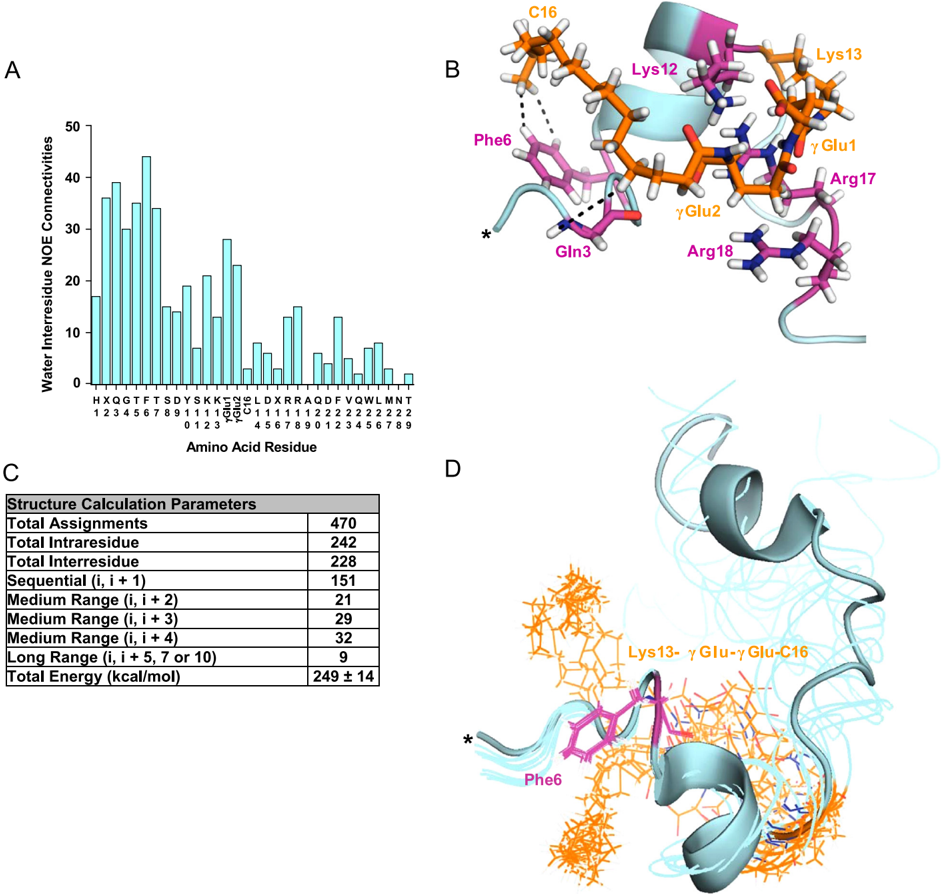
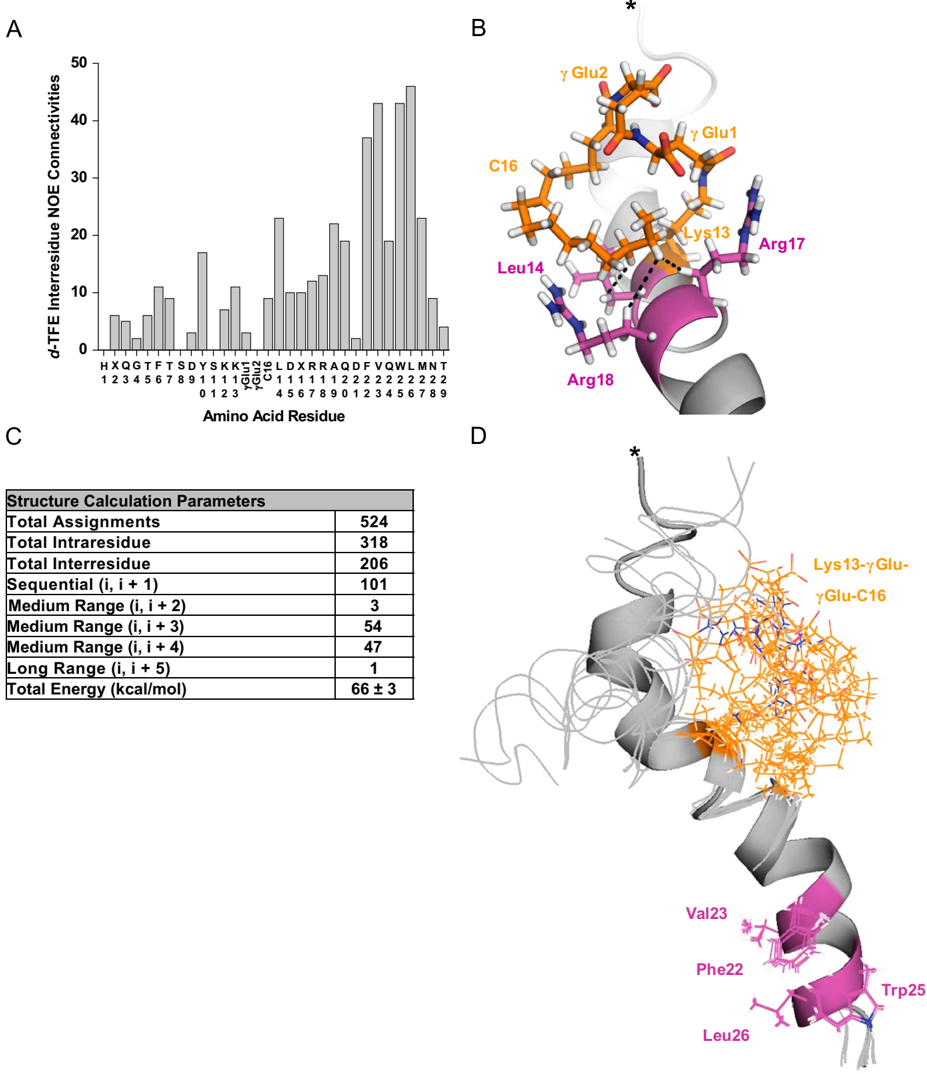
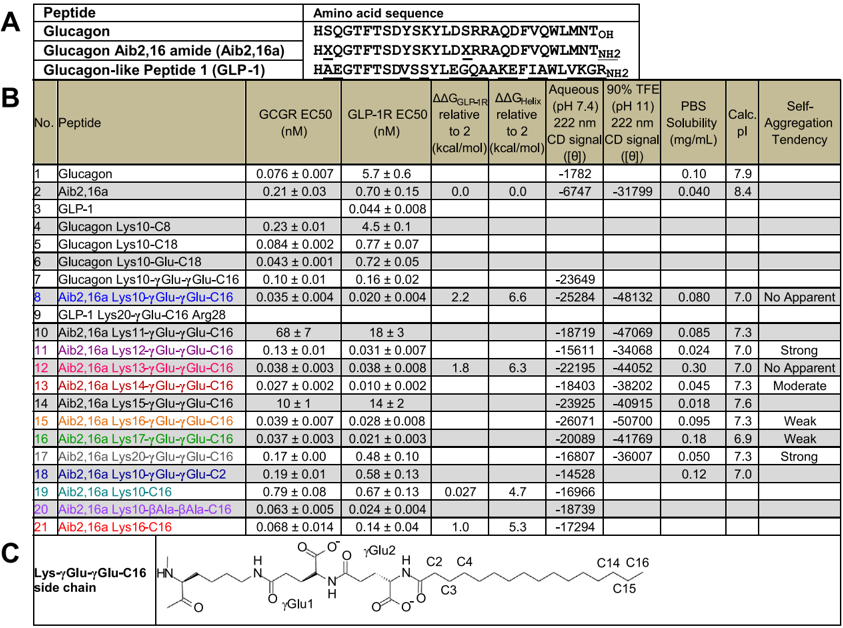
Medicines that decrease body weight and restore nutrient tolerance could improve human diabetes and obesity treatment outcomes. We developed lipid-acylated glucagon analogs that are co-agonists for the glucagon and glucagon-like peptide 1 receptors, and stimulate weight loss and plasma glucose lowering in pre-diabetic obese mice. Our studies identified lipid acylation (lipidation) can increase and balance in vitro potencies of select glucagon analogs for the two aforementioned receptors in a lipidation site-dependent manner. A general capacity for lipidation to enhance the secondary structure of glucagon analogs was recognized, and the energetics of this effect quantified. The molecular structure of a lipid-acylated glucagon analog in water was also characterized. These results support that lipidation can modify biological activity through thermodynamically-favorable intramolecular interactions which stabilize structure. This establishes use of lipidation to achieve specific pharmacology and implicates similar endogenous post-translational modifications as physiological tools capable of refining biological action in means previously underappreciated.
Overview
The claims and statistics of this paper haven’t been checked yet.
Run the check — free, no account needed. It reads the open-access text and checks the sources it cites.
Integrity signals
Registry
Cites
Statistics
Figures
Verification
Claims the paper makes
The claims and statistics of this paper haven’t been checked yet.
Run the check — free, no account needed. It reads the open-access text and checks the sources it cites.
Claims other papers make about this one
Each is checked against this paper’s own text: does it say what the citing paper says it does?
In the citing paper
“Importantly, this demonstrates that the chemical nature of the acylation influences not only the pharmacokinetics of the peptide but also the pharmacophore itself, which further highlights that such modifications are not inert bystanders with respect to biological activity [48] and biodistribution [49].”
From Next generation GLP-1/GIP/glucagon triple agonists normalize body weight in obese mice (2022) · cites this paper as [48]
Self-check
Percentages, sums and reported differences re-computed from the paper’s own numbers.
The self-check needs the paper’s full text.
Citations
Cites
NMRPipe: A multidimensional spectral processing system based on UNIX pipes
Delaglio, F., Grzesiek, S., Vuister, G. W., Zhu, G., Pfeifer, J., & Bax, A. (1995) · Journal of Biomolecular NMR · doi:10.1007/bf00197809 · Cited by 15,961
NMR with Proteins and Nucleic Acids
Wüthrich, K. (1986) · Europhysics news · doi:10.1051/epn/19861701011 · Cited by 8,028
NMR of Proteins and Nucleic Acids
(2006) · Royal Society of Chemistry eBooks · doi:10.1039/9781847555236-00336 · Cited by 5,874
Using circular dichroism spectra to estimate protein secondary structure
Greenfield, N. J. (2006) · Nature Protocols · doi:10.1038/nprot.2006.202 · Cited by 4,123
Solid phase peptide synthesis utilizing 9‐fluorenylmethoxycarbonyl amino acids
Fields, G., & NOBLE, R. L. (1990) · International journal of peptide & protein research · doi:10.1111/j.1399-3011.1990.tb00939.x · Cited by 2,490
The Xplor-NIH NMR molecular structure determination package
Schwieters, C. D., Kuszewski, J. J., Tjandra, N., & Clore, G. M. (2003) · Journal of Magnetic Resonance · doi:10.1016/s1090-7807(02)00014-9 · Cited by 2,371
Ulrich, E. L., Akutsu, H., Doreleijers, J. F., Harano, Y., Ioannidis, Y., Lin, J. C., Livny, M., Mading, S., Maziuk, D., Miller, Z., et al. (2007) · Nucleic Acids Research · doi:10.1093/nar/gkm957 · Cited by 1,472
Molecular and Cellular Endocrinology
Rainey, W. E., & Rodgers, R. J. (2004) · Molecular and Cellular Endocrinology · doi:10.1016/j.mce.2004.10.007 · Cited by 1,340
Greenfield, N. J. (2006) · Nature Protocols · doi:10.1038/nprot.2006.204 · Cited by 886
Knudsen, L. B., Nielsen, P. F., Huusfeldt, P. O., Johansen, N. L., Madsen, K., Pedersen, F. Z., Thøgersen, H., Wilken, M., & Agersø, H. (2000) · Journal of Medicinal Chemistry · doi:10.1021/jm9909645 · Cited by 711
Cited by
Sorted by citations
A rationally designed monomeric peptide triagonist corrects obesity and diabetes in rodents
Finan, B., Yang, B., Ottaway, N., Smiley, D. L., Ma, T., Clemmensen, C., Chabenne, J., Zhang, L., Habegger, K. M., Fischer, K., et al. (2015) · Nature Medicine · doi:10.1038/nm.3761 · Cited by 645
Self-citationFactors affecting the physical stability (aggregation) of peptide therapeutics
Zapadka, K. L., Becher, F. J., dos Santos, A. L. G., & Jackson, S. (2017) · Interface Focus · doi:10.1098/rsfs.2017.0030 · Cited by 425
Prebiotic Peptides: Molecular Hubs in the Origin of Life
Frenkel-Pinter, M., Samanta, M., Ashkenasy, G., & Leman, L. J. (2020) · Chemical Reviews · doi:10.1021/acs.chemrev.9b00664 · Cited by 354
Peptide chemistry toolbox – Transforming natural peptides into peptide therapeutics
Erak, M., Bellmann‐Sickert, K., Els‐Heindl, S., & Beck‐Sickinger, A. G. (2018) · Bioorganic & Medicinal Chemistry · doi:10.1016/j.bmc.2018.01.012 · Cited by 327
Antimicrobial peptides: an alternative for innovative medicines?
da Costa, J. P., Cova, M. M., Ferreira, R. M., & Vitorino, R. M. P. (2015) · Applied Microbiology and Biotechnology · doi:10.1007/s00253-015-6375-x · Cited by 212
Salameh, T. S., Rhea, E. M., Talbot, K., & Banks, W. A. (2020) · Biochemical Pharmacology · doi:10.1016/j.bcp.2020.114187 · Cited by 188
Impact of processing on the chemistry and functionality of food proteins
Aryee, A. N. A., Agyei, D., & Udenigwe, C. C. (2017) · Elsevier eBooks · doi:10.1016/b978-0-08-100722-8.00003-6 · Cited by 187
Targeting the Incretin/Glucagon System With Triagonists to Treat Diabetes
Capozzi, M. E., DiMarchi, R. D., Tschöp, M. H., Finan, B., & Campbell, J. E. (2018) · Endocrine Reviews · doi:10.1210/er.2018-00117 · Cited by 153
Self-citationNext generation GLP-1/GIP/glucagon triple agonists normalize body weight in obese mice
Knerr, P. J., Mowery, S. A., Douros, J. D., Premdjee, B., Hjøllund, K. R., He, Y., Kruse Hansen, A. M., Olsen, A. K., Perez-Tilve, D., DiMarchi, R. D., et al. (2022) · Molecular Metabolism · doi:10.1016/j.molmet.2022.101533 · Cited by 152
Self-citationDerivatization with fatty acids in peptide and protein drug discovery
Kurtzhals, P., Østergaard, S., Nishimura, E., & Kjeldsen, T. (2022) · Nature Reviews Drug Discovery · doi:10.1038/s41573-022-00529-w · Cited by 139
D’Aloisio, V., Dognini, P., Hutcheon, G. A., & Coxon, C. R. (2021) · Drug Discovery Today · doi:10.1016/j.drudis.2021.02.019 · Cited by 125
Design of Novel Exendin-Based Dual Glucagon-like Peptide 1 (GLP-1)/Glucagon Receptor Agonists
Evers, A., Haack, T., Lorenz, M., Bossart, M., Elvert, R., Henkel, B., Stengelin, S., Kurz, M., Glien, M., Dudda, A., et al. (2017) · Journal of Medicinal Chemistry · doi:10.1021/acs.jmedchem.7b00174 · Cited by 101
Peptide Lipidation – A Synthetic Strategy to Afford Peptide Based Therapeutics
Kowalczyk, R., Harris, P. W. R., Williams, G. M., Yang, S., & Brimble, M. A. (2017) · Advances in experimental medicine and biology · doi:10.1007/978-3-319-66095-0_9 · Cited by 103
Transformation of Oligomers of Lipidated Peptide Induced by Change in pH
Wang, Y., Lomakin, A., Kanai, S., Alex, R., & Benedek, G. B. (2015) · Molecular Pharmaceutics · doi:10.1021/mp500519s · Cited by 86
Photo-induced radical thiol–ene chemistry: a versatile toolbox for peptide-based drug design
Ahangarpour, M., Kavianinia, I., Harris, P. W. R., & Brimble, M. A. (2021) · Chemical Society Reviews · doi:10.1039/d0cs00354a · Cited by 87
Protein and Peptide Biopharmaceuticals: An Overview
Agyei, D., Ahmed, I., Akram, Z., Iqbal, H. M. N., & Danquah, M. K. (2017) · Protein and Peptide Letters · doi:10.2174/0929866523666161222150444 · Cited by 85
Engineering a long-acting, potent GLP-1 analog for microstructure-based transdermal delivery
Yang, P., Zou, H., Chao, E., Sherwood, L., Núñez, V., Keeney, M., Ghartey-Tagoe, E. B., Ding, Z., Quirino, H., Luo, X., et al. (2016) · Proceedings of the National Academy of Sciences · doi:10.1073/pnas.1601653113 · Cited by 69
Yang, P., Zou, H., Lee, C., Muppidi, A., Chao, E., Fu, Q., Luo, X., Wang, D., Schultz, P. G., & Shen, W. (2018) · Journal of Medicinal Chemistry · doi:10.1021/acs.jmedchem.7b00768 · Cited by 68
Recent advances in the design of antimicrobial peptide conjugates
Silva, A. R. P., Guimarães, M. D. S., Rabelo, J., Belén, L. H., Perecin, C. J., Farías, J. G., Santos, J. H. P. M., & Rangel‐Yagui, C. D. O. (2022) · Journal of Materials Chemistry B · doi:10.1039/d1tb02757c · Cited by 66
Glycopeptide drugs: A pharmacological dimension between “Small Molecules” and “Biologics”
Apostol, C. R., Hay, M., & Polt, R. L. (2020) · Peptides · doi:10.1016/j.peptides.2020.170369 · Cited by 54
Antimicrobial peptides used as growth promoters in livestock production
Rodrigues, G. R., Maximiano, M. R., & Franco, O. L. (2021) · Applied Microbiology and Biotechnology · doi:10.1007/s00253-021-11540-3 · Cited by 50
Evers, A., Bossart, M., Pfeiffer‐Marek, S., Elvert, R., Schreuder, H., Kurz, M. E., Stengelin, S., Lorenz, M., Herling, A. W., Konkar, A. A., et al. (2018) · Journal of Medicinal Chemistry · doi:10.1021/acs.jmedchem.8b00292 · Cited by 51
Knerr, P. J., Mowery, S. A., Finan, B., Perez-Tilve, D., Tschöp, M. H., & DiMarchi, R. D. (2020) · Peptides · doi:10.1016/j.peptides.2019.170225 · Cited by 49
Self-citationGenetically Encoded Cholesterol-Modified Polypeptides
Mozhdehi, D., Luginbuhl, K. M., Dzuricky, M. J., Costa, S. A., Xiong, S., Huang, F. C., Lewis, M. M., Zelenetz, S. R., Colby, C. D., & Chilkoti, A. (2019) · Journal of the American Chemical Society · doi:10.1021/jacs.8b10687 · Cited by 49
Design of potent and proteolytically stable oxyntomodulin analogs
Muppidi, A., Zou, H., Yang, P. Y., Chao, E., Sherwood, L., Nunez, V., Woods, A. K., Schultz, P. G., Lin, Q., & Shen, W. (2016) · ACS Chemical Biology · doi:10.1021/acschembio.5b00787 · Cited by 44
Faya, M. A., Hazzah, H. A., Omolo, C. A., Agrawal, N., Maji, R., Walvekar, P., Mocktar, C., Nkambule, B. B., Rambharose, S., Alberício, F., et al. (2020) · Amino Acids · doi:10.1007/s00726-020-02903-7 · Cited by 46
Ramos-Álvarez, I., Mantey, S. A., Nakamura, T., Nuche‐Berenguer, B., Moreno, P., Moody, T. W., Maderdrut, J. L., Coy, D. H., & Jensen, R. T. (2015) · Peptides · doi:10.1016/j.peptides.2015.01.009 · Cited by 44
Machine learning designs new GCGR/GLP-1R dual agonists with enhanced biological potency
Puszkarska, A. M., Taddese, B., Revell, J. D., Davies, G., Field, J., Hornigold, D. C., Buchanan, A. G., Vaughan, T. J., & Colwell, L. J. (2024) · Nature Chemistry · doi:10.1038/s41557-024-01532-x · Cited by 42
Wang, Y., Lomakin, A., Kanai, S., Alex, R., Belli, S., Donzelli, M., & Benedek, G. B. (2016) · Journal of Controlled Release · doi:10.1016/j.jconrel.2016.08.035 · Cited by 43
King, K., Lin, N.-P., Cheng, R. Y.-H., Chen, G.-H., & Chein, R. (2015) · Journal of Biological Chemistry · doi:10.1074/jbc.m115.672097 · Cited by 44
Small cyclic agonists of iron regulatory hormone hepcidin
Chua, K. J., Fung, E., Micewicz, E. D., Ganz, T., Nemeth, E., & Ruchala, P. P. (2015) · Bioorganic & Medicinal Chemistry Letters · doi:10.1016/j.bmcl.2015.03.012 · Cited by 39
Isono, A., Tsuji, M., Sanada, Y., Matsushita, A., Masunaga, S., Hirayama, T., & Nagasawa, H. (2019) · ChemMedChem · doi:10.1002/cmdc.201800793 · Cited by 39
Alavi, S. E., Cabot, P. J., Raza, A., & Moyle, P. M. (2021) · Bioconjugate Chemistry · doi:10.1021/acs.bioconjchem.1c00091 · Cited by 37
Lipidization as a tool toward peptide therapeutics
Myšková, A., Sýkora, D., Kuneš, J., & Maletı́nská, L. (2023) · Drug Delivery · doi:10.1080/10717544.2023.2284685 · Cited by 36
Hutchinson, J. A., Hamley, I. W., Torras, J., Alemán, C., Seitsonen, J. J. T., & Ruokolainen, J. (2019) · The Journal of Physical Chemistry B · doi:10.1021/acs.jpcb.8b11097 · Cited by 36
Solid‐Phase Thiol–Ene Lipidation of Peptides for the Synthesis of a Potent CGRP Receptor Antagonist
Williams, E. T., Harris, P. W. R., Jamaluddin, A., Loomes, K. M., Hay, D. L., & Brimble, M. A. (2018) · Angewandte Chemie International Edition · doi:10.1002/anie.201805208 · Cited by 36
Antimicrobial Peptides Controlling Resistant Bacteria in Animal Production
Rodrigues, G. R., dos Santos, L. S., & Franco, O. L. (2022) · Frontiers in Microbiology · doi:10.3389/fmicb.2022.874153 · Cited by 35
Mäde, V., Bellmann‐Sickert, K., Kaiser, A., Meiler, J., & Beck‐Sickinger, A. G. (2014) · ChemMedChem · doi:10.1002/cmdc.201402235 · Cited by 31
Atangcho, L., Navaratna, T. A., & Thurber, G. M. (2018) · Trends in Biochemical Sciences · doi:10.1016/j.tibs.2018.11.008 · Cited by 33
Liu, K., Yang, L., Peng, X., Wang, J., Lu, J. R., & Xu, H. (2020) · Langmuir · doi:10.1021/acs.langmuir.9b03774 · Cited by 31
Korczek, K. R., Tkaczewska, J., Duda, I., & Migdał, W. (2019) · Journal of Aquatic Food Product Technology · doi:10.1080/10498850.2019.1695033 · Cited by 30
Singh, R. S., Mishra, N. K., Singh, N., Rawal, P., Gupta, P., & Joshi, K. B. (2020) · New Journal of Chemistry · doi:10.1039/d0nj01501f · Cited by 30
Mallart, S., Ingenito, R., Bianchi, E., Bresciani, A., Esposito, S., Gallo, M., Magotti, P., Monteagudo, E., Orsatti, L., Roversi, D., et al. (2021) · Journal of Medicinal Chemistry · doi:10.1021/acs.jmedchem.0c01533 · Cited by 29
Lynch, A. M., Pathak, N., Flatt, Y. E., Gault, V. A., O'Harte, F. P. M., Irwin, N., & Flatt, P. R. (2014) · European Journal of Pharmacology · doi:10.1016/j.ejphar.2014.09.018 · Cited by 27
Zhang, L., Navaratna, T. A., & Thurber, G. M. (2016) · Bioconjugate Chemistry · doi:10.1021/acs.bioconjchem.6b00209 · Cited by 27
Adrenomedullin 2.0: Adjusting Key Levers for Metabolic Stability
Schönauer, R. A.-R., Els‐Heindl, S., Fischer, J., Köbberling, J., Riedl, B., & Beck‐Sickinger, A. G. (2016) · Journal of Medicinal Chemistry · doi:10.1021/acs.jmedchem.6b00126 · Cited by 26
Optimization of peptide-based polyagonists for treatment of diabetes and obesity
Knerr, P. J., Finan, B., Gelfanov, V. M., Pérez–Tilve, D., Tschöp, M. H., & DiMarchi, R. D. (2017) · Bioorganic & Medicinal Chemistry · doi:10.1016/j.bmc.2017.10.047 · Cited by 23
Self-citationMikulášková, B., Zemenová, J., Pirník, Z., Pražienková, V., Bednářová, L., Železná, B., Maletı́nská, L., & Kuneš, J. (2015) · Peptides · doi:10.1016/j.peptides.2015.11.005 · Cited by 23
Pickford, P., Lucey, M., Rujan, R., McGlone, E. R., Bitsi, S., Ashford, F. B., Junior, I. R. C., Hodson, D. J., Tomás, A., Deganutti, G., et al. (2021) · Molecular Metabolism · doi:10.1016/j.molmet.2021.101242 · Cited by 21
Kostelnik, K. B., Els‐Heindl, S., Klöting, N., Baumann, S., von Bergen�, M., & Beck‐Sickinger, A. G. (2014) · Bioorganic & Medicinal Chemistry · doi:10.1016/j.bmc.2014.12.008 · Cited by 21
Innovative chemical synthesis and conformational hints on the lipopeptide liraglutide
Guryanov, I., Bondesan, A., Visentini, D., Orlandin, A., Biondi, B., Toniolo, C., Formaggio, F., Ricci, A., Zanon, J., & Cabri, W. (2016) · Journal of Peptide Science · doi:10.1002/psc.2890 · Cited by 21
Figueira, T. N., Mendonça, D. A., Gaspar, D., Melo, M. N., Moscona, A., Porotto, M., Castanho, M. A. R. B., & Veiga, A. S. (2018) · ACS Nano · doi:10.1021/acsnano.8b01422 · Cited by 19
Design of novel Xenopus GLP-1-based dual glucagon-like peptide 1 (GLP-1)/glucagon receptor agonists
Jiang, N., Jing, L., Li, Q., Su, S.-B., Yang, Q., Zhou, F. L., Chen, X., Han, J. D. J., Tang, C., & Tang, W. (2020) · European Journal of Medicinal Chemistry · doi:10.1016/j.ejmech.2020.113118 · Cited by 18
Lāce, I., Cotroneo, E. R., Hesselbarth, N., & Simeth, N. A. (2022) · Journal of Peptide Science · doi:10.1002/psc.3466 · Cited by 17
Zhihong, Y., Chen, W., Qianqian, Z., Lidan, S., Zhou, Q., Han, J. D. J., Wenxi, W., & Bhawal, R. P. (2023) · Peptides · doi:10.1016/j.peptides.2023.170955 · Cited by 17
Structural Refinement of Glucagon for Therapeutic Use
Chabenne, J. R., Mroz, P. A., Mayer, J. P., & DiMarchi, R. D. (2019) · Journal of Medicinal Chemistry · doi:10.1021/acs.jmedchem.9b01493 · Cited by 18
Self-citationDauer, K., Kamm, W., Wagner, K. G., & Pfeiffer‐Marek, S. (2021) · Molecular Pharmaceutics · doi:10.1021/acs.molpharmaceut.0c01028 · Cited by 16
Peptides for biopharmaceutical applications
Agyei, D., Tan, K. X., Pan, S., Udenigwe, C. C., & Danquah, M. K. (2017) · Elsevier eBooks · doi:10.1016/b978-0-08-100736-5.00009-0 · Cited by 18
Solid‐Phase Thiol–Ene Lipidation of Peptides for the Synthesis of a Potent CGRP Receptor Antagonist
Williams, E. T., Harris, P. W. R., Jamaluddin, A., Loomes, K. M., Hay, D. L., & Brimble, M. A. (2018) · Angewandte Chemie · doi:10.1002/ange.201805208 · Cited by 14
Prolonging parathyroid hormone analog action in vitro and in vivo through peptide lipidation
Höppner, J., Noda, H., Anitha, A. K., Cheloha, R. W., Dean, T., Bruce, M., Brooks, D. J., Mannstadt, M., Bouxsein, M., Gellman, S. H., et al. (2025) · Nature Communications · doi:10.1038/s41467-025-59665-7 · Cited by 13
Development of Peptide Biopharmaceuticals in Russia
Deigin, V. I., Poluektova, E. A., Герович, Б. А., Kozin, S. A., & Poluektov, Y. M. (2022) · Pharmaceutics · doi:10.3390/pharmaceutics14040716 · Cited by 13
Wang, X., Zhang, R., Lindaman, B. D., Leeper, C. N., Schrum, A. G., & Ulery, B. D. (2022) · ACS Applied Bio Materials · doi:10.1021/acsabm.1c00981 · Cited by 12
Palani, A., Nawrocki, A. R., Orvieto, F., Bianchi, E., Mandić, E., Pessi, A., Huang, C., Deng, Q., Toussaint, N., Walsh, E., et al. (2022) · ACS Medicinal Chemistry Letters · doi:10.1021/acsmedchemlett.2c00217 · Cited by 11
Design, structure of amphiphilic peptide and its application from single molecule to nanoparticle
Wang, S., Li, Y., Xu, H., Sun, Y., & Xu, S. (2022) · Results in Engineering · doi:10.1016/j.rineng.2022.100747 · Cited by 11
Glutamic acid-based dendritic peptides for scaffold-free cartilage tissue engineering
Sivadas, V. P., Dhawan, S., Babu, J., Haridas, V., & Nair, P. D. (2019) · Acta Biomaterialia · doi:10.1016/j.actbio.2019.09.010 · Cited by 11
Peptides Derived from Vascular Endothelial Growth Factor B Show Potent Binding to Neuropilin‐1
Mota, F., Yelland, T., Hutton, J. A., Parker, J., Patsiarika, A., Chan, A. W. E., O'Leary, A. P., Fotinou, C., Martin, J. F., Zachary, I. C., et al. (2021) · ChemBioChem · doi:10.1002/cbic.202100463 · Cited by 10
Kesharwani, K., Singh, R. S., Tripathi, S. K., Kaul, G., Akhir, A., Saxena, D., Kumar, V., Mishra, N. K., Chopra, S., & Joshi, K. B. (2022) · ChemistrySelect · doi:10.1002/slct.202202234 · Cited by 9
Wolff, M., Schüler, A., Gast, K., Seckler, R., Evers, A., Pfeiffer‐Marek, S., Kurz, M. E., Nagel, N., Haack, T., Wagner, M., et al. (2020) · Molecular Pharmaceutics · doi:10.1021/acs.molpharmaceut.9b01195 · Cited by 8
Panda, C., Kumar, S., Gupta, S. K., & Pandey, L. M. (2024) · Critical Reviews in Biotechnology · doi:10.1080/07388551.2024.2387167 · Cited by 8
Peptides for therapeutic applications – challenges and chances
Ruggirello, C., Mörl, K., & Beck‐Sickinger, A. G. (2024) · Pure and Applied Chemistry · doi:10.1515/pac-2024-0104 · Cited by 7
Huang, C., Wille, C. B., He, H., Reddy, V., Nargund, R. P., Lin, S., & Palani, A. (2017) · Tetrahedron Letters · doi:10.1016/j.tetlet.2017.02.031 · Cited by 7
Lipopeptides as Therapeutics: Applications and In Vivo Quantitative Analysis
Zemenová, J., Sýkora, D., Maletı́nská, L., & Kuneš, J. (2016) · Bioanalysis · doi:10.4155/bio-2016-0206 · Cited by 7
Design of stapled oxyntomodulin analogs containing functionalized biphenyl cross-linkers
Tian, Y., Zou, H., An, P., Zhou, Z., Shen, W., & Lin, Q. (2018) · Tetrahedron · doi:10.1016/j.tet.2018.11.060 · Cited by 8
Biswas, K., Ilyas, H., Datta, A., & Bhunia, A. (2019) · Current Medicinal Chemistry · doi:10.2174/0929867326666190624090817 · Cited by 6
Giannetti, M., Palleschi, A., Ricciardi, B., & Venanzi, M. (2023) · Molecules · doi:10.3390/molecules28227536 · Cited by 5
Jiménez-Martí, E., Hurtado-Genovés, G., Aguilar-Ballester, M., Martínez‐Hervás, S., & Navarro, H. G. (2022) · Nutrients · doi:10.3390/nu14183775 · Cited by 6
A Survey and Guide to the Development of Fatty Acid‐derivatized Peptide Therapeutics
Jacobsen, M. T., Poulsen, C., Kopp, K. L., Olsen, J., & Cox, N. (2025) · Peptide Science · doi:10.1002/9781119824701.ch07 · Cited by 5
Yu, M., Zhang, C., Xu, H., Dong, Y., Zhu, H., Xia, C., & Feng, J. (2025) · Scientific Reports · doi:10.1038/s41598-025-94014-0 · Cited by 5
Cyclic Peptides in Modern Drug Discovery: Trends and Therapeutic Directions
Thite, T., Iyer, K. A., Jain, P., Sasso, J. M., Tenchov, R., Murmu, S., Surendranath, M., Maind, A., Balande, U., & Zhou, Q. A. (2026) · Journal of Medicinal Chemistry · doi:10.1021/acs.jmedchem.6c01522 · Cited by 6
Makowska, M., Prahl, A., & Małuch, I. (2019) · Postępy Biochemii · doi:10.18388/pb.2019_280 · Cited by 4
Discovery of a Long-Acting Parathyroid Hormone 1–34 Analogue to Treat Hypoparathyroidism
Ruan, S., Gui-ying, Y., Dong, Y., Shangguan, W., & Lu, W. (2021) · Molecular Pharmaceutics · doi:10.1021/acs.molpharmaceut.1c00149 · Cited by 4
Méndez, L. R., Rodríguez-Cornejo, T., Rodríguez‐Ramos, T., Al-Hussinee, L., Velázquez, J., Campbell, J. H., Carpio, Y., Estrada, M. P., & Dixon, B. (2024) · Fish & Shellfish Immunology · doi:10.1016/j.fsi.2024.109512 · Cited by 3
Evolution of Peptide Biopharmaceuticals
Иванов, В. Т., & Deigin, V. I. (2023) · Биоорганическая химия · doi:10.31857/s0132342323030120 · Cited by 3
Xu, Y., & Kuipers, O. P. (2025) · ACS Synthetic Biology · doi:10.1021/acssynbio.5c00132 · Cited by 4
Prabhu, A., Pise, N., Raheja, R., & Dhala, I. (2022) · Current Protein and Peptide Science · doi:10.2174/1389203723666220908150054 · Cited by 3
Strnadová, V., Morgan, A., Škrlová, M., Haasová, E., Bardová, K., Myšková, A., Sýkora, D., Kuneš, J., Železná, B., & Maletı́nská, L. (2024) · Neuropeptides · doi:10.1016/j.npep.2024.102417 · Cited by 3
Max Bergmann award lecture:Macromolecular medicinal chemistry as applied to metabolic diseases
DiMarchi, R. D., Mayer, J. P., Gelfanov, V. M., & Tschöp, M. H. (2018) · Journal of Peptide Science · doi:10.1002/psc.3056 · Cited by 2
Self-citationEvolution of Peptide Drug Biopharmaceutics
Иванов, В. Т., & Deigin, V. I. (2023) · Russian Journal of Bioorganic Chemistry · doi:10.1134/s1068162023030123 · Cited by 2
Singh, S. S., Calvo, R., Kumari, A., Sable, R. V., Fang, Y., Tao, D., Hu, X., Castle, S. G., Nahar, S., Li, D., et al. (2024) · Molecular Cancer Therapeutics · doi:10.1158/1535-7163.mct-23-0790 · Cited by 2
Lipidation Effect on Surface Adsorption and Associated Fibrillation of the Model Protein Insulin
Hedegaard, S. F., Cárdenas, M., Barker, R. D., Jørgensen, L., & van de Weert, M. (2016) · Langmuir · doi:10.1021/acs.langmuir.6b00522 · Cited by 2
Poupart, J., Hou, X., Chemtob, S., & Lubell, W. D. (2019) · Molecules · doi:10.3390/molecules24224141 · Cited by 2
Santoro, A., Macis, M., D’Ursi, A. M., & Ricci, A. (2026) · Molecules · doi:10.3390/molecules31152556 · Cited by 1
He, R., Mowery, S. A., Chabenne, J. R., Finan, B., Mayer, J. P., & DiMarchi, R. D. (2021) · Frontiers in Endocrinology · doi:10.3389/fendo.2021.693958 · Cited by 1
Self-citationMolecular Imaging Agent Design for Quantifying Beta Cell Mass in Type 1 Diabetes
Zhang, L. (2017) · Deep Blue (University of Michigan)
Atangcho, L. (2020) · Deep Blue (University of Michigan)
Chemistry and sources of protein
Kumar, V., Ragaza, J. A., & Glencross, B. D. (2025) · Elsevier eBooks · doi:10.1016/b978-0-323-90873-3.00017-8
Incorporation of D-amino Acids and Ornithines into Tirzepatide by Biosynthesis in E. Coli
Xu, Y., Fu, Y., & Kuipers, O. P. (2026) · International Journal of Peptide Research and Therapeutics · doi:10.1007/s10989-026-10813-7
Chemical dialogues at the peanut root microbiome interface orchestrate microbial signaling networks
Gelaye, Y. (2026) · Discover Agriculture · doi:10.1007/s44279-026-00584-6
Lipidated peptides and the limits of chemical control
Roque‐Borda, C. A., Sharma, A., Pavan, F. R., de la Torre, B. G., & Alberício, F. (2026) · Frontiers in Chemistry · doi:10.3389/fchem.2026.1807712
Metadata
- Authors
- Ward, B. P., Ottaway, N. L., Perez-Tilve, D., Ma, D., Gelfanov, V. M., Tschöp, M. H., & DiMarchi, R. D.
- Affiliations
- Indiana University Bloomington (US)
- University of Cincinnati (US)
- Helmholtz Munich (DE)
- Corresponding author
- Ward, Brian P.
- Venue
- Molecular Metabolism
- Publisher
- Elsevier BV
- Published
- 2013-11
- Volume
- 2
- Issue
- 4
- Pages
- 468-479
- ISSN
- 2212-8778 (ISSN-L)
- PMC
- PMC3854995
- OpenAlex
- W2047944726
- Cited by
- 101
- References
- 43
- Citations by year
- 2026: 6 · 2025: 5 · 2024: 7 · 2023: 5 · 2022: 12 · 2021: 10 · 2020: 9 · 2019: 10 · 2018: 10 · 2017: 9 · 2016: 8 · 2015: 6 · 2014: 4
- FWCI
- 4.99
- Type
- journal article
- Language
- en
- Open access
- gold
- doi.org
- Licence
- Locations
- Molecular Metabolism (publishedVersion, cc-by-nc-sa)
- Europe PMC (PubMed Central) (publishedVersion)
- PubMed Central (publishedVersion)
- PubMed (publishedVersion)
- Site cant be reached (submittedVersion, cc-by-nc-nd)
- Topics
- Health Sciences › Medicine › Endocrinology, Diabetes and Metabolism › Diabetes Treatment and Management
- Health Sciences › Medicine › Endocrinology, Diabetes and Metabolism › Pancreatic function and diabetes
- Physical Sciences › Chemistry › Organic Chemistry › Chemical Synthesis and Analysis
- Keywords
- glucagon receptor, GLP-1 receptor, weight loss, blood glucose reduction, obesity, diabetes mellitus, prediabetes, intramolecular interactions, post-translational modification, structure-activity relationship
About these checks
Registry, retraction, Cites and statistics results are computed, not judged, with one exception: a printed reference that no index lists is read once by a model before it counts as a citation error. Claims are extracted by a model and kept only when their quote appears verbatim in the text; each cited source is then checked, with a model’s help, for whether it says what the claim relies on. Those verdicts can be wrong — read the claim’s quote and the cited source before relying on one.
Statistics and arithmetic are recomputed, not judged.
Confidence bands are shown only for fields calibrated on our annotated test set. None is calibrated yet, so no band is shown.
What counts as a claim ›How we measure confidence ›How we check this ›
Are you an author, or do you see a problem with this page? Request a review
