Cited by 191Gastrointestinal motility and disordersIon Channels and ReceptorsRegulation of Appetite and Obesity

The DOI matches its Crossref record; 85 of the 85 references it cites were found in a registry or an index.

Profiling of G protein-coupled receptors in vagal afferents reveals novel gut-to-brain sensing mechanisms

Open access

Abstract

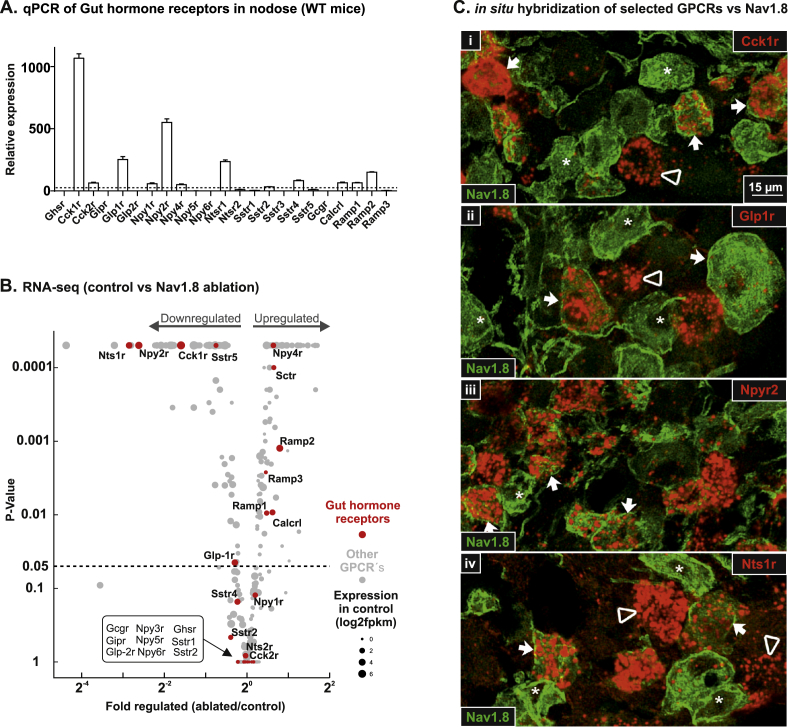
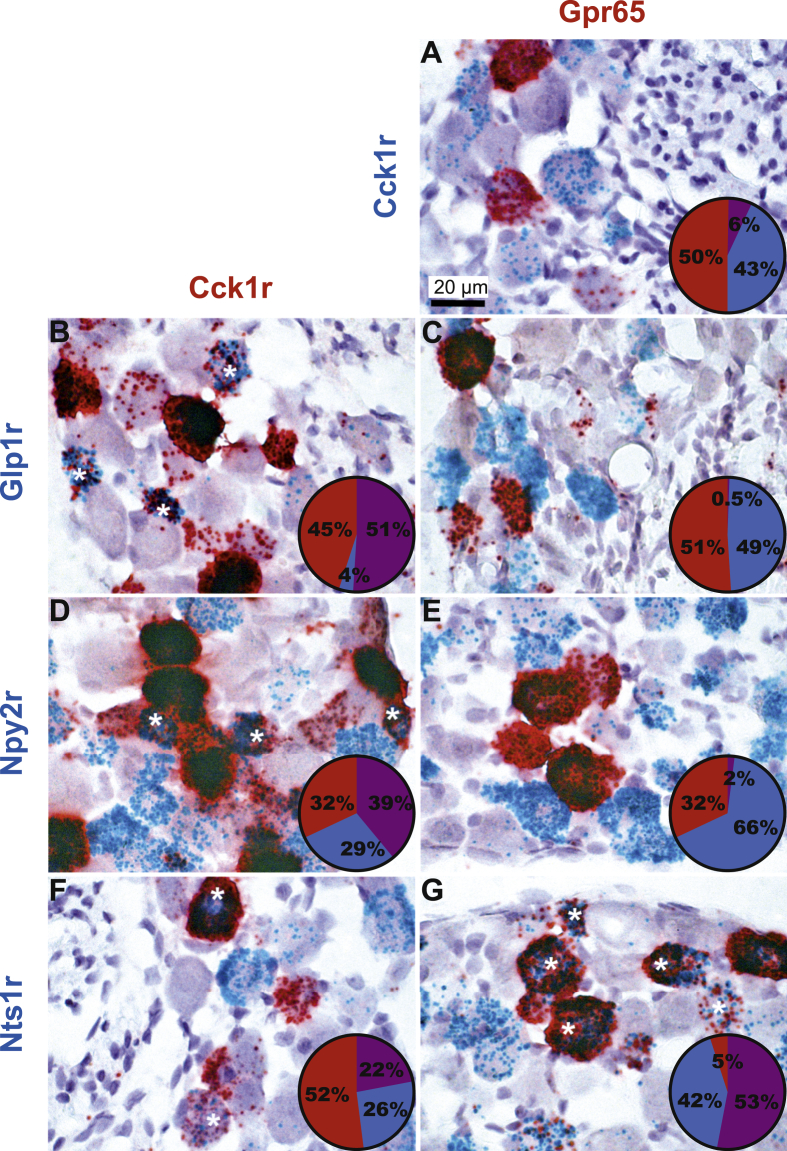
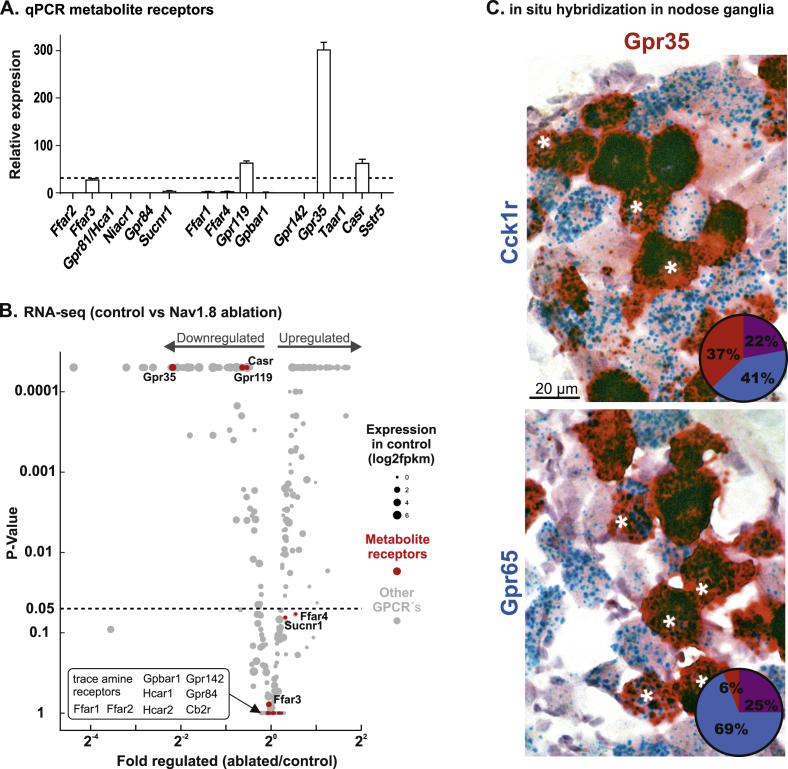
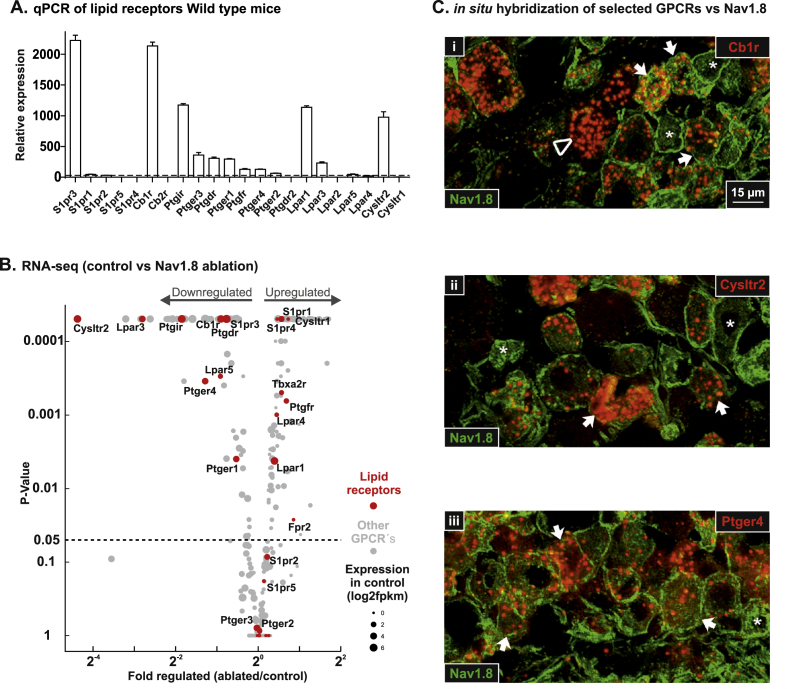
G protein-coupled receptors (GPCRs) act as transmembrane molecular sensors of neurotransmitters, hormones, nutrients, and metabolites. Because unmyelinated vagal afferents richly innervate the gastrointestinal mucosa, gut-derived molecules may directly modulate the activity of vagal afferents through GPCRs. However, the types of GPCRs expressed in vagal afferents are largely unknown. Here, we determined the expression profile of all GPCRs expressed in vagal afferents of the mouse, with a special emphasis on those innervating the gastrointestinal tract. Using a combination of high-throughput quantitative PCR, RNA sequencing, and in situ hybridization, we systematically quantified GPCRs expressed in vagal unmyelinated Nav1.8-expressing afferents. GPCRs for gut hormones that were the most enriched in Nav1.8-expressing vagal unmyelinated afferents included NTSR1, NPY2R, CCK1R, and to a lesser extent, GLP1R, but not GHSR and GIPR. Interestingly, both GLP1R and NPY2R were coexpressed with CCK1R. In contrast, NTSR1 was coexpressed with GPR65, a marker preferentially enriched in intestinal mucosal afferents. Only few microbiome-derived metabolite sensors such as GPR35 and, to a lesser extent, GPR119 and CaSR were identified in the Nav1.8-expressing vagal afferents. GPCRs involved in lipid sensing and inflammation (e.g. CB1R, CYSLTR2, PTGER4), and neurotransmitters signaling (CHRM4, DRD2, CRHR2) were also highly enriched in Nav1.8-expressing neurons. Finally, we identified 21 orphan GPCRs with unknown functions in vagal afferents. Overall, this study provides a comprehensive description of GPCR-dependent sensing mechanisms in vagal afferents, including novel coexpression patterns, and conceivably coaction of key receptors for gut-derived molecules involved in gut-brain communication.

Overview

The claims and statistics of this paper haven’t been checked yet.

Run the check — free, no account needed. It reads the open-access text and checks the sources it cites.

A few free checks a day · papers already verified open instantly · results are public

Integrity signals

Registry

Crossref · 10.1016/j.molmet.2018.03.016

Cites

85 of 85 references verified0 citation errors · 0 not checkable

Statistics

Figures

Figure 1 Gut hormone receptors expression and enrichment in NaV1.8-expressing vagal afferents. (A) Expression level of gut hormone receptors in vagal afferent (whole nodose ganglion) of wild-type (WT) mice, the dotted line indicates the median for GPCRs expression. (B) Volcano plot for the fold change of expression level for 408 GPCRs (gray dots) in NaV1.8 neurons ablated vs. control mice. Gut hormone receptors are shown in red with corresponding names, the size of the dots relate to the expression level prior of ablation. (C) In situ hybridization of selected gut hormone receptors (i; Cck1r, ii; Glp1r, iii; Npyr2 and iv; Ntsr1) in red vs. immunohistochemical detection of YFP in the nodose ganglion of NaV1.8 reporter mice (Nav1.8-Cre-ChR2-YFP) in green. Asterisks indicate representative NaV1.8 positive cells. Triangles and arrows indicate examples of gut hormone receptor positive cells and double positive cells, respectively.
Figure 1 Gut hormone receptors expression and enrichment in NaV1.8-expressing vagal afferents. (A) Expression level of gut hormone receptors in vagal afferent (whole nodose ganglion) of wild-type (WT) mice, the dotted line indicates the median for GPCRs expression. (B) Volcano plot for the fold change of expression level for 408 GPCRs (gray dots) in NaV1.8 neurons ablated vs. control mice. Gut hormone receptors are shown in red with corresponding names, the size of the dots relate to the expression level prior of ablation. (C) In situ hybridization of selected gut hormone receptors (i; Cck1r, ii; Glp1r, iii; Npyr2 and iv; Ntsr1) in red vs. immunohistochemical detection of YFP in the nodose ganglion of NaV1.8 reporter mice (Nav1.8-Cre-ChR2-YFP) in green. Asterisks indicate representative NaV1.8 positive cells. Triangles and arrows indicate examples of gut hormone receptor positive cells and double positive cells, respectively.CC BY-NC-ND · PubMed Central
Figure 2 Double chromogenic in situ hybridization for gut hormone receptors. A, C, E, and G in situ hybridization for Gpr65 in red vs. Cck1r, Glp1r, Npy2r, or Ntsr1 in blue. B, D, F in situ hybridization for Cck1r in red vs. Glp1r, Npy2r, orNtsr1 in blue. Asterisks indicate representative double-labeled cell profiles. Pie charts give the percentage of single positive cells (red or blue) and double positive cells (purple). Bright-field images were collected from the nodose ganglion of wild-type mice. Tissue was counterstained with hematoxylin.
Figure 2 Double chromogenic in situ hybridization for gut hormone receptors. A, C, E, and G in situ hybridization for Gpr65 in red vs. Cck1r, Glp1r, Npy2r, or Ntsr1 in blue. B, D, F in situ hybridization for Cck1r in red vs. Glp1r, Npy2r, orNtsr1 in blue. Asterisks indicate representative double-labeled cell profiles. Pie charts give the percentage of single positive cells (red or blue) and double positive cells (purple). Bright-field images were collected from the nodose ganglion of wild-type mice. Tissue was counterstained with hematoxylin.CC BY-NC-ND · PubMed Central
Figure 3 Metabolite receptors expression and enrichment in NaV1.8-expressing vagal afferents. (A) Expression level of metabolite receptors in vagal afferents (whole nodose ganglion) of wild-type (WT) mice. The dotted line indicates the median for GPCRs expression. (B) Volcano plot for the fold change of expression level, for 408 GPCRs (gray dots) in NaV1.8 neurons ablated vs. control mice. Metabolite receptors are shown in red with corresponding names, the size of the dots relate to the expression level prior of ablation. (C) in situ hybridization for Gpr35 in red vs Cck1r and Gpr65 in blue. Pie charts give the percentage of single positive cells (red or blue) and double positive cells (purple).
Figure 3 Metabolite receptors expression and enrichment in NaV1.8-expressing vagal afferents. (A) Expression level of metabolite receptors in vagal afferents (whole nodose ganglion) of wild-type (WT) mice. The dotted line indicates the median for GPCRs expression. (B) Volcano plot for the fold change of expression level, for 408 GPCRs (gray dots) in NaV1.8 neurons ablated vs. control mice. Metabolite receptors are shown in red with corresponding names, the size of the dots relate to the expression level prior of ablation. (C) in situ hybridization for Gpr35 in red vs Cck1r and Gpr65 in blue. Pie charts give the percentage of single positive cells (red or blue) and double positive cells (purple).CC BY-NC-ND · PubMed Central
Figure 4 Lipid receptors expression and enrichment in NaV1.8-expressing vagal afferents. (A) Expression level of lipid receptors in vagal afferent (whole nodose ganglion) of WT mice, the dotted line indicates the median for GPCRs expression. (B) Volcano plot for the fold change of expression level for 408 GPCRs (gray dots) in NaV1.8 neurons ablated vs. control mice. Lipid receptors are shown in red with corresponding names, the size of the dots relate to the expression level prior of ablation. (C) In situ hybridization of selected lipid receptors (i; Cb1r, ii; Cysltr2, iii; Ptger4) in red vs. immunohistochemical detection of YFP in the nodose ganglion of NaV1.8 reporter mice (Nav1.8-Cre-ChR2-YFP) in green. Asterisks indicate representative NaV1.8 positive cells. Triangles and arrows indicate examples of lipid receptor positive cells and double positive cells, respectively.
Figure 4 Lipid receptors expression and enrichment in NaV1.8-expressing vagal afferents. (A) Expression level of lipid receptors in vagal afferent (whole nodose ganglion) of WT mice, the dotted line indicates the median for GPCRs expression. (B) Volcano plot for the fold change of expression level for 408 GPCRs (gray dots) in NaV1.8 neurons ablated vs. control mice. Lipid receptors are shown in red with corresponding names, the size of the dots relate to the expression level prior of ablation. (C) In situ hybridization of selected lipid receptors (i; Cb1r, ii; Cysltr2, iii; Ptger4) in red vs. immunohistochemical detection of YFP in the nodose ganglion of NaV1.8 reporter mice (Nav1.8-Cre-ChR2-YFP) in green. Asterisks indicate representative NaV1.8 positive cells. Triangles and arrows indicate examples of lipid receptor positive cells and double positive cells, respectively.CC BY-NC-ND · PubMed Central
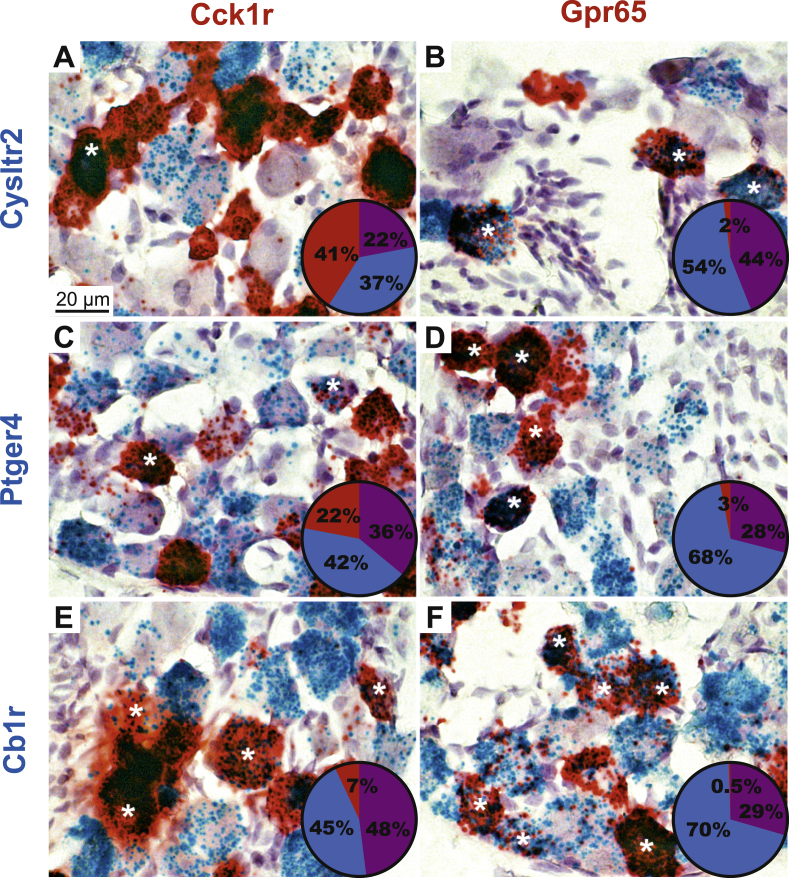
Figure 5 Double chromogenic in situ hybridization of lipid receptors. A, C, and E in situ for Cck1r in red vs. Cysltr2, Ptger4, Cb1r in blue. B, D, and F in situ for Gpr65 (a marker for gastrointestinal mucosa) in red vs. Cysltr2, Ptger4, Cb1r in blue. Asterisks indicate representative double-labeled cell profiles. Pie charts give the percentage of single positive cells (red or blue) and double positive cells (purple). Bright-field images were collected from the nodose ganglion of wild-type mice. Tissue was counterstained with hematoxylin.
Figure 5 Double chromogenic in situ hybridization of lipid receptors. A, C, and E in situ for Cck1r in red vs. Cysltr2, Ptger4, Cb1r in blue. B, D, and F in situ for Gpr65 (a marker for gastrointestinal mucosa) in red vs. Cysltr2, Ptger4, Cb1r in blue. Asterisks indicate representative double-labeled cell profiles. Pie charts give the percentage of single positive cells (red or blue) and double positive cells (purple). Bright-field images were collected from the nodose ganglion of wild-type mice. Tissue was counterstained with hematoxylin.CC BY-NC-ND · PubMed Central
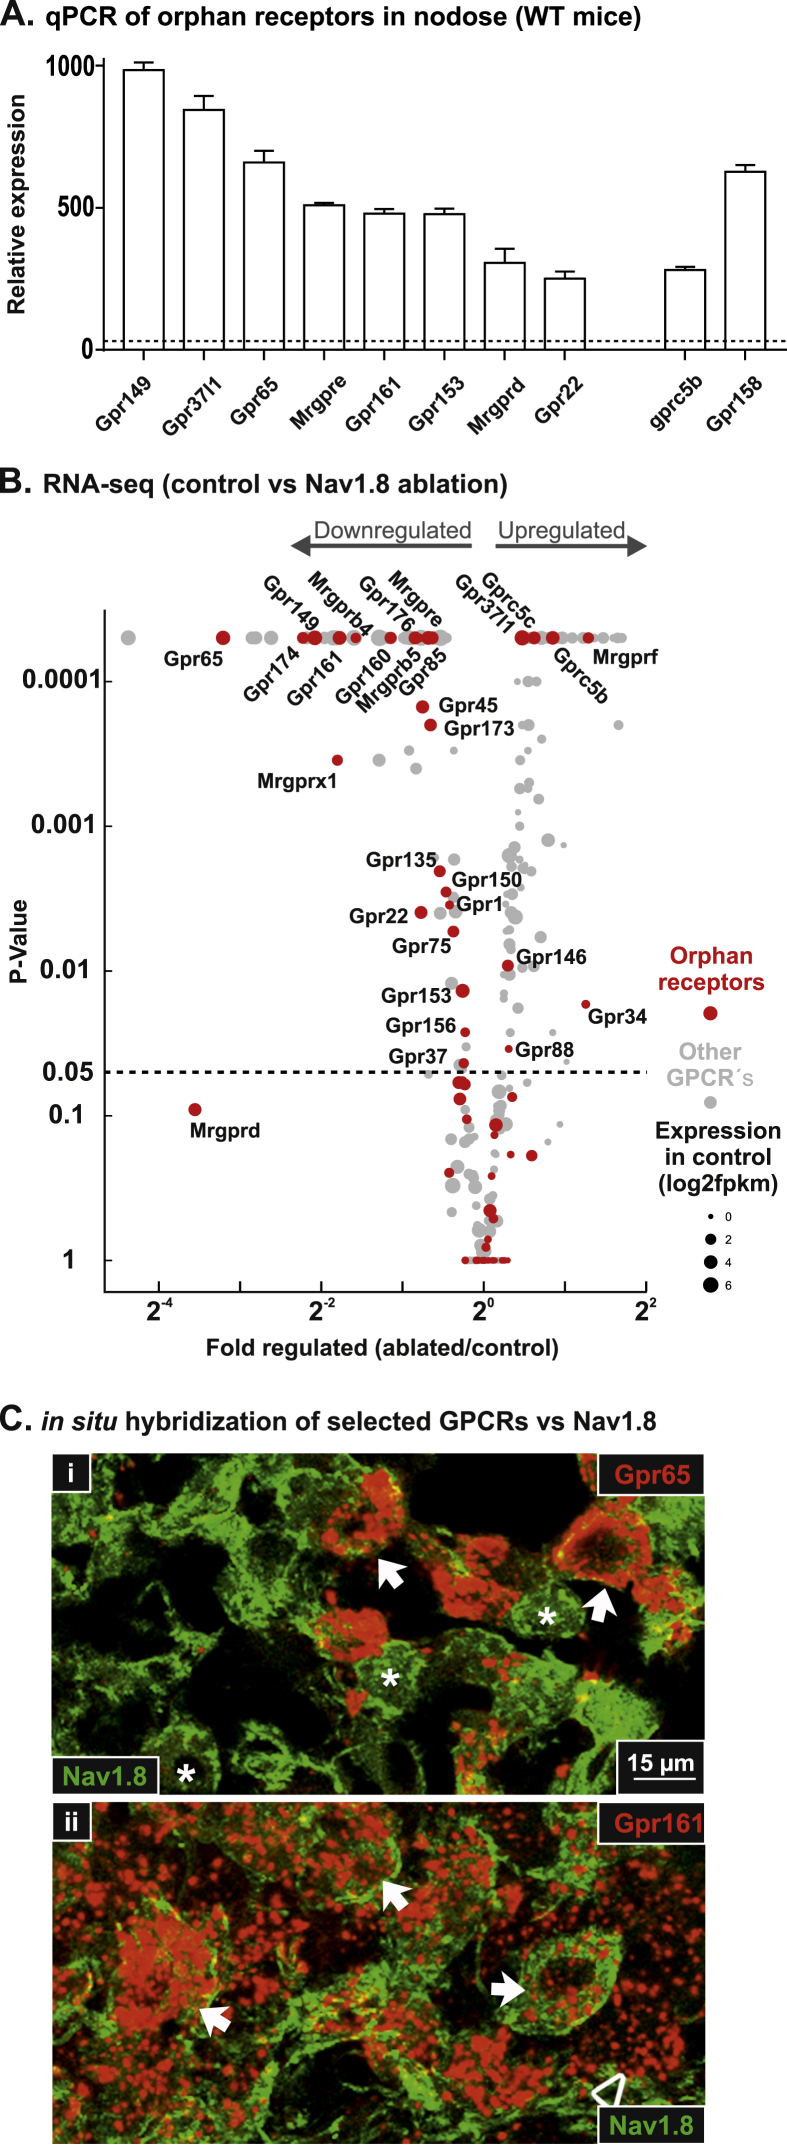
Figure 6 Orphan receptors expression and enrichment in NaV1.8-expressing vagal afferents. (A) Expression level of selected orphan receptors in vagal afferent (whole nodose ganglion) of wild-type (WT) mice. The dotted line indicates the median for GPCRs expression. (B) Volcano plot for the fold change of expression level for 408 GPCRs (gray dots) in NaV1.8 neurons ablated vs. control mice. Orphan receptors are shown in red with corresponding names, the size of the dots relate to the expression level prior of ablation. (C) In situ hybridization of selected orphan receptors (i; Gpr65 and ii; Gpr161) in red vs. immunohistochemical detection of YFP in the nodose ganglion of NaV1.8 reporter mice (Nav1.8-Cre-ChR2-YFP) in green. Asterisks indicate representative NaV1.8 positive cells. Triangles and arrows indicate examples of orphan receptor positive cells and double positive cells, respectively.
Figure 6 Orphan receptors expression and enrichment in NaV1.8-expressing vagal afferents. (A) Expression level of selected orphan receptors in vagal afferent (whole nodose ganglion) of wild-type (WT) mice. The dotted line indicates the median for GPCRs expression. (B) Volcano plot for the fold change of expression level for 408 GPCRs (gray dots) in NaV1.8 neurons ablated vs. control mice. Orphan receptors are shown in red with corresponding names, the size of the dots relate to the expression level prior of ablation. (C) In situ hybridization of selected orphan receptors (i; Gpr65 and ii; Gpr161) in red vs. immunohistochemical detection of YFP in the nodose ganglion of NaV1.8 reporter mice (Nav1.8-Cre-ChR2-YFP) in green. Asterisks indicate representative NaV1.8 positive cells. Triangles and arrows indicate examples of orphan receptor positive cells and double positive cells, respectively.CC BY-NC-ND · PubMed Central
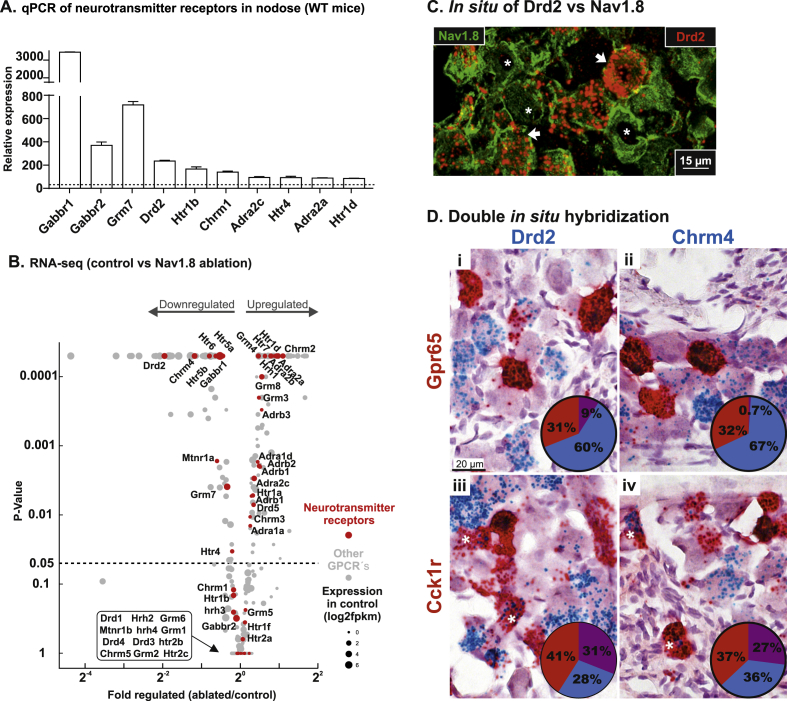
Figure 7 Neurotransmitter receptors expression and enrichment in NaV1.8-expressing vagal afferents. (A) Expression level of selected neurotransmitter receptors in vagal afferent (whole nodose ganglion) of WT mice, the dotted line indicates the median for GPCRs expression. (B) Volcano plot for the fold change of expression level for 408 GPCRs (gray dots) in NaV1.8 neurons ablated vs. control mice. Neurotransmitter receptors are shown in red with corresponding names, the size of the dots relate to the expression level prior of ablation. (C) In situ hybridization of Drd2 in red vs. immunohistochemical detection of YFP in the nodose ganglion of NaV1.8 reporter mice (Nav1.8-Cre-ChR2-YFP) in green. Asterisks indicate NaV1.8 positive cells triangles indicate neurotransmitter receptor positive cells and arrows indicate double positive cells. (D) Double in situ hybridizations for-for Drd2 in blue vs. Gpr65 and Cck1r in red (i; iii) or for Chrm4 in blue vs. Gpr65 and Cck1r in red (ii; iv). Pie charts give the percentage of single positive cells (red and blue) and double positive (purple).
Figure 7 Neurotransmitter receptors expression and enrichment in NaV1.8-expressing vagal afferents. (A) Expression level of selected neurotransmitter receptors in vagal afferent (whole nodose ganglion) of WT mice, the dotted line indicates the median for GPCRs expression. (B) Volcano plot for the fold change of expression level for 408 GPCRs (gray dots) in NaV1.8 neurons ablated vs. control mice. Neurotransmitter receptors are shown in red with corresponding names, the size of the dots relate to the expression level prior of ablation. (C) In situ hybridization of Drd2 in red vs. immunohistochemical detection of YFP in the nodose ganglion of NaV1.8 reporter mice (Nav1.8-Cre-ChR2-YFP) in green. Asterisks indicate NaV1.8 positive cells triangles indicate neurotransmitter receptor positive cells and arrows indicate double positive cells. (D) Double in situ hybridizations for-for Drd2 in blue vs. Gpr65 and Cck1r in red (i; iii) or for Chrm4 in blue vs. Gpr65 and Cck1r in red (ii; iv). Pie charts give the percentage of single positive cells (red and blue) and double positive (purple).CC BY-NC-ND · PubMed Central
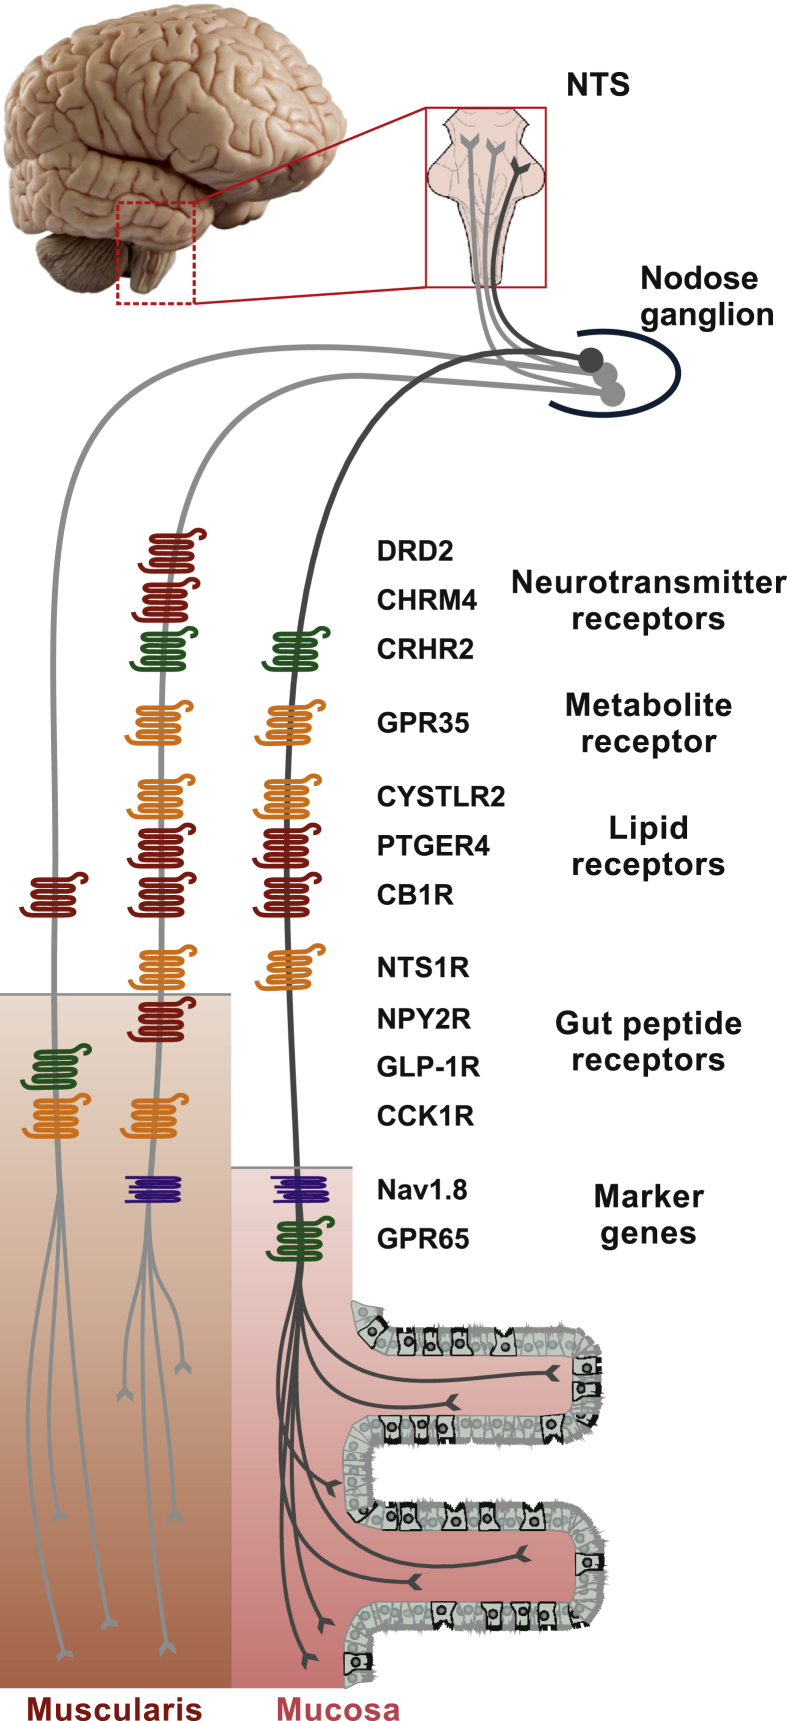
Figure 8 Schematic overview of GPCRs enriched in gastrointestinal vagal afferents. This study identified several GPCRs preferentially enriched in unmyelinated vagal afferents (Nav1.8). Identified receptors encompassed a wide range of GPCRs families including receptors for neurotransmitters, metabolites, lipids, and gut peptides. We further inferred their localization in neurons projecting preferentially to either the gastrointestinal muscularis CCK1 and GLP-1 receptor expressing fibers or the mucosa GPR65 expressing fibers based on Williams and coworkers [7] and our results. Strikingly, most receptors showed a relatively widespread distribution in both categories of neurons. Receptors in green (Gαs-coupled) and orange (Gαq-coupled) are anticipated to stimulate neuronal activity. Those in red (Gαi-coupled) are anticipated to inhibit neuronal activity. Nonetheless, the downstream signaling pathways of these receptors are not known with certainty in vagal afferents. Of note, only receptors found to be mostly highly enriched in unmyelinated vagal afferents are listed here. For the purpose of simplification, orphan receptors were not indicated. NTS, nucleus of the solitary tract.
Figure 8 Schematic overview of GPCRs enriched in gastrointestinal vagal afferents. This study identified several GPCRs preferentially enriched in unmyelinated vagal afferents (Nav1.8). Identified receptors encompassed a wide range of GPCRs families including receptors for neurotransmitters, metabolites, lipids, and gut peptides. We further inferred their localization in neurons projecting preferentially to either the gastrointestinal muscularis CCK1 and GLP-1 receptor expressing fibers or the mucosa GPR65 expressing fibers based on Williams and coworkers [7] and our results. Strikingly, most receptors showed a relatively widespread distribution in both categories of neurons. Receptors in green (Gαs-coupled) and orange (Gαq-coupled) are anticipated to stimulate neuronal activity. Those in red (Gαi-coupled) are anticipated to inhibit neuronal activity. Nonetheless, the downstream signaling pathways of these receptors are not known with certainty in vagal afferents. Of note, only receptors found to be mostly highly enriched in unmyelinated vagal afferents are listed here. For the purpose of simplification, orphan receptors were not indicated. NTS, nucleus of the solitary tract.CC BY-NC-ND · PubMed Central

Verification

Claims the paper makes

The claims and statistics of this paper haven’t been checked yet.

Run the check — free, no account needed. It reads the open-access text and checks the sources it cites.

A few free checks a day · papers already verified open instantly · results are public

Claims other papers make about this one

Each is checked against this paper’s own text: does it say what the citing paper says it does?

Self-check

Percentages, sums and reported differences re-computed from the paper’s own numbers.

The self-check needs the paper’s full text.

Citations

Cites

2 retracted

Show all 85 references

Research works printed but not linked: 1

  1. Williams, 2016, Sensory neurons that detect stretch and nutrients in the digestive system, Cell, 10.1016/j.cell.2016.05.011 · DOI · Paper page

Cited by

Sorted by citations

See all 191

Metadata

Authors
Egerod, K. L., Petersen, N., Timshel, P. N., Rekling, J. C., Wang, Y., Liu, Q., Schwartz, T. W., & Gautron, L.
Affiliations
  • University of Copenhagen (DK)
  • The University of Texas Southwestern Medical Center (US)
Corresponding author
  • Egerod, Kristoffer L.
  • Gautron, Laurent
Venue
Molecular Metabolism
Publisher
Elsevier BV
Published
2018-06
Volume
12
Pages
62-75
ISSN
2212-8778 (ISSN-L)
OpenAlex
W2795588855
Cited by
191
References
85
Citations by year
2026: 17 · 2025: 21 · 2024: 36 · 2023: 20 · 2022: 21 · 2021: 29 · 2020: 21 · 2019: 21 · 2018: 5
FWCI
18.10
Type
journal article
Language
en
Open access
Locations
  • Molecular Metabolism (publishedVersion, cc-by-nc-nd)
  • Europe PMC (PubMed Central) (publishedVersion, cc-by-nc-nd)
  • PubMed Central (publishedVersion, cc-by-nc-nd)
  • PubMed (publishedVersion)
  • Research at the University of Copenhagen (University of Copenhagen) (publishedVersion, cc-by-nc-nd)
  • DOAJ (DOAJ: Directory of Open Access Journals) (submittedVersion, cc-by-sa)
Funders
  • Danmarks Frie Forskningsfond (7016-00389A, NNF14OC0016798, NNF15CC0018346, NNF15OC0016798)
  • Novo Nordisk Fonden (NNF10CC1016515)
Topics
  • Health Sciences › Medicine › Gastroenterology › Gastrointestinal motility and disorders
  • Life Sciences › Neuroscience › Sensory Systems › Ion Channels and Receptors
  • Life Sciences › Neuroscience › Endocrine and Autonomic Systems › Regulation of Appetite and Obesity
Keywords
G protein-coupled receptors, vagal afferents, gut-brain signaling, gastrointestinal hormones, neurotensin receptor 1, NPY2R, GLP-1 receptor, GPR65, GPR35, GPR119, calcium-sensing receptor, gut microbiota metabolites, lipid sensing, inflammation, orphan G protein-coupled receptor, gastrointestinal mucosa, receptor co-expression
MeSH terms
Animals, Brain, Cells, Cultured, Gastrointestinal Hormones, Intestinal Mucosa, Male, Mice, Inbred C57BL, Neurons, Afferent, Vagus Nerve, Signal Transduction, Receptors, G-Protein-Coupled, Mice, NAV1.8 Voltage-Gated Sodium Channel

About these checks

Registry, retraction, Cites and statistics results are computed, not judged, with one exception: a printed reference that no index lists is read once by a model before it counts as a citation error. Claims are extracted by a model and kept only when their quote appears verbatim in the text; each cited source is then checked, with a model’s help, for whether it says what the claim relies on. Those verdicts can be wrong — read the claim’s quote and the cited source before relying on one.

Statistics and arithmetic are recomputed, not judged.

Confidence bands are shown only for fields calibrated on our annotated test set. None is calibrated yet, so no band is shown.

What counts as a claim ›How we measure confidence ›How we check this ›

Are you an author, or do you see a problem with this page? Request a review