

The DOI matches its Crossref record; 33 of the 33 references it cites were found in a registry or an index.
Improving RNA-Seq expression estimates by correcting for fragment bias
Open accessAbstract
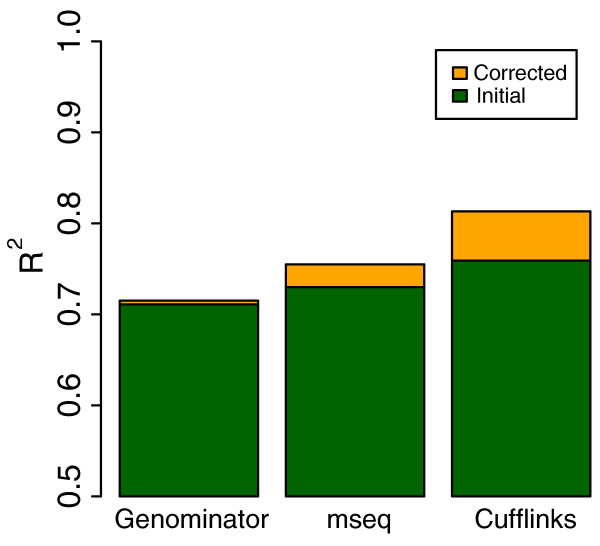
The biochemistry of RNA-Seq library preparation results in cDNA fragments that are not uniformly distributed within the transcripts they represent. This non-uniformity must be accounted for when estimating expression levels, and we show how to perform the needed corrections using a likelihood based approach. We find improvements in expression estimates as measured by correlation with independently performed qRT-PCR and show that correction of bias leads to improved replicability of results across libraries and sequencing technologies.
Overview
The claims and statistics of this paper haven’t been checked yet.
Free: it reads the open-access text and checks the first 5 claims that cite a source we can check. Create a free account to check every claim.
Integrity signals
Registry
Cites
Statistics
Figures




Verification
Claims the paper makes
The claims and statistics of this paper haven’t been checked yet.
Free: it reads the open-access text and checks the first 5 claims that cite a source we can check. Create a free account to check every claim.
Claims other papers make about this one
Each is checked against this paper’s own text: does it say what the citing paper says it does?
The source backs part of the claim, not all of it — or backs it for a different population, condition or comparison.
In the citing paper
“At the transcript level, sample-specific biases that current methods correct for include the fragment length distribution induced by size selection, positional bias along the transcript due to RNA degradation and mRNA selection techniques, and sequence-based bias in read start positions arising from the differential binding efficiency of random hexamer primers2,12-16”
From Modeling of RNA-seq fragment sequence bias reduces systematic errors in transcript abundance estimation (2016) · cites this paper as [14]
Experimental — accuracy not yet measuredThe source backs part of the claim, not all of it — or backs it for a different population, condition or comparison.
In the citing paper
“Cufflinks implements a likelihood-based bias correction step that considers fragment size and GC content bias, among others, and has been shown to significantly improve expression estimation (Roberts et al., 2011).”
From An RNA-Sequencing Transcriptome and Splicing Database of Glia, Neurons, and Vascular Cells of the Cerebral Cortex (2014) · cites this paper as Roberts et al., 2011
Experimental — accuracy not yet measuredThe source backs part of the claim, not all of it — or backs it for a different population, condition or comparison.
In the citing paper
“For example, reads aligning with greater density at the 3′ end of transcripts83,84 and other confounders (for example, GC bias) caused false positives as we attempted to classify alternatively used splice sites based on predicted coverage.”
From Predicting RNA-seq coverage from DNA sequence as a unifying model of gene regulation (2025) · cites this paper as [83]
Experimental — accuracy not yet measuredThe cited source says what the claim attributes to it.
In the citing paper
“Additional factors that interfere with intra-sample comparisons include changes in transcript length across samples or conditions [50], positional biases in coverage along the transcript (which are accounted for in Cufflinks), average fragment size [43], and the GC contents of genes (corrected in the EDAseq package [21]).”
From A survey of best practices for RNA-seq data analysis (2016) · cites this paper as [43]
In the citing paper
“These methods allocate multi-mapping reads among transcript and output within-sample normalized values corrected for sequencing biases [35, 41, 43].”
From A survey of best practices for RNA-seq data analysis (2016) · cites this paper as [43]
1 more claim about this paper
Create a free account to see every claim other papers make about this one.
Self-check
Percentages, sums and reported differences re-computed from the paper’s own numbers.
The self-check needs the paper’s full text.
Citations
Cites
Ultrafast and memory-efficient alignment of short DNA sequences to the human genome.
Langmead, B., Trapnell, C., Pop, M., & Salzberg, S. L. (2009) · Genome Biology · doi:10.1186/gb-2009-10-3-r25 · Cited by 21,849
Self-citationDifferential expression analysis for sequence count data
Anders, S., & Huber, W. (2010) · Genome Biology · doi:10.1186/gb-2010-11-10-r106 · Cited by 15,581
Trapnell, C., Williams, B. A., Pertea, G., Mortazavi, A., Kwan, G., van Baren, M. J., Salzberg, S. L., Wold, B. J., & Pachter, L. (2010) · Nature Biotechnology · doi:10.1038/nbt.1621 · Cited by 15,556
Self-citationTopHat: discovering splice junctions with RNA-Seq
Trapnell, C., Pachter, L., & Salzberg, S. L. (2009) · Bioinformatics · doi:10.1093/bioinformatics/btp120 · Cited by 11,617
Self-citationAlternative isoform regulation in human tissue transcriptomes
Wang, E. T., Sandberg, R., Luo, S., Khrebtukova, I., Zhang, L., Mayr, C., Kingsmore, S. F., Schroth, G. P., & Burge, C. B. (2008) · Nature · doi:10.1038/nature07509 · Cited by 5,181
MAQC Consortium, Shi, L., Shi, L., Reid, L. H., Jones, W. D., Shippy, R., Warrington, J. A., Baker, S. C., Collins, P. J., de Longueville, F., et al. (2006) · Nature Biotechnology · doi:10.1038/nbt1239 · Cited by 2,126
Direct multiplexed measurement of gene expression with color-coded probe pairs
Geiss, G. K., Bumgarner, R. E., Birditt, B., Dahl, T., Dowidar, N., Dunaway, D. L., Fell, H. P., Ferree, S., George, R. D., Grogan, T., et al. (2008) · Nature Biotechnology · doi:10.1038/nbt1385 · Cited by 2,066
Bullard, J. H., Purdom, E., Hansen, K. D., & Dudoit, S. (2010) · BMC Bioinformatics · doi:10.1186/1471-2105-11-94 · Cited by 1,680
RNA integrity and the effect on the real-time qRT-PCR performance
Fleige, S., & Pfaffl, M. W. (2006) · Molecular Aspects of Medicine · doi:10.1016/j.mam.2005.12.003 · Cited by 1,487
The developmental transcriptome of Drosophila melanogaster
Graveley, B. R., Brooks, A. N., Carlson, J. W., Duff, M. O., Landolin, J. M., Yang, L., Artieri, C. G., van Baren, M. J., Boley, N., Booth, B. W., et al. (2011) · Nature · doi:10.1038/nature09715 · Cited by 1,484
Research works printed but not linked: 1
- Short read archive. [http://www.ncbi.nlm.nih.gov/sra]
Cited by
RSEM: accurate transcript quantification from RNA-Seq data with or without a reference genome
Li, B., & Dewey, C. N. (2011) · BMC Bioinformatics · doi:10.1186/1471-2105-12-323 · Cited by 22,179
“For our tests we used data generated from samples used in the Microarray Quality Control (MAQC) Project [36], as has been done in a number of other studies of RNA-Seq quantification accuracy [37,38].”
MethodSalmon provides fast and bias-aware quantification of transcript expression
Patro, R., Duggal, G., Love, M. I., Irizarry, R. A., & Kingsford, C. (2017) · Nature Methods · doi:10.1038/nmeth.4197 · Cited by 12,700
“Sequence-specific bias—It has been previously observed that the sequence surrounding the 5′ and 3′ ends of RNA-seq fragments influences the likelihood that these fragments are selected for sequencing [4].”
BackgroundKim, D., Pertea, G., Trapnell, C., Pimentel, H., Kelley, R., & Salzberg, S. L. (2013) · Genome Biology · doi:10.1186/gb-2013-14-4-r36 · Cited by 12,668
“Assuming that sequencing reads are uniformly distributed along a transcript [3], we would expect 33 to 38% of 100 bp reads from an RNAseq experiment to span two or more exons.”
BackgroundSelf-citationTrapnell, C., Roberts, A., Goff, L., Pertea, G., Kim, D., Kelley, D. R., Pimentel, H., Salzberg, S. L., Rinn, J. L., & Pachter, L. (2012) · Nature Protocols · doi:10.1038/nprot.2012.016 · Cited by 12,116
“CummeRbund drastically simplifies common data exploration tasks, such as plotting and cluster analysis of expression data ( Fig.”
MethodSelf-citationNear-optimal probabilistic RNA-seq quantification
Bray, N. L., Pimentel, H., Melsted, P., & Pachter, L. (2016) · Nature Biotechnology · doi:10.1038/nbt.3519 · Cited by 9,723
Self-citation
Metadata
- Authors
- Roberts, A., Trapnell, C., Donaghey, J., Rinn, J. L., & Pachter, L.
- Affiliations
- University of California, Berkeley (US)
- Broad Institute (US)
- Corresponding author
- Pachter, Lior
- Venue
- Genome Biology
- Published
- 2011-03-16
- Volume
- 12
- Issue
- 3
- Pages
- R22-R22
- ISSN
- 1465-6906 (ISSN-L)
- 1474-760X
- PMC
- PMC3129672
- OpenAlex
- W2138773756
- Cited by
- 1,725
- References
- 33
- Citations by year
- 2026: 108 · 2025: 211 · 2024: 180 · 2023: 149 · 2022: 148 · 2021: 167 · 2020: 76 · 2019: 85 · 2018: 70 · 2017: 71 · 2016: 84 · 2015: 81 · 2014: 100 · 2013: 95 · 2012: 72
- FWCI
- 38.14
- Type
- journal article
- Language
- en
- Open access
- gold
- doi.org
- Licence
- cc-by
- creativecommons.org/licenses/by/2.0/ (tdm)
- creativecommons.org/licenses/by/2.0/ (vor)
- Locations
- Genome biology (publishedVersion, cc-by)
- PubMed Central (publishedVersion, cc-by)
- PubMed (publishedVersion)
- CaltechAUTHORS (California Institute of Technology) (submittedVersion, cc-by)
- eScholarship (California Digital Library) (submittedVersion)
- Funders
- National Science Foundation
- National Human Genome Research Institute (R01HG006102)
- National Institute of General Medical Sciences (R01GM083873)
- Topics
- Life Sciences › Biochemistry, Genetics and Molecular Biology › Molecular Biology › Genomics and Phylogenetic Studies
- Life Sciences › Biochemistry, Genetics and Molecular Biology › Molecular Biology › Gene expression and cancer classification
- Life Sciences › Biochemistry, Genetics and Molecular Biology › Molecular Biology › Single-cell and spatial transcriptomics
- Keywords
- RNA-seq, transcriptome, qRT-PCR validation, replicability, sequencing platform comparison
- MeSH terms
- Humans, Reproducibility of Results, Gene Library, Bias, Sequence Analysis, RNA, Gene Expression Profiling, Quality Improvement
About these checks
Registry, retraction, Cites and statistics results are computed, not judged, with one exception: a printed reference that no index lists is read once by a model before it counts as a citation error. Claims are extracted by a model and kept only when their quote appears verbatim in the text; each cited source is then checked, with a model’s help, for whether it says what the claim relies on. Those verdicts can be wrong — read the claim’s quote and the cited source before relying on one.
Statistics and arithmetic are recomputed, not judged.
Confidence bands are shown only for fields calibrated on our annotated test set. None is calibrated yet, so no band is shown.
What counts as a claim ›How we measure confidence ›How we check this ›
Are you an author, or do you see a problem with this page? Request a review
How to cite
Cite CoChat for the checks on this page, and the paper for its own findings.
- This page
- CoChat. (2026). Citation check: Improving RNA-Seq expression estimates by correcting for fragment bias. https://app.cochat.ai/papers/10.1186/gb-2011-12-3-r22
- The paper
- Roberts, A., Trapnell, C., Donaghey, J., Rinn, J. L., & Pachter, L. (2011). Improving RNA-Seq expression estimates by correcting for fragment bias. Genome Biology. https://doi.org/10.1186/gb-2011-12-3-r22
Data sources
Bibliographic data: Semantic Scholar, OpenAlex, Crossref.
Contains information from the Semantic Scholar Academic Graph Datasets, made available under the ODC Attribution License (ODC-BY 1.0).
Semantic Scholar’s data is described in: Kinney, R., et al. (2023). The Semantic Scholar Open Data Platform. arXiv:2301.10140.
