

The DOI matches its Crossref record; 1 of the 1 references it cites were found in a registry or an index.
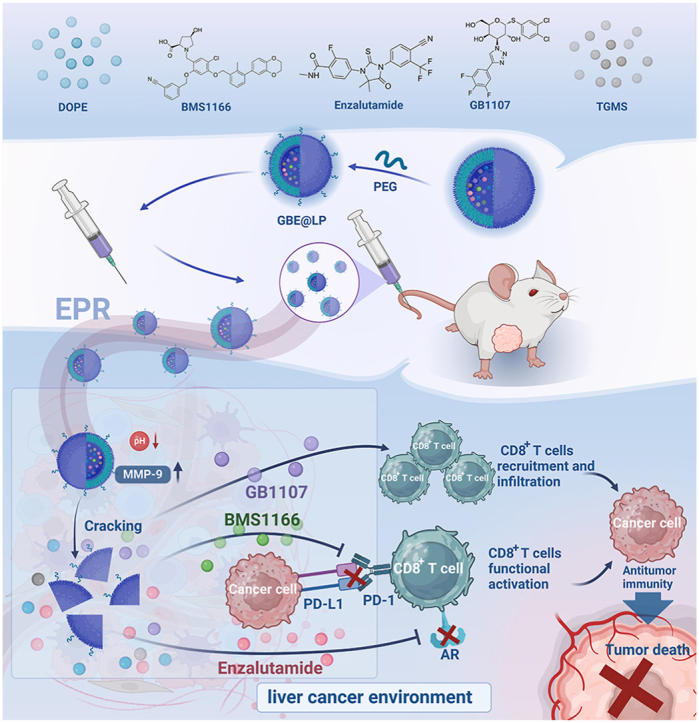
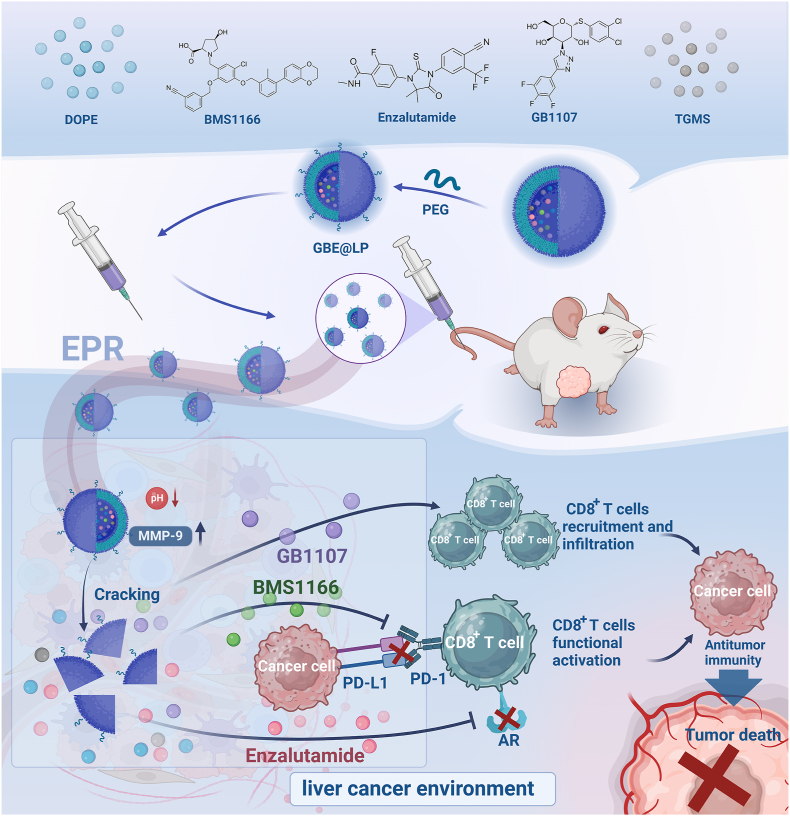
A pH/MMP-9 smart dual-responsive liposome GBE@LP co-delivers and controls the release of GB1107/BMS1166/Enzalutamide for liver cancer immunotherapy
Overview
The claims and statistics of this paper haven’t been checked yet.
Run the check — free, no account needed. It reads the open-access text and checks the sources it cites.
Integrity signals
Registry
Cites
Statistics
Figures
Verification
Claims the paper makes
The claims and statistics of this paper haven’t been checked yet.
Run the check — free, no account needed. It reads the open-access text and checks the sources it cites.
Claims other papers make about this one
Each is checked against this paper’s own text: does it say what the citing paper says it does?
In the citing paper
“pH and MMP-9 responsive liposomes co-delivering the galectin-3 inhibitor GB1107, the PD-1 inhibitor BMS-1166, and enzalutamide to remodel the immune TME and reverse T-cell exhaustion [103, 104].”
From Overcoming tumor microenvironment barriers: transformable and bioinspired nanomedicine strategies for deep tumor penetration (2026) · cites this paper as [104]
In the citing paper
“pH and MMP-9 responsive liposomes co-delivering GB1107, BMS1166, enzalutamide (GBE@LP) | Acidic pH and MMP-9 | PEGylated liposomes with immuno-modulators | Long circulation; tumor-site release; immune TME remodeling; reversal of T-cell exhaustion”
From Overcoming tumor microenvironment barriers: transformable and bioinspired nanomedicine strategies for deep tumor penetration (2026) · cites this paper as [104]
Self-check
Percentages, sums and reported differences re-computed from the paper’s own numbers.
The self-check needs the paper’s full text.
Citations
Cites
Two subsets of stem-like CD8+ memory T cell progenitors with distinct fate commitments in humans
Galletti, G., De Simone, G., Mazza, E. M. C., Puccio, S., Mezzanotte, C., Bi, T. M., Davydov, A. N., Metsger, M., Scamardella, E., Alvisi, G., et al. (2020) · Nature Immunology · doi:10.1038/s41590-020-0791-5 · Cited by 299
Research works printed but not linked: 57
- Bray F, Ferlay J, Soerjomataram I, Siegel RL, Torre LA, Jemal A. Global Cancer Statistics 2018: GLOBOCAN Estimates of Incidence and Mortality Worldwide for 36 Cancers in 185 Countries. (1542-4863 (Electronic)). · DOI · Paper page
- Xia, 2022, Cancer statistics in China and United States, 2022: profiles, trends, and determinants, Chin Med J (Engl)., 135, 584, 10.1097/CM9.0000000000002108 · DOI
- Anwanwan, 2020, Challenges in liver cancer and possible treatment approaches, Biochim. Biophys. Acta Rev. Canc, 1873
- Lu, 2019, Current perspectives on the immunosuppressive tumor microenvironment in hepatocellular carcinoma: challenges and opportunities, Mol. Cancer, 18, 130, 10.1186/s12943-019-1047-6 · DOI
- Sangro, 2021, Advances in immunotherapy for hepatocellular carcinoma, Nat. Rev. Gastroenterol. Hepatol., 18, 525, 10.1038/s41575-021-00438-0 · DOI · Paper page
- Xing, 2021, Strategies to improve the antitumor effect of immunotherapy for hepatocellular carcinoma, Front. Immunol., 12, 10.3389/fimmu.2021.783236 · DOI
- Liu, 2021, Immunotherapy for hepatocellular carcinoma: current status and future prospects, Front. Immunol., 12
- Liu, 2021, Turning cold tumors into hot tumors by improving T-cell infiltration, Theranostics, 11, 5365, 10.7150/thno.58390 · DOI
- Bonaventura, 2019, Cold tumors: a therapeutic challenge for immunotherapy, Front. Immunol., 10, 168, 10.3389/fimmu.2019.00168 · DOI
- Yang, 2020, Compound kushen injection relieves tumor-associated macrophage-mediated immunosuppression through TNFR1 and sensitizes hepatocellular carcinoma to sorafenib, J. Immunother. Cancer, 8, 10.1136/jitc-2019-000317 · DOI
- Kimura, 2018, Immunomodulatory activity of lenvatinib contributes to antitumor activity in the Hepa1-6 hepatocellular carcinoma model, Cancer Sci., 109, 3993, 10.1111/cas.13806 · DOI
- Capone, 2021, Role of galectin 3 binding protein in cancer progression: a potential novel therapeutic target, J. Transl. Med., 19, 405, 10.1186/s12967-021-03085-w · DOI
- Li, 2021, Cocktail strategy for 'cold' tumors therapy via active recruitment of CD8+ T cells and enhancing their function, J Control Release, 334, 413, 10.1016/j.jconrel.2021.05.002 · DOI
- Chen, 2022, Advances in immune checkpoint inhibitors for advanced hepatocellular carcinoma, Front. Immunol., 13
- de Miguel, 2020, Clinical challenges of immune checkpoint inhibitors, Cancer Cell, 38, 326, 10.1016/j.ccell.2020.07.004 · DOI
- Kanda, 2015, The androgen receptor as an emerging target in hepatocellular carcinoma, J. Hepatocell. Carcinoma, 2, 91, 10.2147/JHC.S48956 · DOI
- Guan, 2022, Androgen receptor activity in T cells limits checkpoint blockade efficacy, Nature, 606, 791, 10.1038/s41586-022-04522-6 · DOI
- Cheung, 2016, Gender differences in adipocyte metabolism and liver cancer progression, Front. Genet., 7, 168, 10.3389/fgene.2016.00168 · DOI
- Kwon, 2022, Androgen conspires with the CD8(+) T cell exhaustion program and contributes to sex bias in cancer, Sci Immunol., 7, 10.1126/sciimmunol.abq2630 · DOI
- Lee, 2013, Histone deacetylase inhibitor AR-42 enhances E7-specific CD8+ T cell-mediated antitumor immunity induced by therapeutic HPV DNA vaccination, J Mol Med (Berl)., 91, 1221, 10.1007/s00109-013-1054-9 · DOI
- Pala, 2022, Boosting anticancer immunotherapy through androgen receptor blockade, Cancer Cell, 40, 455, 10.1016/j.ccell.2022.04.007 · DOI
- Ruman, 2020, Nanocarrier-based therapeutics and theranostics drug delivery systems for next generation of liver cancer nanodrug modalities, Int J Nanomedicine, 15, 1437, 10.2147/IJN.S236927 · DOI
- Patra, 2018, Nano based drug delivery systems: recent developments and future prospects, J Nanobiotechnology, 16, 71, 10.1186/s12951-018-0392-8 · DOI
- Li, 2022, Advances in nanoliposomes for the diagnosis and treatment of liver cancer, Int J Nanomedicine, 17, 909, 10.2147/IJN.S349426 · DOI
- Wang, 2021, Protein liposomes-mediated targeted acetylcholinesterase gene delivery for effective liver cancer therapy, J Nanobiotechnology, 19, 31, 10.1186/s12951-021-00777-9 · DOI
- Hao, 2021, Targeting immune cells in the tumor microenvironment of HCC: new opportunities and challenges, Front. Cell Dev. Biol., 9, 10.3389/fcell.2021.775462 · DOI
- Kim, 2021, Crosstalk between WNT and STAT3 is mediated by galectin-3 in tumor progression, Gastric Cancer, 24, 1050, 10.1007/s10120-021-01186-5 · DOI
- Ge, 2022, Enhancement of anti-PD-1/PD-L1 immunotherapy for osteosarcoma using an intelligent autophagy-controlling metal organic framework, Biomaterials, 282, 10.1016/j.biomaterials.2022.121407 · DOI
- Zhao, 2020, Olaparib and enzalutamide synergistically suppress HCC progression via the AR-mediated miR-146a-5p/BRCA1 signaling, Faseb j, 34, 5877, 10.1096/fj.201903045RR · DOI
- Lahiri, 2023, Lung cancer immunotherapy: progress, pitfalls, and promises, Mol. Cancer, 22, 40, 10.1186/s12943-023-01740-y · DOI · Paper page
- Bi, 2021, Tumor and immune reprogramming during immunotherapy in advanced renal cell carcinoma, Cancer Cell, 39, 649, 10.1016/j.ccell.2021.02.015 · DOI
- Guo, 2023, RNF8 enhances the sensitivity of PD-L1 inhibitor against melanoma through ubiquitination of galectin-3 in stroma, Cell Death Discov., 9, 205, 10.1038/s41420-023-01500-3 · DOI
- Landy, 2023, Programming nucleation and growth in colloidal crystals using DNA, ACS Nano, 17, 6480, 10.1021/acsnano.2c11674 · DOI
- Momekova, 2017, Long-circulating, pH-sensitive liposomes, Methods Mol. Biol., 1522, 209, 10.1007/978-1-4939-6591-5_16 · DOI
- Karanth, 2007, pH-sensitive liposomes--principle and application in cancer therapy, J. Pharm. Pharmacol., 59, 469, 10.1211/jpp.59.4.0001 · DOI
- He, 2020, Matrix metalloproteinase-responsive PEGylated lipid nanoparticles for controlled drug delivery in the treatment of rheumatoid arthritis, ACS Appl. Bio Mater., 3, 3276, 10.1021/acsabm.0c00242 · DOI
- Wang, 2019, Lyophilized liposome-based parenteral drug development: reviewing complex product design strategies and current regulatory environments, Adv. Drug Deliv. Rev., 151–152, 56, 10.1016/j.addr.2019.03.003 · DOI
- Boafo, 2022, The role of cryoprotective agents in liposome stabilization and preservation, Int. J. Mol. Sci., 23, 10.3390/ijms232012487 · DOI
- Trenkenschuh, 2021, Freeze-drying of nanoparticles: how to overcome colloidal instability by formulation and process optimization, Eur. J. Pharm. Biopharm., 165, 345, 10.1016/j.ejpb.2021.05.024 · DOI
- Deng, 2023, Specific protection mechanism of oligosaccharides on liposomes during freeze-drying, Food Res. Int., 166, 10.1016/j.foodres.2023.112608 · DOI
- Wang, 2009, Polymyxin E sulfate-loaded liposome for intravenous use: preparation, lyophilization, and toxicity assessment in vivo, PDA J. Pharm. Sci. Technol., 63, 159
- Kang, 2019, Polyethylene glycol-decorated doxorubicin/carboxymethyl chitosan/gold nanocomplex for reducing drug efflux in cancer cells and extending circulation in blood stream, Int. J. Biol. Macromol., 125, 61, 10.1016/j.ijbiomac.2018.12.028 · DOI
- Shi, 2020, The EPR effect and beyond: strategies to improve tumor targeting and cancer nanomedicine treatment efficacy, Theranostics, 10, 7921, 10.7150/thno.49577 · DOI · Paper page
- Kim, 2015, Pharmacokinetics of enzalutamide, an anti-prostate cancer drug, in rats, Arch Pharm. Res. (Seoul), 38, 2076, 10.1007/s12272-015-0592-9 · DOI
- Fan, 2014, Pharmacokinetics, Biochem. Pharmacol., 87, 93, 10.1016/j.bcp.2013.09.007 · DOI · Paper page
- Zhong, 2021, Small molecules in targeted cancer therapy: advances, challenges, and future perspectives, Signal Transduct Target Ther, 6, 201, 10.1038/s41392-021-00572-w · DOI
- Amado, 2020, MicroRNA-181a regulates IFN-γ expression in effector CD8(+) T cell differentiation, J. Mol. Med. (Berl.), 98, 309, 10.1007/s00109-019-01865-y · DOI
- Hoekstra, 2024, Distinct spatiotemporal dynamics of CD8(+) T cell-derived cytokines in the tumor microenvironment, Cancer Cell, 42, 157, 10.1016/j.ccell.2023.12.010 · DOI
- Chen, 2023, TGF-Β regulation of T cells, Annu. Rev. Immunol., 41, 483, 10.1146/annurev-immunol-101921-045939 · DOI
- Xie, 2022, USP8 promotes cancer progression and extracellular vesicle-mediated CD8+ T cell exhaustion by deubiquitinating the TGF-β receptor TβRII, Embo j, 41, 10.15252/embj.2021108791 · DOI
- Kearney, 2018, Tumor immune evasion arises through loss of TNF sensitivity, Sci Immunol., 3, 10.1126/sciimmunol.aar3451 · DOI · Paper page
- Jiang, 2020, Exhausted CD8+T cells in the tumor immune microenvironment: new pathways to therapy, Front. Immunol., 11
- Zhang, 2023, The development of CD8 T-cell exhaustion heterogeneity and the therapeutic potentials in cancer, Front. Immunol., 14
- Engram, 2010, Lineage-specific T-cell reconstitution following in vivo CD4+ and CD8+ lymphocyte depletion in nonhuman primates, Blood, 116, 748, 10.1182/blood-2010-01-263814 · DOI
- Yang, 2022, Androgen receptor-mediated CD8(+) T cell stemness programs drive sex differences in antitumor immunity, Immunity, 55, 1268, 10.1016/j.immuni.2022.05.012 · DOI
- Liu, 2024, The IFN-γ-CXCL9/CXCL10-CXCR3 axis in vitiligo: pathological mechanism and treatment, Eur. J. Immunol., 54, 10.1002/eji.202250281 · DOI
- Bergamaschi, 2020, Heterodimeric IL-15 delays tumor growth and promotes intratumoral CTL and dendritic cell accumulation by a cytokine network involving XCL1, IFN-γ, CXCL9 and CXCL10, J. Immunother. Cancer, 8, 10.1136/jitc-2020-000599 · DOI
Cited by
Sorted by citations
Sheng, J., Yuan, W., Zhang, M., Chen, Z., Qi, Y., Zhao, Y., & Zhang, S. (2026) · Journal of Nanobiotechnology · doi:10.1186/s12951-026-04028-7 · Cited by 35
Metadata
- Authors
- Lu, S., Zhang, C., Wu, H., Wang, J., Wang, J., Zhao, L., Ren, T., & Li, G.
- Venue
- Materials Today Bio
- Publisher
- Elsevier BV
- Published
- 2025-06
- Volume
- 32
- Pages
- 101801
- ISSN
- 2590-0064
- PMC
- PMC12139023
- Cited by
- 8
- References
- 1
- Language
- en
About these checks
Registry, retraction, Cites and statistics results are computed, not judged, with one exception: a printed reference that no index lists is read once by a model before it counts as a citation error. Claims are extracted by a model and kept only when their quote appears verbatim in the text; each cited source is then checked, with a model’s help, for whether it says what the claim relies on. Those verdicts can be wrong — read the claim’s quote and the cited source before relying on one.
Statistics and arithmetic are recomputed, not judged.
Confidence bands are shown only for fields calibrated on our annotated test set. None is calibrated yet, so no band is shown.
What counts as a claim ›How we measure confidence ›How we check this ›
Are you an author, or do you see a problem with this page? Request a review
