

The DOI matches its Crossref record; 49 of the 49 references it cites were found in a registry or an index.
Rapid evolution of blood-brain-barrier-penetrating AAV capsids by RNA-driven biopanning
Open accessAbstract
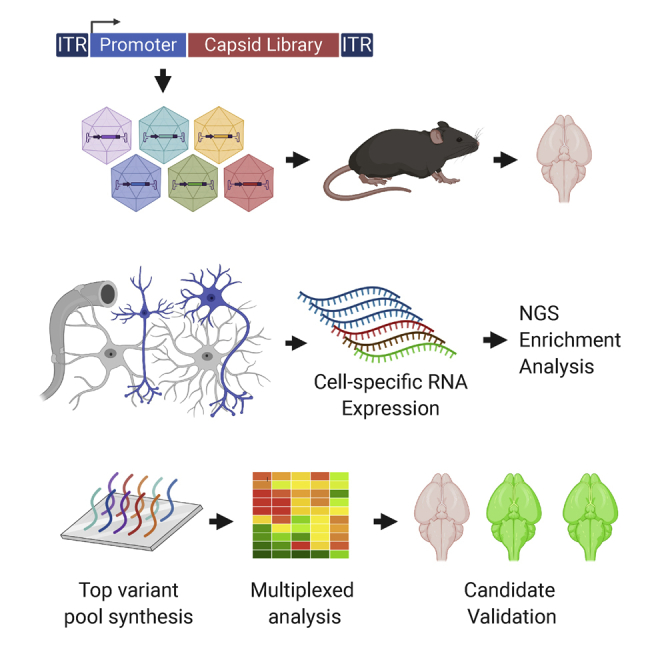
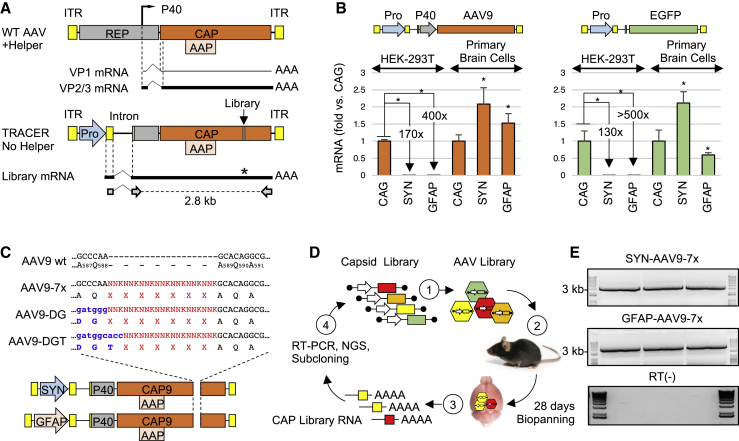
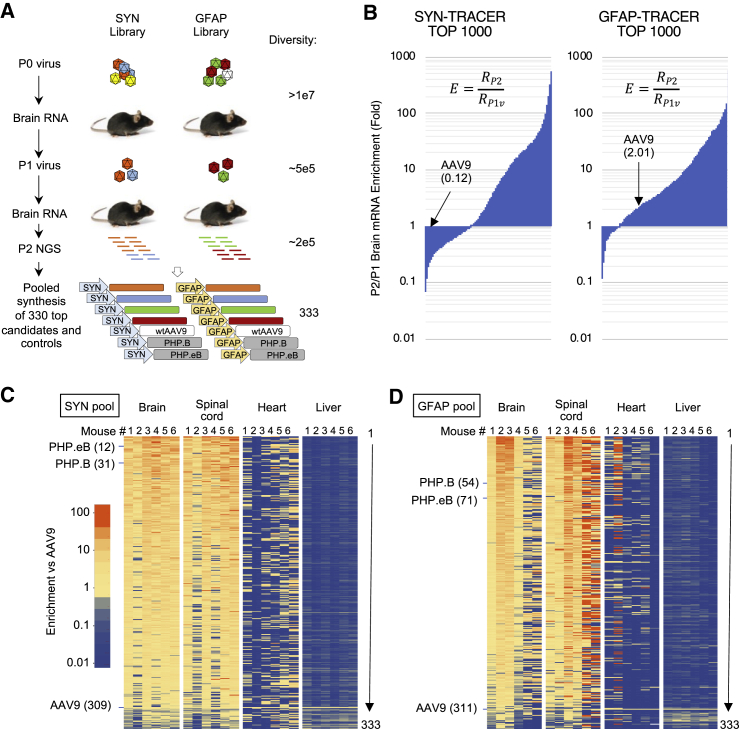
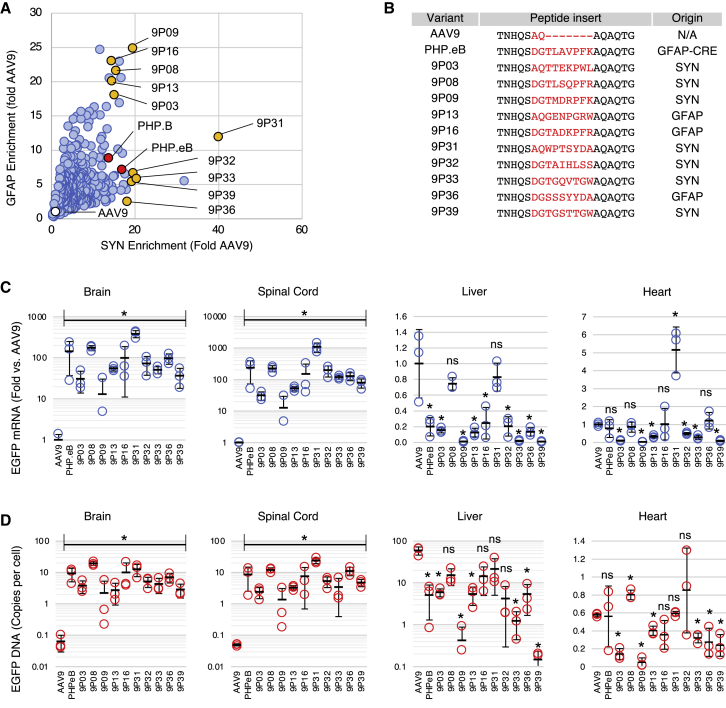
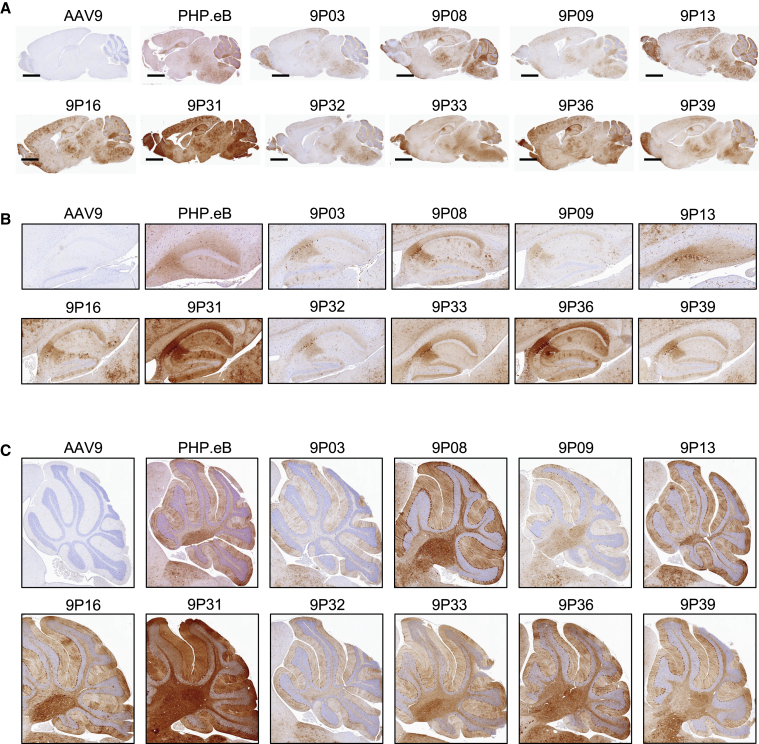
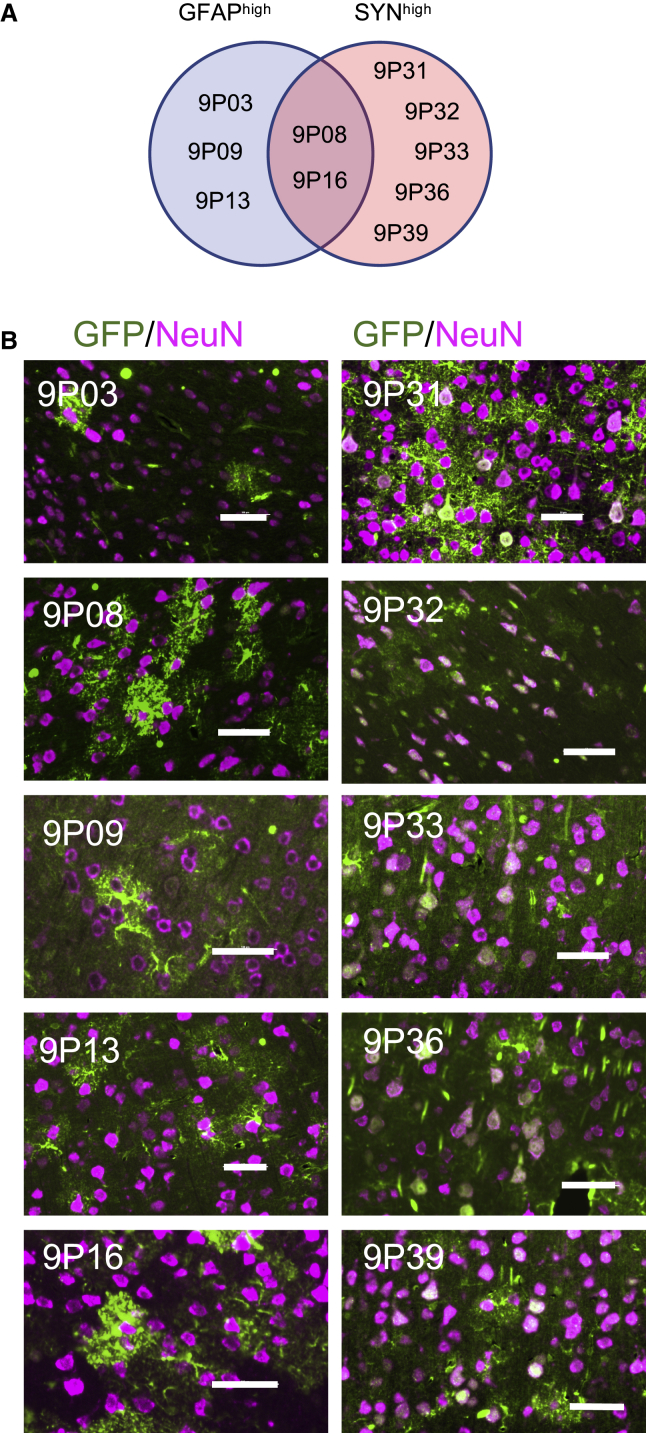
Therapeutic payload delivery to the central nervous system (CNS) remains a major challenge in gene therapy. Recent studies using function-driven evolution of adeno-associated virus (AAV) vectors have successfully identified engineered capsids with improved blood-brain barrier (BBB) penetration and CNS tropism in mouse. However, these strategies require transgenic animals and thus are limited to rodents. To address this issue, we developed a directed evolution approach based on recovery of capsid library RNA transcribed from CNS-restricted promoters. This RNA-driven screen platform, termed TRACER (Tropism Redirection of AAV by Cell-type-specific Expression of RNA), was tested in the mouse with AAV9 peptide display libraries and showed rapid emergence of dominant sequences. Ten individual variants were characterized and showed up to 400-fold higher brain transduction over AAV9 following systemic administration. Our results demonstrate that the TRACER platform allows rapid selection of AAV capsids with robust BBB penetration and CNS tropism in non-transgenic animals.
Overview
The claims and statistics of this paper haven’t been checked yet.
Run the check — free, no account needed. It reads the open-access text and checks the sources it cites.
Integrity signals
Registry
Cites
Statistics
Figures
Verification
Claims the paper makes
The claims and statistics of this paper haven’t been checked yet.
Run the check — free, no account needed. It reads the open-access text and checks the sources it cites.
Claims other papers make about this one
Each is checked against this paper’s own text: does it say what the citing paper says it does?
The cited source says what the claim attributes to it.
In the citing paper
“including 9P31 with up to 400-fold higher brain transduction [130].”
From Designing and optimizing AAV-mediated gene therapy for neurodegenerative diseases: from bench to bedside (2024) · cites this paper as [130]
The cited source says what the claim attributes to it.
In the citing paper
“Voyager Therapeutics built up another platform called TRACER (Tropism Redirection of AAV by Cell-type-specific Expression of RNA) and identified ten enhanced variants in C57BL/6 mice”
From Designing and optimizing AAV-mediated gene therapy for neurodegenerative diseases: from bench to bedside (2024) · cites this paper as [130]
Self-check
Percentages, sums and reported differences re-computed from the paper’s own numbers.
The self-check needs the paper’s full text.
Citations
Cites
Ultrafast and memory-efficient alignment of short DNA sequences to the human genome.
Langmead, B., Trapnell, C., Pop, M., & Salzberg, S. L. (2009) · Genome Biology · doi:10.1186/gb-2009-10-3-r25 · Cited by 21,849
Adeno-associated virus vector as a platform for gene therapy delivery
Wang, D., Tai, P. W. L., & Gao, G. (2019) · Nature Reviews Drug Discovery · doi:10.1038/s41573-019-0012-9 · Cited by 2,444
Single-Dose Gene-Replacement Therapy for Spinal Muscular Atrophy
Mendell, J. R., Al-Zaidy, S., Shell, R., Arnold, W. D., Rodino-Klapac, L. R., Prior, T. W., Lowes, L., Alfano, L., Berry, K., Church, K., et al. (2017) · New England Journal of Medicine · doi:10.1056/nejmoa1706198 · Cited by 2,381
Chan, K. Y., Jang, M. J., Yoo, B. B., Greenbaum, A., Ravi, N., Wu, W.-L., Sánchez-Guardado, L., Lois, C., Mazmanian, S. K., Deverman, B. E., et al. (2017) · Nature Neuroscience · doi:10.1038/nn.4593 · Cited by 1,578
Analysis of AAV Serotypes 1–9 Mediated Gene Expression and Tropism in Mice After Systemic Injection
Zincarelli, C., Soltys, S., Rengo, G., & Rabinowitz, J. E. (2008) · Molecular Therapy · doi:10.1038/mt.2008.76 · Cited by 1,490
Cre-dependent selection yields AAV variants for widespread gene transfer to the adult brain
Deverman, B. E., Pravdo, P. L., Simpson, B. P., Kumar, S. R., Chan, K. Y., Banerjee, A., Wu, W.-L., Yang, B., Huber, N., Pasca, S. P., et al. (2016) · Nature Biotechnology · doi:10.1038/nbt.3440 · Cited by 1,061
Dalkara, D., Byrne, L. C., Klimczak, R. R., Visel, M., Yin, L., Merigan, W. H., Flannery, J. G., & Schaffer, D. V. (2013) · Science Translational Medicine · doi:10.1126/scitranslmed.3005708 · Cited by 734
Grimm, D., Lee, J. S., Wang, L., Desai, T., Akache, B., Storm, T. A., & Kay, M. A. (2008) · Journal of Virology · doi:10.1128/jvi.00254-08 · Cited by 696
The atomic structure of adeno-associated virus (AAV-2), a vector for human gene therapy
Xie, Q., Bu, W., Bhatia, S., Hare, J., Somasundaram, T., Azzi, A., & Chapman, M. S. (2002) · Proceedings of the National Academy of Sciences · doi:10.1073/pnas.162250899 · Cited by 612
Directed evolution of adeno-associated virus yields enhanced gene delivery vectors
Maheshri, N., Koerber, J. T., Kaspar, B. K., & Schaffer, D. V. (2006) · Nature Biotechnology · doi:10.1038/nbt1182 · Cited by 538 · cited 1×
“Early designs of AAV-directed evolution were strictly tailored for in vitro selection in cultured cells and used helper adenovirus coinfection to enrich transduction-competent variants.(11,12,17,18) Helper-dependent selection is not easily accomplished in vivo, and library selection in the mouse initially relied on in…”
Research works printed but not linked: 2
- Hordeaux, 2018, The Neurotropic Properties of AAV-PHP.B Are Limited to C57BL/6J Mice, Mol. Ther., 26, 664, 10.1016/j.ymthe.2018.01.018 · DOI · Paper page
- Hordeaux, 2019, The GPI-Linked Protein LY6A Drives AAV-PHP.B Transport across the Blood-Brain Barrier, Mol. Ther., 27, 912, 10.1016/j.ymthe.2019.02.013 · DOI · Paper page
Cited by
Sorted by citations
Adeno-associated virus as a delivery vector for gene therapy of human diseases
Wang, J.-H., Gessler, D. J., Zhan, W., Gallagher, T. L., & Gao, G. (2024) · Signal Transduction and Targeted Therapy · doi:10.1038/s41392-024-01780-w · Cited by 904
Tabebordbar, M., Lagerborg, K. A., Stanton, A. C., King, E. M., Ye, S. H., Tellez, L., Krunnfusz, A., Tavakoli, S., Widrick, J. J., Messemer, K. A., et al. (2021) · Cell · doi:10.1016/j.cell.2021.08.028 · Cited by 539
AAV vectors: The Rubik’s cube of human gene therapy
Pupo, A., Fernández, A., Low, S. H., François, A., Suárez-Amarán, L., & Samulski, R. J. (2022) · Molecular Therapy · doi:10.1016/j.ymthe.2022.09.015 · Cited by 382
An AAV capsid reprogrammed to bind human transferrin receptor mediates brain-wide gene delivery
Huang, Q., Chan, K. Y., Wu, J. H., Botticello-Romero, N. R., Zheng, Q., Lou, S., Keyes, C., Svanbergsson, A., Johnston, J., Mills, A., et al. (2024) · Science · doi:10.1126/science.adm8386 · Cited by 201
Adeno-Associated Virus Toolkit to Target Diverse Brain Cells
Challis, R. C., Ravindra Kumar, S., Chen, X., Goertsen, D., Coughlin, G. M., Hori, A. M., Chuapoco, M. R., Otis, T. S., Miles, T. F., & Gradinaru, V. (2022) · Annual Review of Neuroscience · doi:10.1146/annurev-neuro-111020-100834 · Cited by 148
Metadata
- Authors
- Nonnenmacher, M., Wang, W., Child, M. A., Ren, X.-Q., Huang, C., Ren, A. Z., Tocci, J., Chen, Q., Bittner, K., Tyson, K., Pande, N., Chung, C. H.-Y., Paul, S. M., & Hou, J.
- Affiliations
- Voyager Therapeutics (United States) (US)
- Corresponding author
- Nonnenmacher, Mathieu
- Hou, Jay
- ORCID
- Venue
- Molecular Therapy - Methods & Clinical Development
- Publisher
- Elsevier BV
- Published
- 2021-03
- Volume
- 20
- Pages
- 366-378
- ISSN
- 2329-0501 (ISSN-L)
- PMC
- PMC7841218
- OpenAlex
- W3115131581
- Cited by
- 168
- References
- 49
- Citations by year
- 2026: 25 · 2025: 46 · 2024: 32 · 2023: 27 · 2022: 28 · 2021: 9
- FWCI
- 9.38
- Type
- journal article
- Language
- en
- Open access
- gold
- doi.org
- Licence
- Locations
- Molecular Therapy — Methods & Clinical Development (publishedVersion, cc-by-nc-nd)
- Europe PMC (PubMed Central) (publishedVersion, cc-by-nc-nd)
- PubMed Central (publishedVersion, cc-by-nc-nd)
- PubMed (publishedVersion)
- DOAJ (DOAJ: Directory of Open Access Journals) (submittedVersion, cc-by-sa)
- Topics
- Life Sciences › Biochemistry, Genetics and Molecular Biology › Genetics › Virus-based gene therapy research
- Life Sciences › Neuroscience › Neurology › Barrier Structure and Function Studies
- Life Sciences › Biochemistry, Genetics and Molecular Biology › Molecular Biology › RNA Interference and Gene Delivery
- Keywords
- adeno-associated virus vectors, blood-brain barrier penetration
About these checks
Registry, retraction, Cites and statistics results are computed, not judged, with one exception: a printed reference that no index lists is read once by a model before it counts as a citation error. Claims are extracted by a model and kept only when their quote appears verbatim in the text; each cited source is then checked, with a model’s help, for whether it says what the claim relies on. Those verdicts can be wrong — read the claim’s quote and the cited source before relying on one.
Statistics and arithmetic are recomputed, not judged.
Confidence bands are shown only for fields calibrated on our annotated test set. None is calibrated yet, so no band is shown.
What counts as a claim ›How we measure confidence ›How we check this ›
Are you an author, or do you see a problem with this page? Request a review
