Cited by 46

The DOI matches its Crossref record; 2 of the 2 references it cites were found in a registry or an index.

MicroRNA-378 Suppressed Osteogenesis of MSCs and Impaired Bone Formation via Inactivating Wnt/β-Catenin Signaling

Feng, Lu, Zhang, Jin-fang, Shi, Liu, Yang, Zheng-meng, Wu, Tian-yi, Wang, Hai-xing, Lin, Wei-ping, Lu, Ying-fei, Lo, Jessica Hiu Tung, Zhu, Da-hai, Li, Gang·2020·Molecular Therapy Nucleic Acids

Published version of a preprint

Overview

The claims and statistics of this paper haven’t been checked yet.

Run the check — free, no account needed. It reads the open-access text and checks the sources it cites.

A few free checks a day · papers already verified open instantly · results are public

Integrity signals

Registry

Crossref · 10.1016/j.omtn.2020.07.018

Cites

2 of 2 references verified0 citation errors · 0 not checkable

Statistics

Figures

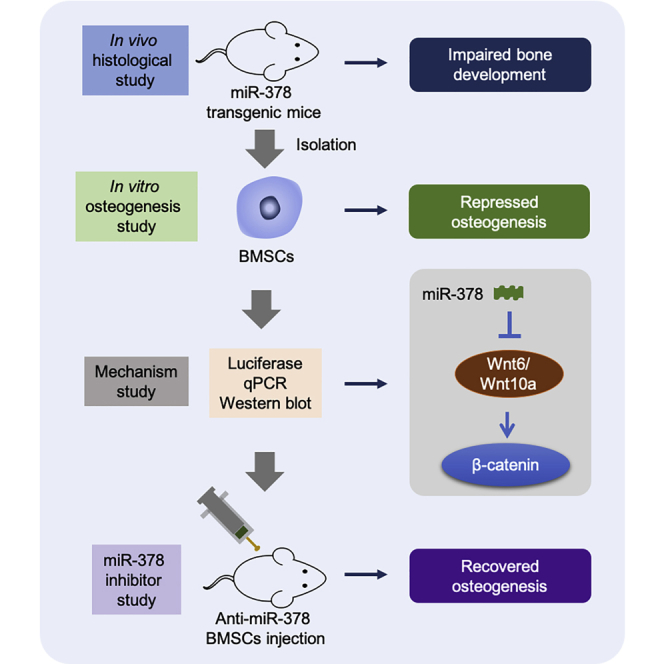
Graphical abstract
Graphical abstract CC BY · PubMed Central
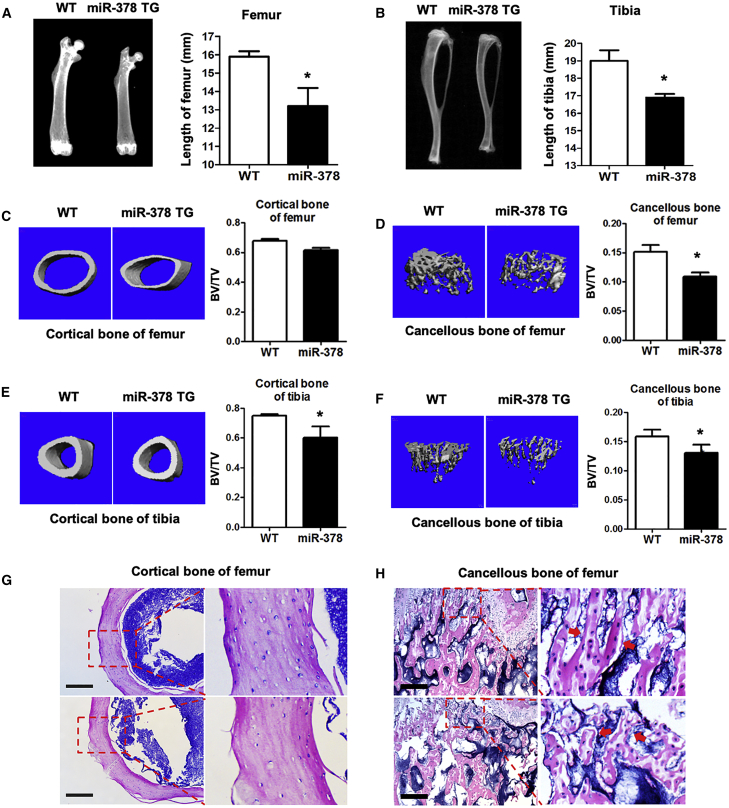
Figure 1 Abnormal Bone Tissues and Impaired Bone Quality Were Observed in miR-378 TG Mice (A and B) Bone phenotype of femurs (A) and tibia (B) of miR-378 TG mice and their wild-type (WT) mice were examined by digital radiography. (C–F) Representative microarchitecture 3D images of cortical (C and E) and trabecular (D and F) bone of femur (C and D), as well as tibia (E and F). BV/TV of the cortical and trabecular bone all showed that the bone mass was significantly decreased in the miR-378 TG mice (age: 3 months; n = 10; ∗p < 0.05 versus WT group). (G) H&E staining of transverse and coronal plane of femurs revealed thicker cortices, smoother edge of cortical bone, and more paralleled alignment of osteocytes in the WT mice than those in the miR-378 TG group. Scale bars, 400 μm. (H) H&E staining of the sagittal plane of the metaphyseal region of femurs revealed more disrupted bone microarchitecture and homeostasis in cancellous bone of the miR-378 TG mice femur. Scale bars, 100 μm.
Figure 1 Abnormal Bone Tissues and Impaired Bone Quality Were Observed in miR-378 TG Mice (A and B) Bone phenotype of femurs (A) and tibia (B) of miR-378 TG mice and their wild-type (WT) mice were examined by digital radiography. (C–F) Representative microarchitecture 3D images of cortical (C and E) and trabecular (D and F) bone of femur (C and D), as well as tibia (E and F). BV/TV of the cortical and trabecular bone all showed that the bone mass was significantly decreased in the miR-378 TG mice (age: 3 months; n = 10; ∗p < 0.05 versus WT group). (G) H&E staining of transverse and coronal plane of femurs revealed thicker cortices, smoother edge of cortical bone, and more paralleled alignment of osteocytes in the WT mice than those in the miR-378 TG group. Scale bars, 400 μm. (H) H&E staining of the sagittal plane of the metaphyseal region of femurs revealed more disrupted bone microarchitecture and homeostasis in cancellous bone of the miR-378 TG mice femur. Scale bars, 100 μm.CC BY · PubMed Central
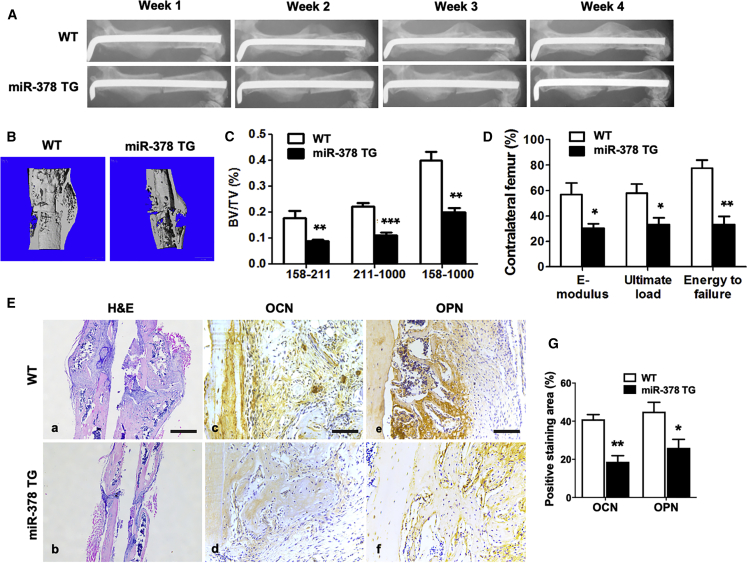
Figure 2 Bone Fracture Healing Was Impaired in the miR-378 TG Group (A) Representative images of X-ray radiography showed that less callus formation was found in the miR-378 TG group at week 4, and the gap in the fracture sites almost disappeared in the WT group. (B) Three-dimensional micro-CT images of the mouse femur fracture zone were taken 4 weeks after surgery, and the result confirmed that less continuous callus was found in the miR-378 TG group. (C) Micro-CT analysis was performed, and highly mineralized and newly formed calluses were reconstructed based on a different threshold. The results showed that BV/TV of total mineralized bone (threshold 158–1,000), highly mineralized bone (threshold 211–1,000), as well as new callus (threshold 158–211) in the WT group was much higher than that in the miR-378 TG groups. (D) Three-point bending mechanical testing in the miR-378 TG group showed a significant decrease of ultimate load, E-modulus, and energy to failure compared to the WT group. (E, a and b) H&E staining revealed that the miR-378 TG group has fewer calluses covered on the femur fracture site at week 4 postsurgery, and the bone remodeling was less vigorous than the WT group. Scale bar, 800 μm. (E, c–g) Immunohistochemistry staining and semiquantitative analysis revealed less OCN and OPN expression in the miR-378 TG group. Scale bars, 100 μm. (E, g) Age: 3 months; n = 10; ∗p < 0.05, ∗∗p < 0.01, ∗∗∗p < 0.001 versus WT group.
Figure 2 Bone Fracture Healing Was Impaired in the miR-378 TG Group (A) Representative images of X-ray radiography showed that less callus formation was found in the miR-378 TG group at week 4, and the gap in the fracture sites almost disappeared in the WT group. (B) Three-dimensional micro-CT images of the mouse femur fracture zone were taken 4 weeks after surgery, and the result confirmed that less continuous callus was found in the miR-378 TG group. (C) Micro-CT analysis was performed, and highly mineralized and newly formed calluses were reconstructed based on a different threshold. The results showed that BV/TV of total mineralized bone (threshold 158–1,000), highly mineralized bone (threshold 211–1,000), as well as new callus (threshold 158–211) in the WT group was much higher than that in the miR-378 TG groups. (D) Three-point bending mechanical testing in the miR-378 TG group showed a significant decrease of ultimate load, E-modulus, and energy to failure compared to the WT group. (E, a and b) H&E staining revealed that the miR-378 TG group has fewer calluses covered on the femur fracture site at week 4 postsurgery, and the bone remodeling was less vigorous than the WT group. Scale bar, 800 μm. (E, c–g) Immunohistochemistry staining and semiquantitative analysis revealed less OCN and OPN expression in the miR-378 TG group. Scale bars, 100 μm. (E, g) Age: 3 months; n = 10; ∗p < 0.05, ∗∗p < 0.01, ∗∗∗p < 0.001 versus WT group.CC BY · PubMed Central
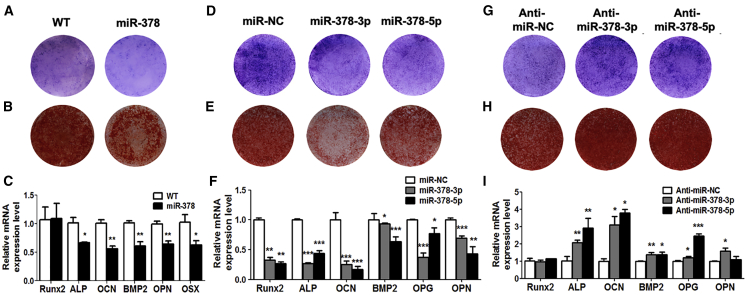
Figure 3 miR-378 Suppressed Osteogenesis of MSCs (A–C) Under osteogenic induction, ALP activity (A), calcified nodules (B), and osteogenic marker gene expression (C) were all suppressed in MSCs derived from miR-378 TG mice (n = 3; ∗p < 0.05, ∗∗p < 0.01, ∗∗∗p < 0.001 versus WT group). (D–F) ALP activity (D), calcified nodule formation (E), and osteogenic marker genes expression (F) were all decreased by miR-378-3p or miR-378-5p mimics (n = 3; ∗p < 0.05, ∗∗p < 0.01, ∗∗∗p < 0.001 versus miR-NC group). (G–I) ALP activity (G), calcified nodule formation (H), and osteogenesis marker gene expression (I) were promoted by anti-miR-378-3p and anti-miR-378-5p (n = 3; ∗p < 0.05, ∗∗p < 0.01, ∗∗∗p < 0.001 versus anti-miR-NC group).
Figure 3 miR-378 Suppressed Osteogenesis of MSCs (A–C) Under osteogenic induction, ALP activity (A), calcified nodules (B), and osteogenic marker gene expression (C) were all suppressed in MSCs derived from miR-378 TG mice (n = 3; ∗p < 0.05, ∗∗p < 0.01, ∗∗∗p < 0.001 versus WT group). (D–F) ALP activity (D), calcified nodule formation (E), and osteogenic marker genes expression (F) were all decreased by miR-378-3p or miR-378-5p mimics (n = 3; ∗p < 0.05, ∗∗p < 0.01, ∗∗∗p < 0.001 versus miR-NC group). (G–I) ALP activity (G), calcified nodule formation (H), and osteogenesis marker gene expression (I) were promoted by anti-miR-378-3p and anti-miR-378-5p (n = 3; ∗p < 0.05, ∗∗p < 0.01, ∗∗∗p < 0.001 versus anti-miR-NC group).CC BY · PubMed Central
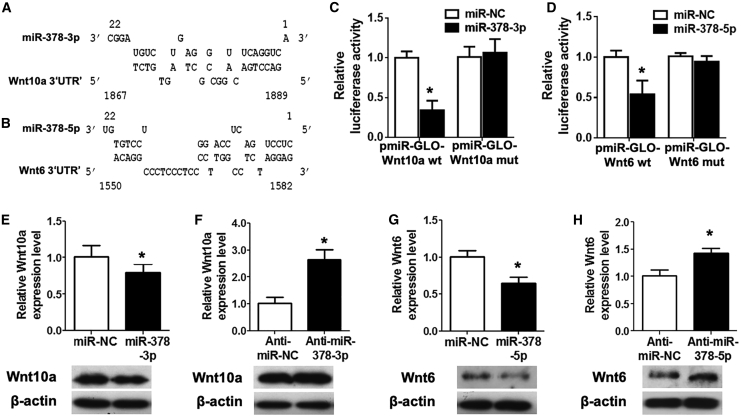
Figure 4 Wnt10a and Wnt6 Were Bona Fide Targets for miR-378-3p and miR-378-5p, Respectively (A and B) Schematic diagrams of the interaction between miR-378-3p (A) and miR-378-5p (B) transcripts and their direct target genes Wnt10a (A) and Wnt6 (B). (C and D) miR-378-3p (C) or miR-378-5p (D) was cotransfected with the Wnt10a (C) or Wnt6 (D) luciferase reporter into HEK293 cells, and the luciferase activity was measured (n = 3; ∗p < 0.05 versus miR-NC group). (E and F) Expression of Wnt10a was suppressed by miR-378-3p mimics (E), whereas promoted by its antagonist (F) at mRNA and protein levels (n = 3; ∗p < 0.05 versus miR-NC or anti-miR-NC group, respectively). (G and H) Expression of Wnt6 was reduced by miR-378-5p mimics (G), whereas enhanced by its antagonist (H) at mRNA and protein levels (n = 3; ∗p < 0.05 versus miR-NC or anti-miR-NC group, respectively).
Figure 4 Wnt10a and Wnt6 Were Bona Fide Targets for miR-378-3p and miR-378-5p, Respectively (A and B) Schematic diagrams of the interaction between miR-378-3p (A) and miR-378-5p (B) transcripts and their direct target genes Wnt10a (A) and Wnt6 (B). (C and D) miR-378-3p (C) or miR-378-5p (D) was cotransfected with the Wnt10a (C) or Wnt6 (D) luciferase reporter into HEK293 cells, and the luciferase activity was measured (n = 3; ∗p < 0.05 versus miR-NC group). (E and F) Expression of Wnt10a was suppressed by miR-378-3p mimics (E), whereas promoted by its antagonist (F) at mRNA and protein levels (n = 3; ∗p < 0.05 versus miR-NC or anti-miR-NC group, respectively). (G and H) Expression of Wnt6 was reduced by miR-378-5p mimics (G), whereas enhanced by its antagonist (H) at mRNA and protein levels (n = 3; ∗p < 0.05 versus miR-NC or anti-miR-NC group, respectively).CC BY · PubMed Central
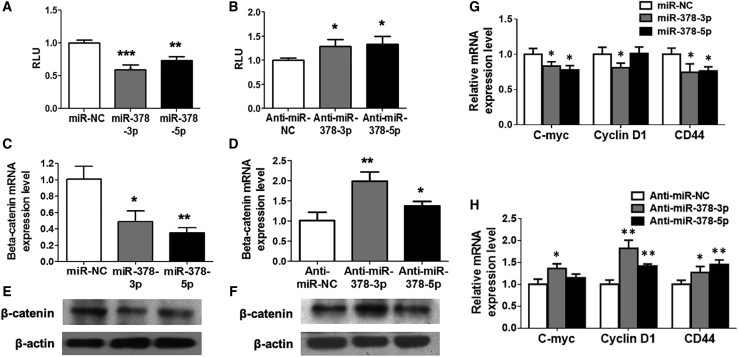
Figure 5 Wnt/β-Catenin Signaling Was Suppressed in miR-378-Mediated Osteogenesis (A and B) miR-378 mimics suppressed (A), whereas their antagonist promoted (B) the TOPflash luciferase activity (n = 3; ∗p < 0.05, ∗∗p < 0.01, ∗∗∗p < 0.001 versus miR-NC or anti-miR-NC group, respectively). (C–F) Expression of β-catenin was evaluated with miR-378 mimics or the antagonists’ treatment at mRNA (C and D) and protein (E and F) levels (n = 3; ∗p < 0.05, ∗∗p < 0.01 versus miR-NC or anti-miR-NC group, respectively). (G and H) miR-378 mimics (G) suppressed, whereas their antagonists (H) activated several downstream target genes of β-catenin (n = 3; ∗p < 0.05, ∗∗p < 0.01 versus miR-NC or anti-miR-NC group, respectively).
Figure 5 Wnt/β-Catenin Signaling Was Suppressed in miR-378-Mediated Osteogenesis (A and B) miR-378 mimics suppressed (A), whereas their antagonist promoted (B) the TOPflash luciferase activity (n = 3; ∗p < 0.05, ∗∗p < 0.01, ∗∗∗p < 0.001 versus miR-NC or anti-miR-NC group, respectively). (C–F) Expression of β-catenin was evaluated with miR-378 mimics or the antagonists’ treatment at mRNA (C and D) and protein (E and F) levels (n = 3; ∗p < 0.05, ∗∗p < 0.01 versus miR-NC or anti-miR-NC group, respectively). (G and H) miR-378 mimics (G) suppressed, whereas their antagonists (H) activated several downstream target genes of β-catenin (n = 3; ∗p < 0.05, ∗∗p < 0.01 versus miR-NC or anti-miR-NC group, respectively).CC BY · PubMed Central
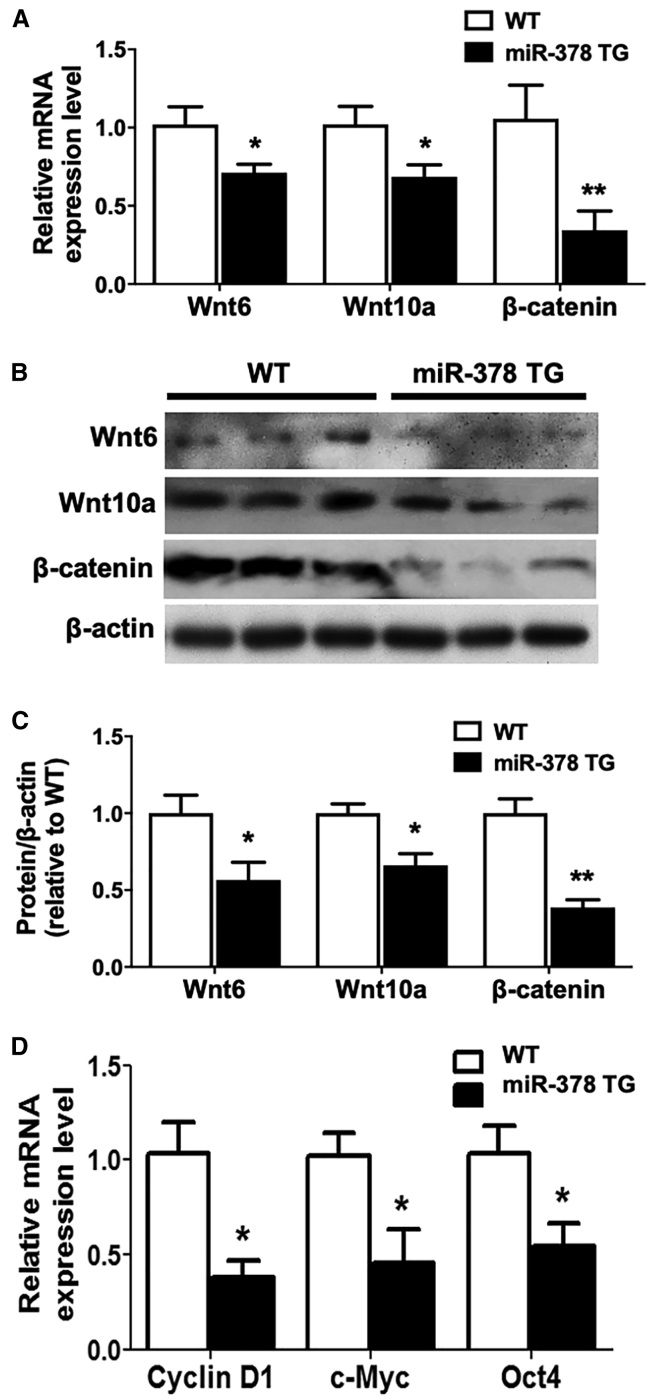
Figure 6 Wnt/β-Catenin Signaling Was Suppressed in miR-378 TG Mice (A) Expression of Wnt10a, Wnt6, and β-catenin was decreased in the MSCs derived from miR-378 TG mice at the mRNA level (n = 3; ∗p < 0.05 versus WT group). (B and C) Western blot (B) and semiquantitative analysis (C) revealed that Wnt10a, Wnt6, and β-catenin protein expression was suppressed in the MSCs isolated from miR-378 TG mice. (D) Several downstream target genes of β-catenin were downregulated in the MSCs derived from miR-378 TG mice (n = 3; ∗p < 0.05 versus WT group).
Figure 6 Wnt/β-Catenin Signaling Was Suppressed in miR-378 TG Mice (A) Expression of Wnt10a, Wnt6, and β-catenin was decreased in the MSCs derived from miR-378 TG mice at the mRNA level (n = 3; ∗p < 0.05 versus WT group). (B and C) Western blot (B) and semiquantitative analysis (C) revealed that Wnt10a, Wnt6, and β-catenin protein expression was suppressed in the MSCs isolated from miR-378 TG mice. (D) Several downstream target genes of β-catenin were downregulated in the MSCs derived from miR-378 TG mice (n = 3; ∗p < 0.05 versus WT group).CC BY · PubMed Central
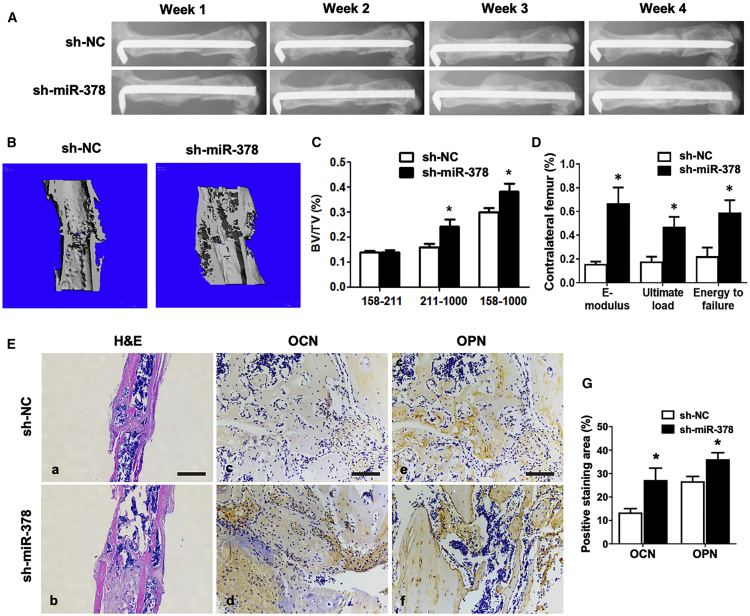
Figure 7 sh-miR-378-Mediated MSCs Accelerated Bone-Fracture Healing in Mice (A) X-ray radiography was taken during the course of fracture healing. Representative images showed that the fractured site was covered by more calluses, and bone remodeling was more vigorous in the sh-miR-378 group. (B) Three-dimensional micro-CT images showed a better fracture-healing effect condition and more calluses in the sh-miR-378 group. (C) Statistical diagram of BV/TV calculated from micro-CT results was displayed (age: 3 months; n = 10; ∗p < 0.05 versus sh-NC group). (D) Three-point bending mechanical testing at week 4 postsurgery was performed, and the statistical data were displayed (n = 10; ∗p < 0.05 versus sh-NC group). (E, a and b) H&E staining revealed more callus covered in the femur fracture site of the sh-miR-378 group at week 4. Scale bar, 800 μm. (E, c–g) Immunohistochemistry staining and semiquantitative analysis revealed more OCN and OPN expressed in the new bone zone in the sh-miR-378 treatment group by immunohistochemistry staining. Scale bars, 100 μm.
Figure 7 sh-miR-378-Mediated MSCs Accelerated Bone-Fracture Healing in Mice (A) X-ray radiography was taken during the course of fracture healing. Representative images showed that the fractured site was covered by more calluses, and bone remodeling was more vigorous in the sh-miR-378 group. (B) Three-dimensional micro-CT images showed a better fracture-healing effect condition and more calluses in the sh-miR-378 group. (C) Statistical diagram of BV/TV calculated from micro-CT results was displayed (age: 3 months; n = 10; ∗p < 0.05 versus sh-NC group). (D) Three-point bending mechanical testing at week 4 postsurgery was performed, and the statistical data were displayed (n = 10; ∗p < 0.05 versus sh-NC group). (E, a and b) H&E staining revealed more callus covered in the femur fracture site of the sh-miR-378 group at week 4. Scale bar, 800 μm. (E, c–g) Immunohistochemistry staining and semiquantitative analysis revealed more OCN and OPN expressed in the new bone zone in the sh-miR-378 treatment group by immunohistochemistry staining. Scale bars, 100 μm.CC BY · PubMed Central

Verification

Claims the paper makes

The claims and statistics of this paper haven’t been checked yet.

Run the check — free, no account needed. It reads the open-access text and checks the sources it cites.

A few free checks a day · papers already verified open instantly · results are public

Claims other papers make about this one

Each is checked against this paper’s own text: does it say what the citing paper says it does?

Self-check

Percentages, sums and reported differences re-computed from the paper’s own numbers.

The self-check needs the paper’s full text.

Citations

Cites

Show all 2 references

Research works printed but not linked: 30

  1. Carrer, 2012, Control of mitochondrial metabolism and systemic energy homeostasis by microRNAs 378 and 378∗, Proc. Natl. Acad. Sci. USA, 109, 15330, 10.1073/pnas.1207605109 · DOI
  2. Huang, 2014, MicroRNA-125b regulates osteogenic differentiation of mesenchymal stem cells by targeting Cbfβ in vitro, Biochimie, 102, 47, 10.1016/j.biochi.2014.02.005 · DOI
  3. Xie, 2016, The role of miR-135-modified adipose-derived mesenchymal stem cells in bone regeneration, Biomaterials, 75, 279, 10.1016/j.biomaterials.2015.10.042 · DOI
  4. Li, 2008, A microRNA signature for a BMP2-induced osteoblast lineage commitment program, Proc. Natl. Acad. Sci. USA, 105, 13906, 10.1073/pnas.0804438105 · DOI
  5. Kim, 2009, miR-196a regulates proliferation and osteogenic differentiation in mesenchymal stem cells derived from human adipose tissue, J. Bone Miner. Res., 24, 816, 10.1359/jbmr.081230 · DOI
  6. Zhang, 2011, MiRNA-20a promotes osteogenic differentiation of human mesenchymal stem cells by co-regulating BMP signaling, RNA Biol., 8, 829, 10.4161/rna.8.5.16043 · DOI
  7. Zhang, 2011, MiR-637 maintains the balance between adipocytes and osteoblasts by directly targeting Osterix, Mol. Biol. Cell, 22, 3955, 10.1091/mbc.e11-04-0356 · DOI
  8. Hupkes, 2014, MicroRNA miR-378 promotes BMP2-induced osteogenic differentiation of mesenchymal progenitor cells, BMC Mol. Biol., 15, 1, 10.1186/1471-2199-15-1 · DOI
  9. You, 2014, MiR-378 overexpression attenuates high glucose-suppressed osteogenic differentiation through targeting CASP3 and activating PI3K/Akt signaling pathway, Int. J. Clin. Exp. Pathol., 7, 7249
  10. Kahai, 2009, MicroRNA miR-378 regulates nephronectin expression modulating osteoblast differentiation by targeting GalNT-7, PLoS ONE, 4, e7535, 10.1371/journal.pone.0007535 · DOI
  11. Cawthorn, 2012, Wnt6, Wnt10a and Wnt10b inhibit adipogenesis and stimulate osteoblastogenesis through a β-catenin-dependent mechanism, Bone, 50, 477, 10.1016/j.bone.2011.08.010 · DOI
  12. Yu, 2014, Expression profiling of PPARγ-regulated microRNAs in human subcutaneous and visceral adipogenesis in both genders, Endocrinology, 155, 2155, 10.1210/en.2013-2105 · DOI
  13. Yu, 2014, MicroRNA-378 functions as an onco-miR in nasopharyngeal carcinoma by repressing TOB2 expression, Int. J. Oncol., 44, 1215, 10.3892/ijo.2014.2283 · DOI
  14. Chen, 2012, MicroRNA-378 is associated with non-small cell lung cancer brain metastasis by promoting cell migration, invasion and tumor angiogenesis, Med. Oncol., 29, 1673, 10.1007/s12032-011-0083-x · DOI
  15. Ma, 2014, MiR-378 promotes the migration of liver cancer cells by down-regulating Fus expression, Cell. Physiol. Biochem., 34, 2266, 10.1159/000369669 · DOI
  16. Xu, 2014, TNF-α, IL-6, and leptin increase the expression of miR-378, an adipogenesis-related microRNA in human adipocytes, Cell Biochem. Biophys., 70, 771, 10.1007/s12013-014-9980-x · DOI
  17. Huang, 2015, MiR-378a-3p enhances adipogenesis by targeting mitogen-activated protein kinase 1, Biochem. Biophys. Res. Commun., 457, 37, 10.1016/j.bbrc.2014.12.055 · DOI
  18. Liu, 2015, MiR-378 Plays an Important Role in the Differentiation of Bovine Preadipocytes, Cell. Physiol. Biochem., 36, 1552, 10.1159/000430318 · DOI
  19. Zhang, 2016, miR-378 Activates the Pyruvate-PEP Futile Cycle and Enhances Lipolysis to Ameliorate Obesity in Mice, EBioMedicine, 5, 93, 10.1016/j.ebiom.2016.01.035 · DOI
  20. Duan, 2016, The role of the wnt/β-catenin signaling pathway in formation and maintenance of bone and teeth, Int. J. Biochem. Cell Biol., 77, 23, 10.1016/j.biocel.2016.05.015 · DOI
  21. Huang, 2015, MicroRNA-378 regulates neural stem cell proliferation and differentiation in vitro by modulating Tailless expression, Biochem. Biophys. Res. Commun., 466, 214, 10.1016/j.bbrc.2015.09.011 · DOI
  22. Zeng, 2017, miR-378 suppresses the proliferation, migration and invasion of colon cancer cells by inhibiting SDAD1, Cell. Mol. Biol. Lett., 22, 12, 10.1186/s11658-017-0041-5 · DOI
  23. Yu, 2016, Activation of Hepatic Stellate Cells is Inhibited by microRNA-378a-3p via Wnt10a, Cell. Physiol. Biochem., 39, 2409, 10.1159/000452509 · DOI
  24. Tang, 2009, BMP-9-induced osteogenic differentiation of mesenchymal progenitors requires functional canonical Wnt/beta-catenin signalling, J. Cell. Mol. Med., 13, 2448, 10.1111/j.1582-4934.2008.00569.x · DOI
  25. Semenov, 2006, LRP5 mutations linked to high bone mass diseases cause reduced LRP5 binding and inhibition by SOST, J. Biol. Chem., 281, 38276, 10.1074/jbc.M609509200 · DOI
  26. James, 2006, Different roles of Runx2 during early neural crest-derived bone and tooth development, J. Bone Miner. Res., 21, 1034, 10.1359/jbmr.060413 · DOI
  27. Jing, 2016, Suppression of EZH2 Prevents the Shift of Osteoporotic MSC Fate to Adipocyte and Enhances Bone Formation During Osteoporosis, Mol. Ther., 24, 217, 10.1038/mt.2015.152 · DOI
  28. Sun, 2015, mir-21 overexpressing mesenchymal stem cells accelerate fracture healing in a rat closed femur fracture model, BioMed Res. Int., 2015, 412327, 10.1155/2015/412327 · DOI
  29. Hauser, 2012, Analysis of serum microRNAs (miR-26a-2∗, miR-191, miR-337-3p and miR-378) as potential biomarkers in renal cell carcinoma, Cancer Epidemiol., 36, 391, 10.1016/j.canep.2012.04.001 · DOI
  30. Xu, 2016, Human fetal mesenchymal stem cell secretome enhances bone consolidation in distraction osteogenesis, Stem Cell Res. Ther., 7, 134, 10.1186/s13287-016-0392-2 · DOI

Cited by

Sorted by citations

Metadata

Authors
Feng, L., Zhang, J.-F., Shi, L., Yang, Z.-M., Wu, T.-Y., Wang, H.-X., Lin, W.-P., Lu, Y.-F., Lo, J. H. T., Zhu, D.-H., & Li, G.
Venue
Molecular Therapy Nucleic Acids
Publisher
Elsevier BV
Published
2020-09
Volume
21
Pages
1017-1028
ISSN
2162-2531
Cited by
46
References
2
Language
en
Funders
  • National Natural Science Foundation of China (81772322)
  • Chinese University of Hong Kong
  • Innovation and Technology Commission - Hong Kong (ITS/448/18)
  • General Research Fund of Shanghai Normal University (14120118, 14160917, 9054014 N_CityU102/15, C7030-18G, T13-402/17-N)

About these checks

Registry, retraction, Cites and statistics results are computed, not judged, with one exception: a printed reference that no index lists is read once by a model before it counts as a citation error. Claims are extracted by a model and kept only when their quote appears verbatim in the text; each cited source is then checked, with a model’s help, for whether it says what the claim relies on. Those verdicts can be wrong — read the claim’s quote and the cited source before relying on one.

Statistics and arithmetic are recomputed, not judged.

Confidence bands are shown only for fields calibrated on our annotated test set. None is calibrated yet, so no band is shown.

What counts as a claim ›How we measure confidence ›How we check this ›

Are you an author, or do you see a problem with this page? Request a review