Cited by 32

The DOI matches its Crossref record; 7 of the 7 references it cites were found in a registry or an index.

Controlling genetic heterogeneity in gene-edited hematopoietic stem cells by single-cell expansion

Becker, Hans Jiro, Ishida, Reiko, Wilkinson, Adam C., Kimura, Takaharu, Lee, Michelle Sue Jann, Coban, Cevayir, Ota, Yasunori, Tanaka, Yosuke, Roskamp, Meike, Sano, Tsubasa, Tojo, Arinobu, Kent, David G., Yamazaki, Satoshi·2023·Cell Stem Cell

Overview

The claims and statistics of this paper haven’t been checked yet.

Run the check — free, no account needed. It reads the open-access text and checks the sources it cites.

A few free checks a day · papers already verified open instantly · results are public

Integrity signals

Registry

Crossref · 10.1016/j.stem.2023.06.002

Cites

7 of 7 references verified0 citation errors · 0 not checkable

Statistics

Figures

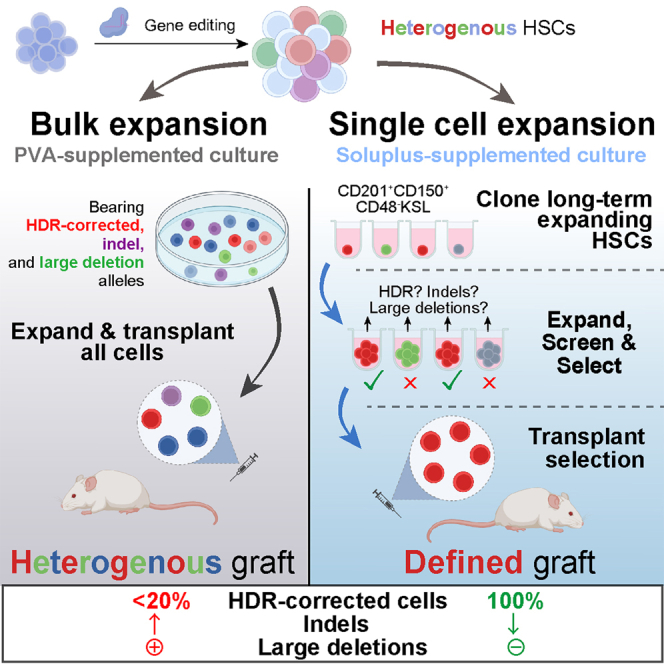
Graphical abstract
Graphical abstract CC BY · PubMed Central
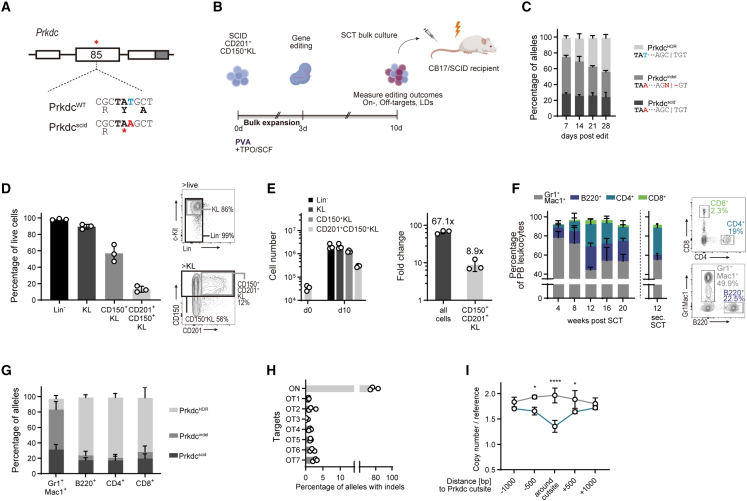
Figure 1 Autologous HSCT gene correction rescues the Prkdcscid phenotype but introduces on-, off-target indels and large deletions (A) Genomic context of the Prkdcscid mutation in exon 85. White boxes: exons, gray box, 3′ UTR. ∗ denotes location of Prkdcscid mutation. (B) Experimental scheme of the gene editing and HSC expansion model. (C) Post-editing allele distribution at the Prkdc locus, assessed by inference of CRISPR edit (ICE) (n = 3 cultures). (D) Fractions of immunophenotypically defined HSPC populations within cultures on day 10 of culture, 7 days post-editing. Percentage of all live cells (n = 3 cultures). (E) Absolute cell numbers (left panel) and fold-change expansion (right panel) of cultured HSPCs, day 10 of culture. (F) Left: frequencies of peripheral blood (PB) leukocytes as percentage of all live leukocytes (n = 3 groups, 3–4 mice per group). Plot next to dashed line shows frequencies 12 weeks post-secondary SCT (n = 5 mice). Right: representative fluorescence-activated cell sorting (FACS) plots 20 weeks post-transplant. (G) Frequencies of Prkdc alleles in sorted PB cells 20 weeks post-SCT (n = 3 experiments, 3–4 mice per group). (H) On- and off-target (OT) activity of the Prkdc-specific gRNA, assessed with tracking of indels by decomposition (TIDE). The seven highest scoring off-target sites, as predicted by COSMID, were interrogated. See Table S1 for detailed information about the off-target sites. (I) Copy-number analysis of Prkdc probes against reference gene (n = 3). Two-way ANOVA with Sidak’s multiple comparison test. Error bars represent SD. ∗p < 0.05, ∗∗∗∗p < 0.0001.
Figure 1 Autologous HSCT gene correction rescues the Prkdcscid phenotype but introduces on-, off-target indels and large deletions (A) Genomic context of the Prkdcscid mutation in exon 85. White boxes: exons, gray box, 3′ UTR. ∗ denotes location of Prkdcscid mutation. (B) Experimental scheme of the gene editing and HSC expansion model. (C) Post-editing allele distribution at the Prkdc locus, assessed by inference of CRISPR edit (ICE) (n = 3 cultures). (D) Fractions of immunophenotypically defined HSPC populations within cultures on day 10 of culture, 7 days post-editing. Percentage of all live cells (n = 3 cultures). (E) Absolute cell numbers (left panel) and fold-change expansion (right panel) of cultured HSPCs, day 10 of culture. (F) Left: frequencies of peripheral blood (PB) leukocytes as percentage of all live leukocytes (n = 3 groups, 3–4 mice per group). Plot next to dashed line shows frequencies 12 weeks post-secondary SCT (n = 5 mice). Right: representative fluorescence-activated cell sorting (FACS) plots 20 weeks post-transplant. (G) Frequencies of Prkdc alleles in sorted PB cells 20 weeks post-SCT (n = 3 experiments, 3–4 mice per group). (H) On- and off-target (OT) activity of the Prkdc-specific gRNA, assessed with tracking of indels by decomposition (TIDE). The seven highest scoring off-target sites, as predicted by COSMID, were interrogated. See Table S1 for detailed information about the off-target sites. (I) Copy-number analysis of Prkdc probes against reference gene (n = 3). Two-way ANOVA with Sidak’s multiple comparison test. Error bars represent SD. ∗p < 0.05, ∗∗∗∗p < 0.0001.CC BY · PubMed Central
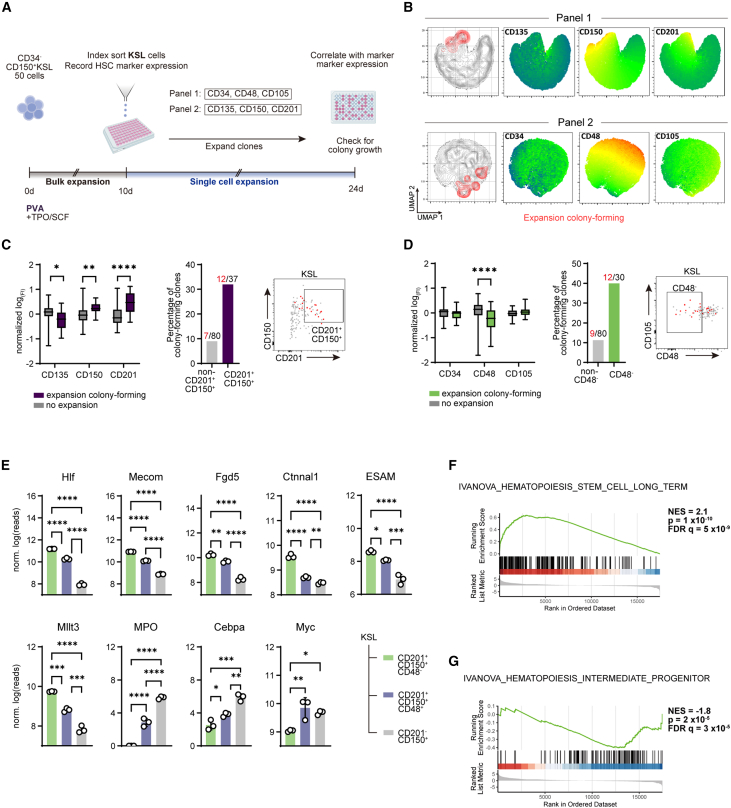
Figure 2 Identification of a surface marker combination for long-term (LT) expanding HSC clones (A) Experimental setup. (B) Uniform manifold approximation and projection (UMAP) representation of sorted KSL clones with overlay of panel 1 (upper) and 2 (lower) surface markers. Expansion colony-forming clones are indicated in red. (C and D) Quantification of markers associated with colony expansion. Left: fluorescence intensity (FI) measured at index sorting. Data presented as log-transformed and normalized to mean. Boxplots with whiskers showing minimum and maximum. Center: fraction of clones of the indicated phenotype showing LT expansion. Right: representative FACS sorting plots, LT-expanding clones indicated in red. (C) Panel 1 (n = 110 clones); (D) panel 2 (n = 117 clones). Multiple Mann-Whitney tests with FDR correction. (E) RNA-seq expression profiles of select HSC- and progenitor-associated genes. Error bars represent SD. One-way ANOVA with Tukey’s post-test. (F and G) Gene set enrichment analysis (GSEA) of differentially expressed genes in CD201+CD150+CD48−KSL (F) and CD201−CD150+KSL (G) cells. ∗p < 0.05, ∗∗p < 0.01, ∗∗∗p < 0.001, and ∗∗∗∗p < 0.0001.
Figure 2 Identification of a surface marker combination for long-term (LT) expanding HSC clones (A) Experimental setup. (B) Uniform manifold approximation and projection (UMAP) representation of sorted KSL clones with overlay of panel 1 (upper) and 2 (lower) surface markers. Expansion colony-forming clones are indicated in red. (C and D) Quantification of markers associated with colony expansion. Left: fluorescence intensity (FI) measured at index sorting. Data presented as log-transformed and normalized to mean. Boxplots with whiskers showing minimum and maximum. Center: fraction of clones of the indicated phenotype showing LT expansion. Right: representative FACS sorting plots, LT-expanding clones indicated in red. (C) Panel 1 (n = 110 clones); (D) panel 2 (n = 117 clones). Multiple Mann-Whitney tests with FDR correction. (E) RNA-seq expression profiles of select HSC- and progenitor-associated genes. Error bars represent SD. One-way ANOVA with Tukey’s post-test. (F and G) Gene set enrichment analysis (GSEA) of differentially expressed genes in CD201+CD150+CD48−KSL (F) and CD201−CD150+KSL (G) cells. ∗p < 0.05, ∗∗p < 0.01, ∗∗∗p < 0.001, and ∗∗∗∗p < 0.0001.CC BY · PubMed Central
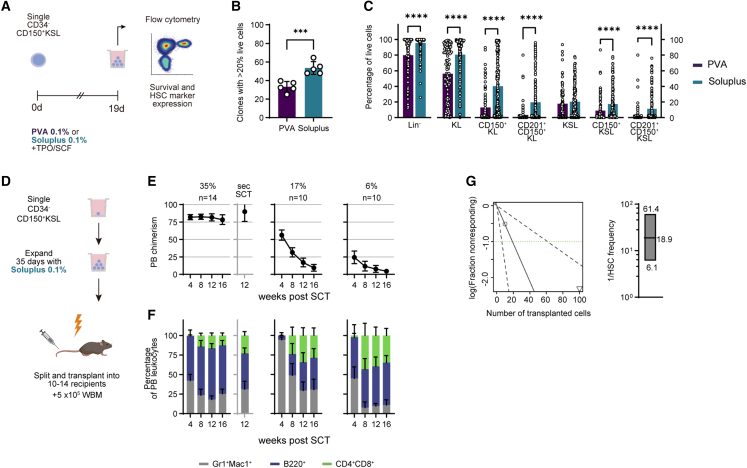
Figure 3 Optimization of polymer-based cultures for single-cell HSC expansion (A) Scheme of experimental setup. (B) Percentage of colonies with ≥20% live cells (n = 5 experiments). Unpaired, two-tailed t test. (C) Percentage of phenotypic HSC populations in live colonies cultured in PVA (n = 94)- and Soluplus (n = 155)-based media. Multiple Mann-Whitney tests with FDR correction. (D) Schematic of split-clone transplantation. (E and F) Donor PB chimerism (E) and lineage distribution (F) in 3 recipient groups transplanted with split clones. Numbers over graphs in (E) represent percentage of CD201+CD150+KSL cells in the transplanted clone (%) and the number of recipients (n). Secondary SCT was performed with the group showing highest chimerism, data shown in graph with gray axis. (G) Left: ELDA output of HSC frequency calculation. Right: boxplot represents calculated reciprocal mean, upper, and lower limits of HSC frequency. See also Figure S3 and Table S2. Error bars represent SD. ∗∗∗p < 0.001, ∗∗∗∗p < 0.0001.
Figure 3 Optimization of polymer-based cultures for single-cell HSC expansion (A) Scheme of experimental setup. (B) Percentage of colonies with ≥20% live cells (n = 5 experiments). Unpaired, two-tailed t test. (C) Percentage of phenotypic HSC populations in live colonies cultured in PVA (n = 94)- and Soluplus (n = 155)-based media. Multiple Mann-Whitney tests with FDR correction. (D) Schematic of split-clone transplantation. (E and F) Donor PB chimerism (E) and lineage distribution (F) in 3 recipient groups transplanted with split clones. Numbers over graphs in (E) represent percentage of CD201+CD150+KSL cells in the transplanted clone (%) and the number of recipients (n). Secondary SCT was performed with the group showing highest chimerism, data shown in graph with gray axis. (G) Left: ELDA output of HSC frequency calculation. Right: boxplot represents calculated reciprocal mean, upper, and lower limits of HSC frequency. See also Figure S3 and Table S2. Error bars represent SD. ∗∗∗p < 0.001, ∗∗∗∗p < 0.0001.CC BY · PubMed Central
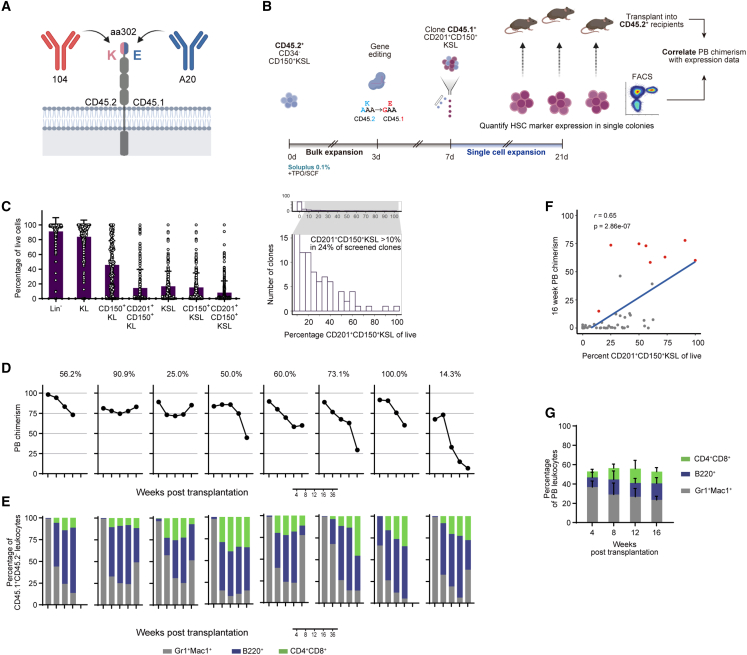
Figure 4 Single-cell cloning of gene-edited functional HSCs (A) Schematic showing the extracellular domain of CD45 with allele-specific antibody clones 104 and A20 and the epitope-defining amino acid. (B) Experimental setup of the single-cell editing and expansion experiment. (C) Left: fractions of CD201+CD150+KSL cells in single-cell-derived cultures 14 days after cloning (n = 261 clones). Right: Histogram of CD201+CD150+KSL cell frequency. Zoomed-in region shows clones with >10% CD201+CD150+KSL cells. (D and E) CD45.1+ donor PB chimerism (D) and lineage distribution (E) in single recipients with long-term (LT) engraftment ≥5% and multilineage reconstitution (n = 8). Numbers over graphs in (D) represent percentage of CD201+CD150+KSL cells in the transplanted clone (%). (F) Linear correlation plots of CD201+CD150+KSL cell frequency and 16-week donor chimerism. Red dots indicate LT repopulating and multilineage clones. Pearson correlation. (G) CD45.1+ PB chimerism and lineage distribution in secondary recipients (n = 5). See also Figure S4 and Table S3. Error bars represent SD.
Figure 4 Single-cell cloning of gene-edited functional HSCs (A) Schematic showing the extracellular domain of CD45 with allele-specific antibody clones 104 and A20 and the epitope-defining amino acid. (B) Experimental setup of the single-cell editing and expansion experiment. (C) Left: fractions of CD201+CD150+KSL cells in single-cell-derived cultures 14 days after cloning (n = 261 clones). Right: Histogram of CD201+CD150+KSL cell frequency. Zoomed-in region shows clones with >10% CD201+CD150+KSL cells. (D and E) CD45.1+ donor PB chimerism (D) and lineage distribution (E) in single recipients with long-term (LT) engraftment ≥5% and multilineage reconstitution (n = 8). Numbers over graphs in (D) represent percentage of CD201+CD150+KSL cells in the transplanted clone (%). (F) Linear correlation plots of CD201+CD150+KSL cell frequency and 16-week donor chimerism. Red dots indicate LT repopulating and multilineage clones. Pearson correlation. (G) CD45.1+ PB chimerism and lineage distribution in secondary recipients (n = 5). See also Figure S4 and Table S3. Error bars represent SD.CC BY · PubMed Central
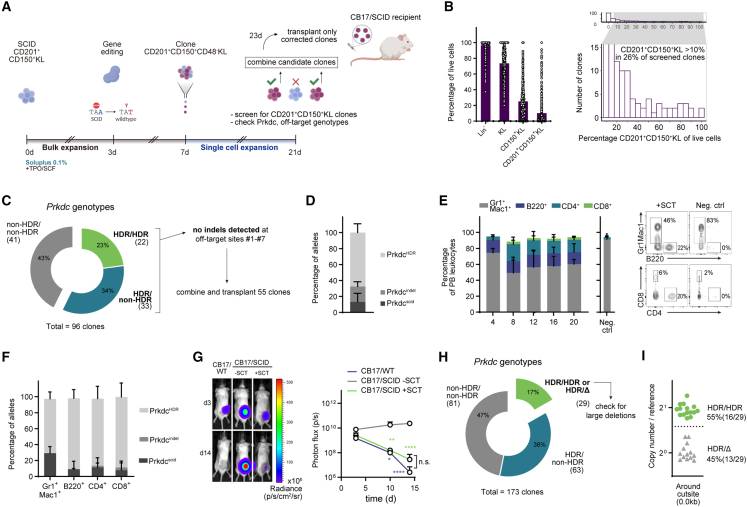
Figure 5 Autologous HSCT using gene-corrected HSC clones is curative in an immunodeficiency mouse model (A) Schematic of the single clone Prkdcscid correction model. (B) Single-cell SCID HSC expansion outcomes. Left: frequencies of phenotypic HSC populations in screened colonies (n = 384 from 3 experiments). Right: histogram of CD201+CD150+KL cell frequency. Enlarged region shows clones with ≥10% CD201+CD150+KL cells. (C) Genotyping of candidate clones (Sanger sequencing) (n = 96 clones, 3 experiments). Only clones with at least one HDR-corrected allele were sequenced at the off-target loci. (D) Allelic composition of the combined cell mixture at the edited Prkdc locus (n = 3). (E) Frequencies of PB leukocytes in CB17/SCID recipients. Left: lineage distributions in treated mice (n = 3) and in recipients receiving only 2 × 10⁵ CB17/SCID whole bone marrow cells (neg. ctrl., n = 3). Right: representative FACS plots at 16 weeks post-SCT. (F) Allele frequencies in sorted PB cells 20 weeks post-SCT (n = 3 mice from 3 experiments). (G) Xenograft transplantation assay. A549 cells expressing the luminescent reporter Akaluc were injected subcutaneously (s.c.) and tumor growth was tracked by in vivo imaging. Left: representative images from CB17/WT, transplanted CB17/SCID, and untreated CB17/SCID mice 3 and 14 days after inoculation. Right: quantification of luminescence over a 14-day period (CB17/WT: n = 4, CB17/SCID − SCT: n = 3, CB17/SCID + SCT: n = 3). Two-way ANOVA and Tukey’s multiple comparison test. (H) Genotyping of candidate clones (Sanger sequencing) (n = 173 clones, 2 experiments). Clones producing a single, HDR-corrected sequencing trace were checked for LD (n = 29). PrkdcHDR/HDR, homozygous correction; PrkdcHDR/Δ, hemizygosity. (I) Prkdc copy-number analysis using 0.0 kb Prkdc (around cutsite) probe, quantified against reference gene. See also Figure S5. Error bars represent SD. ∗p < 0.05, ∗∗p < 0.01, and ∗∗∗∗p < 0.0001.
Figure 5 Autologous HSCT using gene-corrected HSC clones is curative in an immunodeficiency mouse model (A) Schematic of the single clone Prkdcscid correction model. (B) Single-cell SCID HSC expansion outcomes. Left: frequencies of phenotypic HSC populations in screened colonies (n = 384 from 3 experiments). Right: histogram of CD201+CD150+KL cell frequency. Enlarged region shows clones with ≥10% CD201+CD150+KL cells. (C) Genotyping of candidate clones (Sanger sequencing) (n = 96 clones, 3 experiments). Only clones with at least one HDR-corrected allele were sequenced at the off-target loci. (D) Allelic composition of the combined cell mixture at the edited Prkdc locus (n = 3). (E) Frequencies of PB leukocytes in CB17/SCID recipients. Left: lineage distributions in treated mice (n = 3) and in recipients receiving only 2 × 10⁵ CB17/SCID whole bone marrow cells (neg. ctrl., n = 3). Right: representative FACS plots at 16 weeks post-SCT. (F) Allele frequencies in sorted PB cells 20 weeks post-SCT (n = 3 mice from 3 experiments). (G) Xenograft transplantation assay. A549 cells expressing the luminescent reporter Akaluc were injected subcutaneously (s.c.) and tumor growth was tracked by in vivo imaging. Left: representative images from CB17/WT, transplanted CB17/SCID, and untreated CB17/SCID mice 3 and 14 days after inoculation. Right: quantification of luminescence over a 14-day period (CB17/WT: n = 4, CB17/SCID − SCT: n = 3, CB17/SCID + SCT: n = 3). Two-way ANOVA and Tukey’s multiple comparison test. (H) Genotyping of candidate clones (Sanger sequencing) (n = 173 clones, 2 experiments). Clones producing a single, HDR-corrected sequencing trace were checked for LD (n = 29). PrkdcHDR/HDR, homozygous correction; PrkdcHDR/Δ, hemizygosity. (I) Prkdc copy-number analysis using 0.0 kb Prkdc (around cutsite) probe, quantified against reference gene. See also Figure S5. Error bars represent SD. ∗p < 0.05, ∗∗p < 0.01, and ∗∗∗∗p < 0.0001.CC BY · PubMed Central
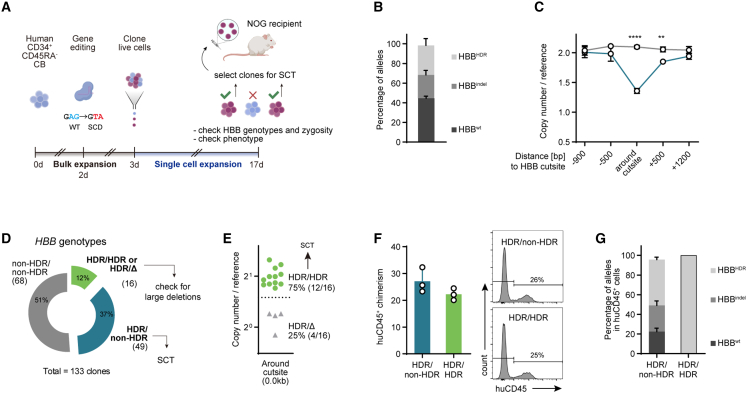
Figure 6 Controlling genetic heterogeneity in gene-edited human HSCs (A) Scheme of experimental setup. (B) Post-editing allele distribution at the HBB locus, assessed by ICE (n = 3 cultures). (C) Copy-number analysis of HBB probes against reference gene (n = 3). Two-way ANOVA with Sidak’s multiple comparison test. (D) Genotyping of candidate clones (Sanger sequencing) (n = 133 clones, 2 experiments). Heterozygous clones were combined for SCT. Clones producing a single, HDR-edited sequencing trace were checked for LD (n = 16). (E) Copy-number analysis of HBB probe 0.0 kb against reference gene. (F) Left: spleen huCD45+ chimerism in HBBHDR/non-HDR and HBBHDR/HDR groups (n = 3 each). Right: representative FACS plots. (G) Percentage of HDR alleles in huCD45+ cells sorted from bone marrow and spleens of HBBHDR/non-HDR and HBBHDR/HDR engrafted mice (n = 3 each). ∗∗p < 0.01, ∗∗∗∗p < 0.0001.
Figure 6 Controlling genetic heterogeneity in gene-edited human HSCs (A) Scheme of experimental setup. (B) Post-editing allele distribution at the HBB locus, assessed by ICE (n = 3 cultures). (C) Copy-number analysis of HBB probes against reference gene (n = 3). Two-way ANOVA with Sidak’s multiple comparison test. (D) Genotyping of candidate clones (Sanger sequencing) (n = 133 clones, 2 experiments). Heterozygous clones were combined for SCT. Clones producing a single, HDR-edited sequencing trace were checked for LD (n = 16). (E) Copy-number analysis of HBB probe 0.0 kb against reference gene. (F) Left: spleen huCD45+ chimerism in HBBHDR/non-HDR and HBBHDR/HDR groups (n = 3 each). Right: representative FACS plots. (G) Percentage of HDR alleles in huCD45+ cells sorted from bone marrow and spleens of HBBHDR/non-HDR and HBBHDR/HDR engrafted mice (n = 3 each). ∗∗p < 0.01, ∗∗∗∗p < 0.0001.CC BY · PubMed Central

Verification

Claims the paper makes

The claims and statistics of this paper haven’t been checked yet.

Run the check — free, no account needed. It reads the open-access text and checks the sources it cites.

A few free checks a day · papers already verified open instantly · results are public

Claims other papers make about this one

Each is checked against this paper’s own text: does it say what the citing paper says it does?

Self-check

Percentages, sums and reported differences re-computed from the paper’s own numbers.

The self-check needs the paper’s full text.

Citations

Cites

Research works printed but not linked: 47

  1. Naldini, 2019, Genetic engineering of hematopoiesis: current stage of clinical translation and future perspectives, EMBO Mol. Med., 11, 1, 10.15252/emmm.201809958 · DOI
  2. Schiroli, 2017, Preclinical modeling highlights the therapeutic potential of hematopoietic stem cell gene editing for correction of SCID-X1, Sci. Transl. Med., 9, 10.1126/scitranslmed.aan0820 · DOI · Paper page
  3. De Ravin, 2017, CRISPR-Cas9 gene repair of hematopoietic stem cells from patients with X-linked chronic granulomatous disease, Sci. Transl. Med., 9, 10.1126/scitranslmed.aah3480 · DOI · Paper page
  4. Mohrin, 2010, Hematopoietic stem cell quiescence promotes error-prone DNA repair and mutagenesis, Cell Stem Cell, 7, 174, 10.1016/j.stem.2010.06.014 · DOI · Paper page
  5. Adikusuma, 2018, Large deletions induced by Cas9 cleavage, Nature, 560, E8, 10.1038/s41586-018-0380-z · DOI · Paper page
  6. Boutin, 2021, CRISPR-Cas9 globin editing can induce megabase-scale copy-neutral losses of heterozygosity in hematopoietic cells, Nat. Commun., 12, 4922, 10.1038/s41467-021-25190-6 · DOI
  7. Leibowitz, 2021, Chromothripsis as an on-target consequence of CRISPR–Cas9 genome editing, Nat. Genet., 53, 895, 10.1038/s41588-021-00838-7 · DOI · Paper page
  8. Lattanzi, 2021, Development of β-globin gene correction in human hematopoietic stem cells as a potential durable treatment for sickle cell disease, Sci. Transl. Med., 13, 10.1126/scitranslmed.abf2444 · DOI
  9. Tsai, 2016, Defining and improving the genome-wide specificities of CRISPR-Cas9 nucleases, Nat. Rev. Genet., 17, 300, 10.1038/nrg.2016.28 · DOI
  10. Wilkinson, 2020, Haematopoietic stem cell self-renewal in vivo and ex vivo, Nat. Rev. Genet., 21, 541, 10.1038/s41576-020-0241-0 · DOI · Paper page
  11. Wilkinson, 2019, Long-term ex vivo haematopoietic-stem-cell expansion allows nonconditioned transplantation, Nature, 571, 117, 10.1038/s41586-019-1244-x · DOI · Paper page
  12. Araki, 1997, Nonsense mutation at Tyr-4046 in the DNA-dependent protein kinase catalytic subunit of severe combined immune deficiency mice, Proc. Natl. Acad. Sci. USA, 94, 2438, 10.1073/pnas.94.6.2438 · DOI
  13. Vazquez, 2015, CD201 and CD27 identify hematopoietic stem and progenitor cells across multiple murine strains independently of Kit and Sca-1, Exp. Hematol., 43, 578, 10.1016/j.exphem.2015.04.001 · DOI
  14. Wilkinson, 2021, Cas9-AAV6 gene correction of beta-globin in autologous HSCs improves sickle cell disease erythropoiesis in mice, Nat. Commun., 12, 686, 10.1038/s41467-021-20909-x · DOI
  15. Noda, 2008, Repopulating activity of ex vivo-expanded murine hematopoietic stem cells resides in the CD48−c-kit + Sca-1+ lineage marker− cell population, Stem Cells, 26, 646, 10.1634/stemcells.2007-0623 · DOI
  16. Zhang, 2005, Murine hematopoietic stem cells change their surface phenotype during ex vivo expansion, Blood, 105, 4314, 10.1182/blood-2004-11-4418 · DOI
  17. Linn, 2012, Soluplus® as an effective absorption enhancer of poorly soluble drugs in vitro and in vivo, Eur. J. Pharm. Sci., 45, 336, 10.1016/j.ejps.2011.11.025 · DOI
  18. Nishimura, 2019, Use of polyvinyl alcohol for chimeric antigen receptor T-cell expansion, Exp. Hematol., 80, 16, 10.1016/j.exphem.2019.11.007 · DOI
  19. Hu, 2009, ELDA: extreme limiting dilution analysis for comparing depleted and enriched populations in stem cell and other assays, J. Immunol. Methods, 347, 70, 10.1016/j.jim.2009.06.008 · DOI
  20. Komuro, 1974, Ly-5: a new T-lymphocyte antigen system, Immunogenetics, 1, 452, 10.1007/BF01564083 · DOI
  21. Zebedee, 1991, Comparison of mouse Ly5a and Ly5b leucocyte common antigen alleles, Dev. Immunol., 1, 243
  22. Mercier, 2016, Single targeted exon mutation creates a true congenic mouse for competitive hematopoietic stem cell transplantation: the C57BL/6-CD45.1 STEM mouse, Stem Cell Rep., 6, 985, 10.1016/j.stemcr.2016.04.010 · DOI · Paper page
  23. Pannetier, 1993, The sizes of the CDR3 hypervariable regions of the murine T-cell receptor β chains vary as a function of the recombined germ-line segments, Proc. Natl. Acad. Sci. USA, 90, 4319, 10.1073/pnas.90.9.4319 · DOI
  24. Lee, 2019, B cell-intrinsic MyD88 signaling controls IFN-γ-mediated early IgG2c class switching in mice in response to a particulate adjuvant, Eur. J. Immunol., 49, 1433, 10.1002/eji.201848084 · DOI
  25. Sheridan, 2021, CRISPR therapies march into clinic, but genotoxicity concerns linger, Nat. Biotechnol., 39, 897, 10.1038/d41587-021-00017-3 · DOI
  26. Obata, 2014, Improvement of the antitumor activity of poorly soluble sapacitabine (CS-682 ) by using Soluplus® as a surfactant, Biol. Pharm. Bull., 37, 802, 10.1248/bpb.b13-00898 · DOI
  27. Sakurai, 2023, Chemically defined cytokine-free expansion of human haematopoietic stem cells, Nature, 615, 127, 10.1038/s41586-023-05739-9 · DOI
  28. Abdul-Razak, 2018, Molecular evidence of genome editing in a mouse model of immunodeficiency, Sci. Rep., 8, 8214, 10.1038/s41598-018-26439-9 · DOI
  29. Rahman, 2015, Rescue of DNA-PK signaling and T-cell differentiation by targeted genome editing in a prkdc deficient iPSC disease model, PLoS Genet., 11, e1005239, 10.1371/journal.pgen.1005239 · DOI
  30. Che, 2022, Identification and characterization of in vitro expanded hematopoietic stem cells, EMBO Rep., 23, e55502, 10.15252/embr.202255502 · DOI
  31. Pattabhi, 2019, In vivo outcome of homology-directed repair at the HBB gene in HSC using alternative donor template delivery methods, Mol. Ther. Nucleic Acids, 17, 277, 10.1016/j.omtn.2019.05.025 · DOI
  32. Komor, 2016, Programmable editing of a target base in genomic DNA without double-stranded DNA cleavage, Nature, 533, 420, 10.1038/nature17946 · DOI · Paper page
  33. Nelson, 2022, Engineered pegRNAs improve prime editing efficiency, Nat. Biotechnol., 40, 402, 10.1038/s41587-021-01039-7 · DOI · Paper page
  34. Ferrari, 2020, Efficient gene editing of human long-term hematopoietic stem cells validated by clonal tracking, Nat. Biotechnol., 38, 1298, 10.1038/s41587-020-0551-y · DOI
  35. Sharma, 2021, The TRACE-Seq method tracks recombination alleles and identifies clonal reconstitution dynamics of gene targeted human hematopoietic stem cells, Nat. Commun., 12, 472, 10.1038/s41467-020-20792-y · DOI
  36. Tomellini, 2019, Integrin-α3 is a functional marker of ex vivo expanded human long-term hematopoietic stem cells, Cell Rep., 28, 10.1016/j.celrep.2019.06.084 · DOI
  37. Love, 2014, Moderated estimation of fold change and dispersion for RNA-seq data with DESeq2, Genome Biol., 15, 550, 10.1186/s13059-014-0550-8 · DOI · Paper page
  38. Wu, 2021, clusterProfiler 4.0: A universal enrichment tool for interpreting omics data, Innovation (Camb), 2, 100141
  39. Gu, 2016, Complex heatmaps reveal patterns and correlations in multidimensional genomic data, Bioinformatics, 32, 2847, 10.1093/bioinformatics/btw313 · DOI
  40. Igarashi, 2023, Physioxia improves the selectivity of hematopoietic stem cell expansion cultures, Blood Adv., 10.1182/bloodadvances.2023009668 · DOI
  41. Cradick, 2014, Cosmid: a web-based tool for identifying and validating CRISPR/Cas off-target sites, Mol. Ther. Nucleic Acids, 3, e214, 10.1038/mtna.2014.64 · DOI · Paper page
  42. Ahmed, 2009, Clonal expansions and loss of receptor diversity in the naive CD8 T cell repertoire of aged mice, J. Immunol., 182, 784, 10.4049/jimmunol.182.2.784 · DOI
  43. Miqueu, 2007, Statistical analysis of CDR3 length distributions for the assessment of T and B cell repertoire biases, Mol. Immunol., 44, 1057, 10.1016/j.molimm.2006.06.026 · DOI
  44. Iwano, 2018, Single-cell bioluminescence imaging of deep tissue in freely moving animals, Science, 359, 935, 10.1126/science.aaq1067 · DOI
  45. Wagenblast, 2021, Mapping the cellular origin and early evolution of leukemia in Down syndrome, Science, 373, 10.1126/science.abf6202 · DOI
  46. Ellis, 2021, Reliable detection of somatic mutations in solid tissues by laser-capture microdissection and low-input DNA sequencing, Nat. Protoc., 16, 841, 10.1038/s41596-020-00437-6 · DOI
  47. Notta, 2011, Isolation of single human hematopoietic stem cells capable of long-term multilineage engraftment, Science, 333, 218, 10.1126/science.1201219 · DOI · Paper page

Cited by

See all 32

Metadata

Authors
Becker, H. J., Ishida, R., Wilkinson, A. C., Kimura, T., Lee, M. S. J., Coban, C., Ota, Y., Tanaka, Y., Roskamp, M., Sano, T., Tojo, A., Kent, D. G., & Yamazaki, S.
Venue
Cell Stem Cell
Publisher
Elsevier BV
Published
2023-07
Volume
30
Issue
7
Pages
987-1000.e8
ISSN
1934-5909
Cited by
32
References
7
Language
en
Funders
  • Blood Cancer UK (15008)
  • German Research Foundation (BE 6847/1-1)
  • Nihon Gakujutsu Shinkokai (21F21108, 20K21612, 20K16234, 23K15315)
  • Institute of Medical Science, University of Tokyo
  • Medical Research Council (MC_PC_21043, MR/V005502/1)
  • BASF
  • Kay Kendall Leukaemia Fund
  • AMED (21bm0404077h0001, 21bm0704055h0002)
  • European Research Council
  • Japan Science and Technology Agency (18071245)
  • Cancer Research UK (DCRPGF\u2216100008)

About these checks

Registry, retraction, Cites and statistics results are computed, not judged, with one exception: a printed reference that no index lists is read once by a model before it counts as a citation error. Claims are extracted by a model and kept only when their quote appears verbatim in the text; each cited source is then checked, with a model’s help, for whether it says what the claim relies on. Those verdicts can be wrong — read the claim’s quote and the cited source before relying on one.

Statistics and arithmetic are recomputed, not judged.

Confidence bands are shown only for fields calibrated on our annotated test set. None is calibrated yet, so no band is shown.

What counts as a claim ›How we measure confidence ›How we check this ›

Are you an author, or do you see a problem with this page? Request a review