

The DOI matches its Crossref record; 47 of the 47 references it cites were found in a registry or an index.
Targeting Mitochondrial Complex I Overcomes Chemoresistance in High OXPHOS Pancreatic Cancer
Open accessAbstract
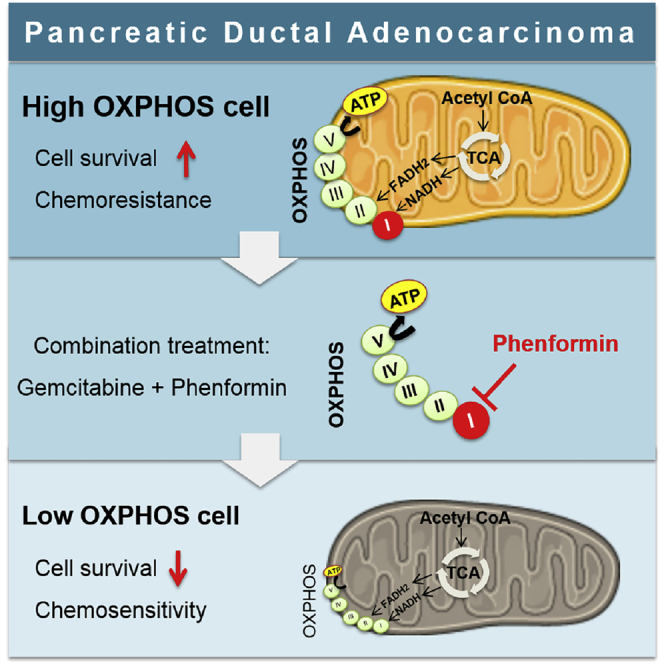
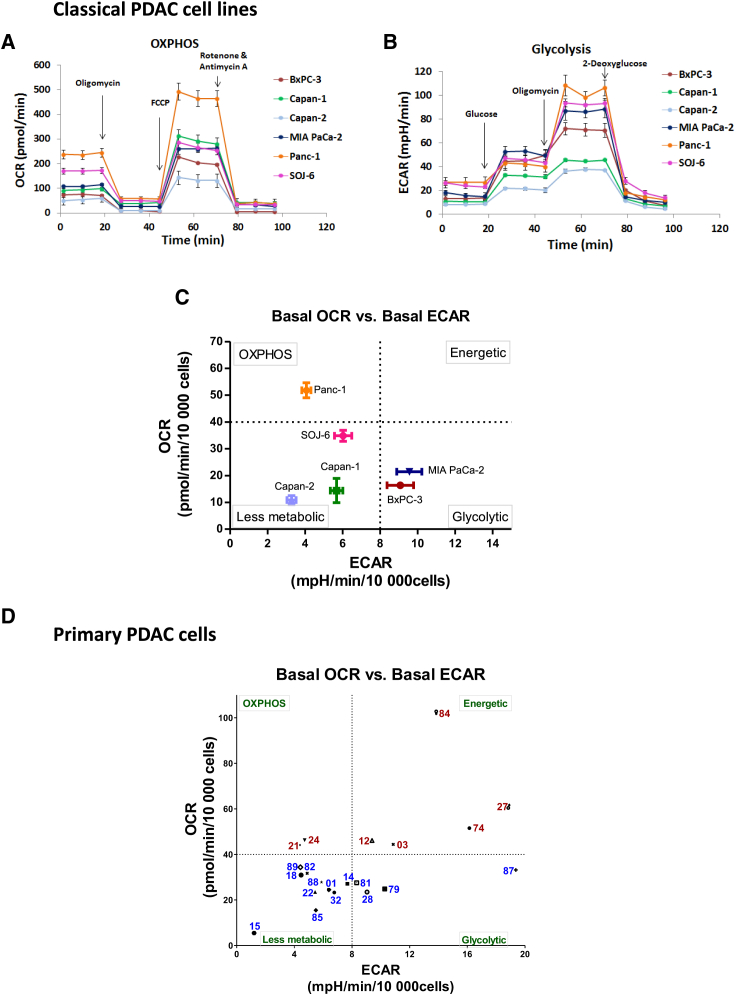
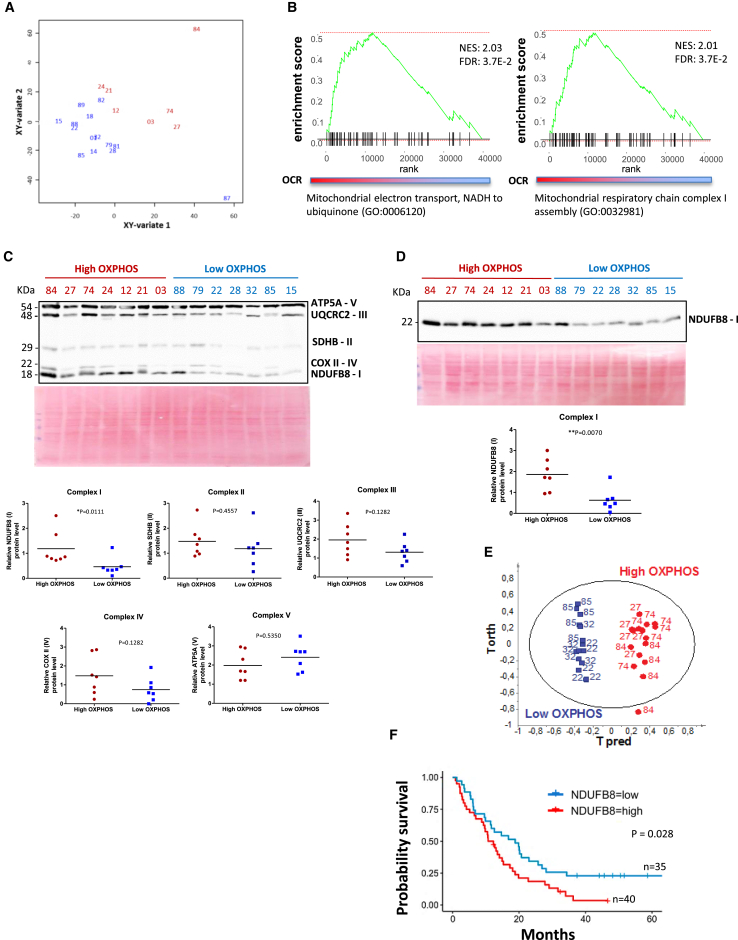
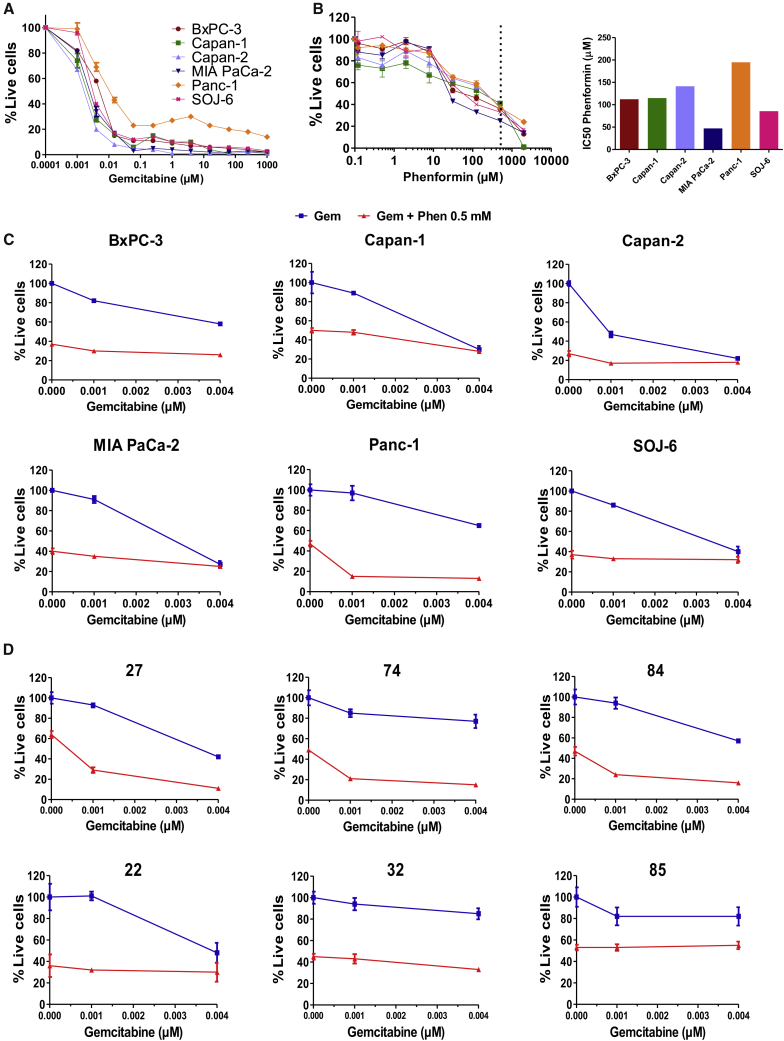
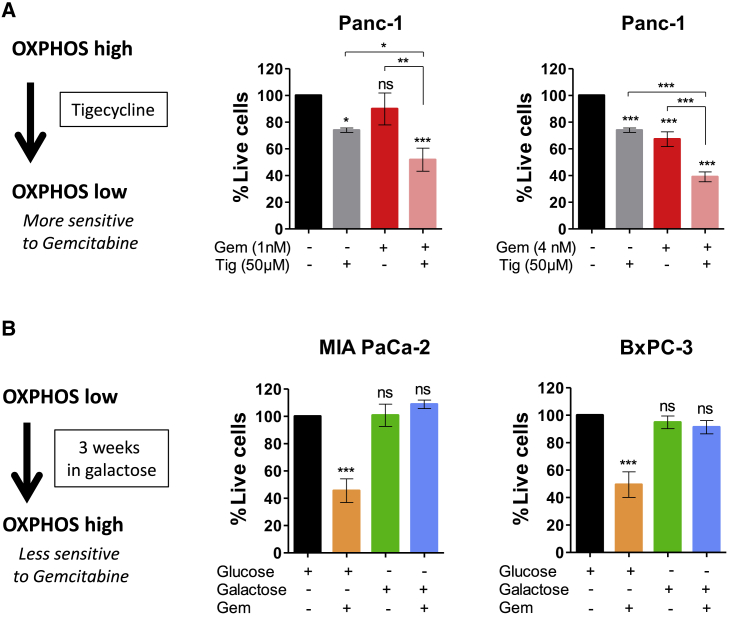
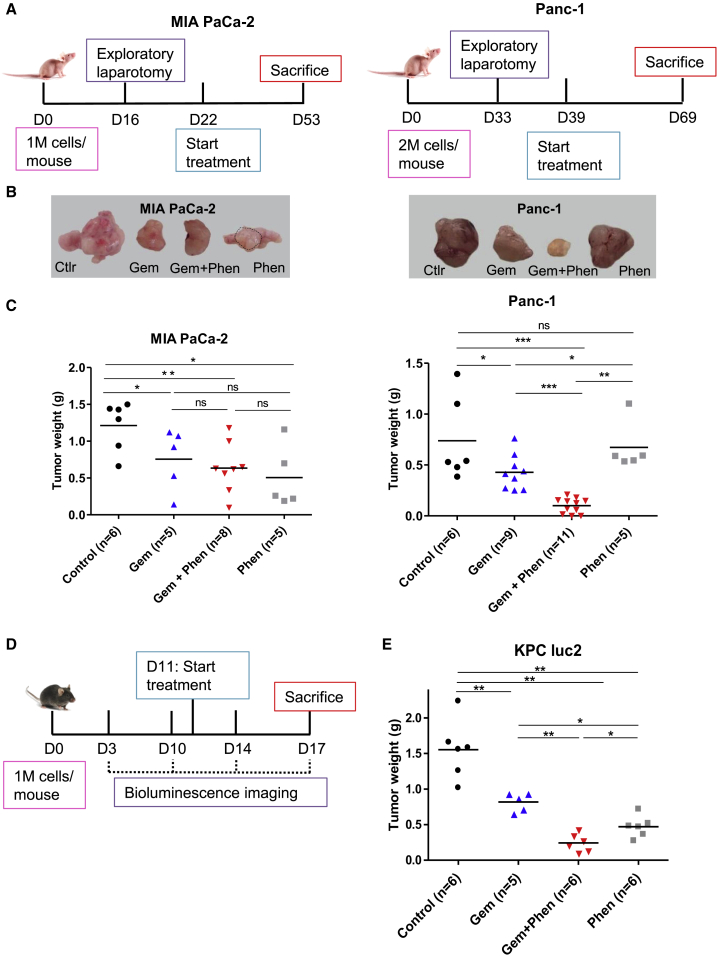
Mitochondrial respiration (oxidative phosphorylation, OXPHOS) is an emerging target in currently refractory cancers such as pancreatic ductal adenocarcinoma (PDAC). However, the variability of energetic metabolic adaptations between PDAC patients has not been assessed in functional investigations. In this work, we demonstrate that OXPHOS rates are highly heterogeneous between patient tumors, and that high OXPHOS tumors are enriched in mitochondrial respiratory complex I at protein and mRNA levels. Therefore, we treated PDAC cells with phenformin (complex I inhibitor) in combination with standard chemotherapy (gemcitabine), showing that this treatment is synergistic specifically in high OXPHOS cells. Furthermore, phenformin cooperates with gemcitabine in high OXPHOS tumors in two orthotopic mouse models (xenografts and syngeneic allografts). In conclusion, this work proposes a strategy to identify PDAC patients likely to respond to the targeting of mitochondrial energetic metabolism in combination with chemotherapy, and that phenformin should be clinically tested in appropriate PDAC patient subpopulations.
Overview
The claims and statistics of this paper haven’t been checked yet.
Run the check — free, no account needed. It reads the open-access text and checks the sources it cites.
Integrity signals
Registry
Cites
Statistics
Figures
Verification
Claims the paper makes
The claims and statistics of this paper haven’t been checked yet.
Run the check — free, no account needed. It reads the open-access text and checks the sources it cites.
Claims other papers make about this one
Each is checked against this paper’s own text: does it say what the citing paper says it does?
In the citing paper
“In doing so, we find that the regulatory consequences of Sp/Klf motif enrichment are in genes associated with modulation of reactive oxygen species and metabolism such as SOD144, ID145, and NDUFV246.”
From Occult polyclonality of preclinical pancreatic cancer models drives in vitro evolution (2022) · cites this paper as [46]
Self-check
Percentages, sums and reported differences re-computed from the paper’s own numbers.
The self-check needs the paper’s full text.
Citations
Cites
Siegel, R. L., Miller, K. D., & Jemal, A. (2018) · CA A Cancer Journal for Clinicians · doi:10.3322/caac.21442 · Cited by 16,632
Chou, T.-C., & Talalay, P. (1984) · Advances in Enzyme Regulation · doi:10.1016/0065-2571(84)90007-4 · Cited by 7,178
Rahib, L., Smith, B. D., Aizenberg, R., Rosenzweig, A. B., Fleshman, J. M., & Matrisian, L. M. (2014) · Cancer Research · doi:10.1158/0008-5472.can-14-0155 · Cited by 7,094
Drug combination studies and their synergy quantification using the Chou-Talalay method
Chou, T.-C. (2010) · Cancer Research · doi:10.1158/0008-5472.can-09-1947 · Cited by 5,739
Genomic analyses identify molecular subtypes of pancreatic cancer
Bailey, P., Chang, D. K., Nones, K., Johns, A. L., Patch, A.-M., Gingras, M.-C., Miller, D. K., Christ, A. N., Bruxner, T. J. C., Quinn, M. C., et al. (2016) · Nature · doi:10.1038/nature16965 · Cited by 3,621
HMDB 3.0—The Human Metabolome Database in 2013
Wishart, D. S., Jewison, T., Guo, A. C., Wilson, M., Knox, C., Liu, Y., Djoumbou-Feunang, Y., Mandal, R., Aziat, F., Dong, E., et al. (2012) · Nucleic Acids Research · doi:10.1093/nar/gks1065 · Cited by 2,845
Metformin and reduced risk of cancer in diabetic patients
Evans, J. M. M., Donnelly, L. A., Emslie-Smith, A. M., Alessi, D. R., & Morris, A. D. (2005) · BMJ · doi:10.1136/bmj.38415.708634.f7 · Cited by 2,388
OWEN, M. R., DORAN, E., & HALESTRAP, A. P. (2000) · Biochemical Journal · doi:10.1042/bj3480607 · Cited by 2,157
Oncogene ablation-resistant pancreatic cancer cells depend on mitochondrial function
Viale, A., Pettazzoni, P., Lyssiotis, C. A., Ying, H., Sánchez, N., Marchesini, M., Carugo, A., Green, T., Seth, S., Giuliani, V., et al. (2014) · Nature · doi:10.1038/nature13611 · Cited by 1,259
Oxidative Phosphorylation as an Emerging Target in Cancer Therapy
Ashton, T. M., McKenna, W. G., Kunz‐Schughart, L. A., & Higgins, G. S. (2018) · Clinical Cancer Research · doi:10.1158/1078-0432.ccr-17-3070 · Cited by 1,177
Cited by
Sorted by citations
Targeting OXPHOS and the electron transport chain in cancer; Molecular and therapeutic implications
Greene, J. P., Segaran, A., & Lord, S. (2022) · Seminars in Cancer Biology · doi:10.1016/j.semcancer.2022.02.002 · Cited by 215
The biological underpinnings of therapeutic resistance in pancreatic cancerPreprint
Beatty, G. L., Werba, G., Lyssiotis, C. A., & Simeone, D. M. (2021) · Genes & Development · doi:10.1101/gad.348523.121 · Cited by 139
Role of hypoxia in the tumor microenvironment and targeted therapy
Chen, G., Wu, K., Li, H., Xia, D., & He, T. (2022) · Frontiers in Oncology · doi:10.3389/fonc.2022.961637 · Cited by 148
Cancer resistance and metastasis are maintained through oxidative phosphorylation
Uslu, C., Kapan, E., & Lyakhovich, A. (2024) · Cancer Letters · doi:10.1016/j.canlet.2024.216705 · Cited by 112
Tidwell, T., Røsland, G. V., Tronstad, K. J., Søreide, K., & Hagland, H. R. (2022) · Cancer & Metabolism · doi:10.1186/s40170-022-00285-w · Cited by 86
Autophagy is a major metabolic regulator involved in cancer therapy resistance
Poillet-Perez, L., Sarry, J., & Joffre, C. (2021) · Cell Reports · doi:10.1016/j.celrep.2021.109528 · Cited by 85
OXPHOS-targeting drugs in oncology: new perspectives
Kalyanaraman, B., Cheng, G., Hardy, M., & You, M. (2023) · Expert Opinion on Therapeutic Targets · doi:10.1080/14728222.2023.2261631 · Cited by 81
Chemotherapy Resistance: Role of Mitochondrial and Autophagic Components
Bahar, E., Han, S., Kim, J., & Yoon, H. (2022) · Cancers · doi:10.3390/cancers14061462 · Cited by 67
Targeting Redox Metabolism in Pancreatic Cancer
Hadi, N. A., Reyes‐Castellanos, G., & Carrier, A. (2021) · International Journal of Molecular Sciences · doi:10.3390/ijms22041534 · Cited by 63
Self-citationJain, A., & Bhardwaj, V. (2021) · World Journal of Gastroenterology · doi:10.3748/wjg.v27.i39.6527 · Cited by 64
OXPHOS inhibitors, metabolism and targeted therapies in cancer
Cadassou, O., & Jordheim, L. P. (2023) · Biochemical Pharmacology · doi:10.1016/j.bcp.2023.115531 · Cited by 59
Acidosis orchestrates adaptations of energy metabolism in tumors
Groessl, S., Kalis, R., Snaebjornsson, M. T., Wambach, L., Haider, J., Andersch, F., Schulze, A., Palm, W., & Zuber, J. A. (2025) · Science · doi:10.1126/science.adp7603 · Cited by 58
Ether phospholipids are required for mitochondrial reactive oxygen species homeostasis
Chen, Z., Ho, I.-L., Soeung, M., Yen, E.-Y., Liu, J., Liang, Y., Rose, J. L., Srinivasan, S., Jiang, S., Chang, Q., et al. (2023) · Nature Communications · doi:10.1038/s41467-023-37924-9 · Cited by 52
Kaoutari, A. E., Fraunhoffer, N. A., Hoare, O., Teyssedou, C., Soubeyran, P., Gayet, O., Roques, J., Lomberk, G. A., Urrutia, R. A., Dusetti, N., et al. (2021) · EBioMedicine · doi:10.1016/j.ebiom.2021.103332 · Cited by 45
Self-citationDiscovery of the Highly Selective and Potent STAT3 Inhibitor for Pancreatic Cancer Treatment
Huang, C., Bian, A., Zhou, W., Miao, Y., Ye, J., Li, J., He, P., Zhang, Q., Sun, Y., Sun, Z., et al. (2024) · ACS Central Science · doi:10.1021/acscentsci.3c01440 · Cited by 45
Duan, H., Ren, J., Wei, S., Yang, Z., Li, C., Wang, Z., Li, M., Wei, Z., Liu, Y., Wang, X., et al. (2024) · Genome Medicine · doi:10.1186/s13073-024-01410-8 · Cited by 47
Mitochondria Deregulations in Cancer Offer Several Potential Targets of Therapeutic Interventions
Musicco, C., Signorile, A., Pesce, V., Polosa, P. L., & Cormio, A. (2023) · International Journal of Molecular Sciences · doi:10.3390/ijms241310420 · Cited by 45
Zhou, Y., Zou, J., Xu, J. B., Zhou, Y., Cen, X., & Zhao, Y. (2023) · European Journal of Medicinal Chemistry · doi:10.1016/j.ejmech.2023.115219 · Cited by 43
Gold(III)-P-chirogenic complex induces mitochondrial dysfunction in triple-negative breast cancer
Olelewe, C., Kim, J. H., Ofori, S., Mertens, R. T., Gukathasan, S., & Awuah, S. G. (2022) · iScience · doi:10.1016/j.isci.2022.104340 · Cited by 40
Autophagy Contributes to Metabolic Reprogramming and Therapeutic Resistance in Pancreatic Tumors
Reyes‐Castellanos, G., Hadi, N. A., & Carrier, A. (2022) · Cells · doi:10.3390/cells11030426 · Cited by 41
Self-citationMetabolic Reprogramming: A Friend or Foe to Cancer Therapy?
McCann, C. K., & Kerr, E. M. (2021) · Cancers · doi:10.3390/cancers13133351 · Cited by 36
He, P., Bian, A., Miao, Y., Jin, W., Chen, H., He, J., Li, L., Sun, Y., Ye, J., Liu, M., et al. (2022) · Journal of Medicinal Chemistry · doi:10.1021/acs.jmedchem.2c01554 · Cited by 34
Cellular metabolism in pancreatic cancer as a tool for prognosis and treatment (Review)
Zuzčák, M., & Trnka, J. (2022) · International Journal of Oncology · doi:10.3892/ijo.2022.5383 · Cited by 33
Dual rectification of metabolism abnormality in pancreatic cancer by a programmed nanomedicine
Wu, B., Wang, Z., Liu, J., Li, N., Wang, X., Bai, H., Wang, C., Shi, J. Y., Zhang, S., Song, J., et al. (2024) · Nature Communications · doi:10.1038/s41467-024-54963-y · Cited by 31
Amrutkar, M., & Gladhaug, I. P. (2021) · Cancers · doi:10.3390/cancers13040601 · Cited by 31
Occult polyclonality of preclinical pancreatic cancer models drives in vitro evolution
Monberg, M. E., Geiger, H., Lee, J. J., Sharma, R., Semaan, A., Bernard, V., Wong, J., Wang, F., Liang, S., Swartzlander, D. B., et al. (2022) · Nature Communications · doi:10.1038/s41467-022-31376-3 · Cited by 30
Metabolic landscapes in sarcomas
MIALLOT, R., Galland, F., Millet, V., Blay, J., & Naquet, P. (2021) · Journal of Hematology & Oncology · doi:10.1186/s13045-021-01125-y · Cited by 29
Lee, D. E., Kang, H. W., Kim, S. Y., Kim, M., Jeong, J. W., Hong, W. C., Fang, S., Kim, H. S., Lee, Y. S., Kim, H. J., et al. (2022) · Frontiers in Pharmacology · doi:10.3389/fphar.2022.934746 · Cited by 29
Sela, Y., Li, J., Maheswaran, S., Norgard, R. J., Yuan, S., Hubbi, M. E., Doepner, M., Xu, J. P., Ho, E. S., Mesaros, C., et al. (2022) · Cancer Research · doi:10.1158/0008-5472.can-22-0431 · Cited by 27
Deng, M., Zhou, Z., Chen, J., Li, X., Liu, Z., Ye, J., Wei, W., Wang, N., Peng, Y., Luo, X., et al. (2024) · Advanced Science · doi:10.1002/advs.202408599 · Cited by 26
Kim, M., Hong, W. C., Kang, H. W., Kim, J. H., Lee, D., Cheong, J., Jung, H., Kwon, W., Jang, J., Kim, H. J., et al. (2025) · Cell Death and Disease · doi:10.1038/s41419-025-07476-5 · Cited by 27
Fujiwara‐Tani, R., Sasaki, T., Takagi, T., Mori, S., Kishi, S., Nishiguchi, Y., Ohmori, H., Fujii, K., & Kuniyasu, H. (2022) · International Journal of Molecular Sciences · doi:10.3390/ijms23147824 · Cited by 26
OXPHOS inhibition overcomes chemoresistance in triple negative breast cancer
Uslu, C., Kapan, E., & Lyakhovich, A. (2025) · Redox Biology · doi:10.1016/j.redox.2025.103637 · Cited by 26
Zheng, J., Wang, Q., Chen, J., Cai, G., Zhang, Z., Zou, H., Zou, J. X., Liu, Q., Ji, S., Shao, G., et al. (2024) · Cell Reports Medicine · doi:10.1016/j.xcrm.2024.101519 · Cited by 25
Metabolic plasticity in pancreatic cancer: The mitochondrial connection
Noemi, G., Abbo, D., Anastasia, B., Costamagna, A., Porporato, P. E., & Martini, M. (2024) · Molecular Metabolism · doi:10.1016/j.molmet.2024.102089 · Cited by 24
Wu, Y., Zeng, H., Yu, Q., Huang, H., Fervers, B., Chen, Z., & Lu, L. (2021) · Cancers · doi:10.3390/cancers13112565 · Cited by 24
Pancreatic cancer tumor organoids exhibit subtype-specific differences in metabolic profiles
Ali, H. A., Karasinska, J. M., Topham, J. T., Johal, D., Kalloger, S. E., Metcalfe, A., Warren, C., Miyagi, A., Tao, L. V., Kevorkova, M., et al. (2024) · Cancer & Metabolism · doi:10.1186/s40170-024-00357-z · Cited by 23
Pan, B., Hsu, C.-C., Wu, H., Chen, Y.-R., Zhou, X., Wang, S., Li, C., & Lin, H.-K. (2025) · Journal of Biomedical Science · doi:10.1186/s12929-025-01167-1 · Cited by 27
Carmona‐Carmona, C. A., Pozza, E. D., Ambrosini, G., Cisterna, B., Palmieri, M., Decimo, I., Cuezva, J. M., Bottani, E., & Dando, I. (2022) · Cancers · doi:10.3390/cancers14143432 · Cited by 23
Hertweck, K. L., Vikramdeo, K. S., Galeas, J. N., Marbut, S. M., Pramanik, P., Yunus, F., Singh, S., Singh, A. P., & Dasgupta, S. (2023) · The FASEB Journal · doi:10.1096/fj.202201724rr · Cited by 25
Metabolic Rewiring and Stemness: A Critical Attribute of Pancreatic Cancer Progression
Ogunleye, A. O., Nimmakayala, R. K., Batra, S. K., & Ponnusamy, M. P. (2023) · Stem Cells · doi:10.1093/stmcls/sxad017 · Cited by 21
Genetics of enzymatic dysfunctions in metabolic disorders and cancer
Mahé, M., Rios-Fuller, T. J., Karolin, A., & Schneider, R. J. (2023) · Frontiers in Oncology · doi:10.3389/fonc.2023.1230934 · Cited by 23
Targeting mitochondrial dysfunctions in pancreatic cancer evokes new therapeutic opportunities
Sarwar, A., Zhu, M., Su, Q., Zhu, Z., Yang, T., Chen, Y., Peng, X., & Zhang, Y. (2022) · Critical Reviews in Oncology/Hematology · doi:10.1016/j.critrevonc.2022.103858 · Cited by 20
Guo, L. (2022) · Journal of Biological Chemistry · doi:10.1016/j.jbc.2022.101858 · Cited by 21
Chen, J., Zheng, Q., Hicks, J. L., Trabzonlu, L., Özbek, B., Jones, T., Vaghasia, A. M., Larman, T., Wang, R., Markowski, M. C., et al. (2023) · JCI Insight · doi:10.1172/jci.insight.169868 · Cited by 18
Zhao, L., Zou, X., Deng, J., Sun, B., Li, Y., Zhao, L., Zhao, H., Zhang, X., Yuan, X., Zhao, X., et al. (2024) · Cell Death and Differentiation · doi:10.1038/s41418-024-01331-4 · Cited by 18
Reyes‐Castellanos, G., Hadi, N. A., Gallardo-Arriaga, S., Masoud, R., Garcia, J., Lac, S., Kaoutari, A. E., Gicquel, T., Planque, M., Fendt, S., et al. (2023) · iScience · doi:10.1016/j.isci.2023.106899 · Cited by 16
Self-citationTargeting Hypoxia: Revival of Old Remedies
Vilaplana‐Lopera, N., Besh, M., & Moon, E. J. (2021) · Biomolecules · doi:10.3390/biom11111604 · Cited by 17
Mutations of the Electron Transport Chain Affect Lifespan and ROS Levels in C. elegans
Ősz, F., Nazir, A., Takács‐Vellai, K., & Farkas, Z. (2025) · Antioxidants · doi:10.3390/antiox14010076 · Cited by 17
Rerouting the drug response: Overcoming metabolic adaptation in KRAS-mutant cancers
Moss, D., McCann, C. K., & Kerr, E. M. (2022) · Science Signaling · doi:10.1126/scisignal.abj3490 · Cited by 16
Dash, S., Ueda, T., Komuro, A., Honda, M., Sugisawa, R., & Okada, H. (2024) · Cell Death and Disease · doi:10.1038/s41419-024-06531-x · Cited by 15
Konaté, M. M., Krushkal, J., Li, M., Chen, L., Kotliarov, Y., Palmisano, A., Pauly, R., Xie, Q., Williams, P. M., McShane, L. M., et al. (2024) · Journal of Translational Medicine · doi:10.1186/s12967-024-05528-6 · Cited by 16
Moro, L. (2021) · International Journal of Molecular Sciences · doi:10.3390/ijms22189692 · Cited by 15
Kalita, B., Martínez-Cebrián, G., McEvoy, J. D., Allensworth, M. L., Knight, M., Magli, A., Perlingeiro, R. C. R., Dyer, M. A., Stewart, E. A., & Dynlacht, B. D. (2024) · Cell · doi:10.1016/j.cell.2025.03.008 · Cited by 14
Zhang, Y., Li, W., Niu, J., Fan, Z., Li, X., & Zhang, H. (2025) · Frontiers in Immunology · doi:10.3389/fimmu.2025.1586959 · Cited by 15
Functional noninvasive detection of glycolytic pancreatic ductal adenocarcinoma
Heid, I., Münch, C., Karakaya, S., Lueong, S., Winkelkotte, A. M., Liffers, S. T., Godfrey, L., Cheung, P. F., Savvatakis, K., Topping, G. J., et al. (2022) · Cancer & Metabolism · doi:10.1186/s40170-022-00298-5 · Cited by 14
Regulation of metabolism in pancreatic ductal adenocarcinoma via nanotechnology-enabled strategies
Wang, Z., Wu, B., Nie, G., Wei, J., & Li, Y. (2023) · Cancer Letters · doi:10.1016/j.canlet.2023.216138 · Cited by 15
Yolba, R. L., Visentin, V., Hervé, C., Chiche, J., Ricci, J., Meneyrol, J., Paillasse, M. R., & Alet, N. (2021) · Pharmacology Research & Perspectives · doi:10.1002/prp2.854 · Cited by 12
Solta, A., Ernhofer, B., Boettiger, K., Lang, C., Megyesfalvi, Z., Mendrina, T., Kirchhofer, D., Timelthaler, G., Szeitz, B., Rezeli, M., et al. (2025) · Cancer & Metabolism · doi:10.1186/s40170-025-00382-6 · Cited by 13
Xu, Y., Xue, D., Kyani, A., Bankhead, A., Roy, J., Ljungman, M. E., & Neamati, N. (2023) · ACS Pharmacology & Translational Science · doi:10.1021/acsptsci.3c00069 · Cited by 15
Tavares‐Valente, D., Cannone, S., Greco, M. R., Carvalho, T. M. A., Baltazar, F., Queirós, O., Agrimi, G., Reshkin, S. J., & Cardone, R. A. (2023) · Cancers · doi:10.3390/cancers15153868 · Cited by 13
Estarás, M., Ortiz-Placín, C., Castillejo-Rufo, A., Fernández‐Bermejo, M., Blanco‐Fernández, G., Mateos, J. M., Vara, D., Gonzalez-Cordero, P. L., Chamizo, S., López-Guerra, D., et al. (2022) · Journal of Physiology and Biochemistry · doi:10.1007/s13105-022-00930-4 · Cited by 13
Self-citationTorresano, L., Santacatterina, F., Domínguez-Zorita, S., Nuevo‐Tapioles, C., Núñez-Salgado, A., Esparza‐Moltó, P. B., González-Llorente, L., Romero-Carramiñana, I., de Arenas, C. N., Sánchez-Garrido, B., et al. (2022) · Oncogenesis · doi:10.1038/s41389-022-00400-y · Cited by 13
The coenzyme A precursor pantethine enhances antitumor immunity in sarcoma
MIALLOT, R., Millet, V., Roger, A., Fenouil, R., Tardivel, C., Martin, J., Tranchida, F., Shintu, L., BERCHARD, P., Lanza, J. S., et al. (2023) · Life Science Alliance · doi:10.26508/lsa.202302200 · Cited by 14
Self-citationYao, X., Yang, H., Guo, S., Liu, Y., Zhang, Q., Zhou, Z., Li, M., & Luo, Z. Y. (2025) · Biomaterials · doi:10.1016/j.biomaterials.2025.123391 · Cited by 12
Dujardin, P., Baginska, A. K., Urban, S., & Grüner, B. M. (2021) · Cancers · doi:10.3390/cancers13164187 · Cited by 12
Ohara, Y., Liu, H., Moreno, P., Suzuki, S., & Hussain, S. P. (2025) · Pharmacology & Therapeutics · doi:10.1016/j.pharmthera.2025.108946 · Cited by 11
Geng, Y., Wang, Z., Xu, X., Sun, X., Dong, X., Luo, Y., & Sun, X. (2023) · Translational research · doi:10.1016/j.trsl.2023.08.001 · Cited by 13
UCP2 and pancreatic cancer: conscious uncoupling for therapeutic effect
Caggiano, E. G., & Taniguchi, C. M. (2024) · Cancer and Metastasis Reviews · doi:10.1007/s10555-023-10157-4 · Cited by 13
Improved pH-Responsive Release of Phenformin from Low-Defect Graphene Compared to Graphene Oxide
Alhourani, A. H., Førde, J.-L., Eichacker, L. A., Herfindal, L., & Hagland, H. R. (2021) · ACS Omega · doi:10.1021/acsomega.1c03283 · Cited by 11
Tumoral acidosis promotes adipose tissue depletion by fostering adipocyte lipolysis
Lefevre, C., Thibaut, M. M., Loumaye, A., Thissen, J., Neyrinck, A. M., Navez, B., Delzenne, N. M., Féron, O., & Bindels, L. B. (2024) · Molecular Metabolism · doi:10.1016/j.molmet.2024.101930 · Cited by 10
Grivennikova, V. G., Gladyshev, G. V., Zharova, T. V., & Borisov, V. B. (2024) · International Journal of Molecular Sciences · doi:10.3390/ijms252413421 · Cited by 11
Label-free spatially maintained measurements of metabolic phenotypes in cells
Hu, L., Wang, N., Bryant, J. D., Liu, L., Xie, L., West, A. P., & Walsh, A. J. (2023) · Frontiers in Bioengineering and Biotechnology · doi:10.3389/fbioe.2023.1293268 · Cited by 10
HDGF stimulates liver tumorigenesis by enhancing reactive oxygen species generation in mitochondria
Hu, T., Wu, J., Huang, S., Chu, T., Han, A., Shih, T.-W., Chang, Y., Yang, S., Ko, C., Lin, Y., et al. (2023) · Journal of Biological Chemistry · doi:10.1016/j.jbc.2023.105335 · Cited by 9
Tailoring metabolic activity assays for tumour-engineered 3D models
Clegg, J., Curvello, R., Gabrielyan, A., Croagh, D. G., Hauser, S., & Loessner, D. (2024) · Biomaterials Advances · doi:10.1016/j.bioadv.2024.214116 · Cited by 9
Poles, M., Pacchiana, R., Mortali, C., Cisterna, B., Mullappilly, N., Celesia, A., Danzi, F., Gaspari, M., Cecconi, D., Donadelli, M., et al. (2025) · FEBS Journal · doi:10.1111/febs.70223 · Cited by 9
Mechanisms of Cancer Cell Death: Therapeutic Implications for Pancreatic Ductal Adenocarcinoma
Pook, H., & Pauklin, S. (2021) · Cancers · doi:10.3390/cancers13194834 · Cited by 10
Fu, J., Liu, S., Hu, M., Liao, X., Wang, X., Xu, Z., Li, Q., & Quan, J. (2022) · ChemMedChem · doi:10.1002/cmdc.202100674 · Cited by 9
Siragusa, G., Brandi, J., Rawling, T., Murray, M. T., & Cecconi, D. (2024) · International Journal of Molecular Sciences · doi:10.3390/ijms25126790 · Cited by 8
Francès, A., Lumeau, A., Béry, N., Gayral, M., Stuani, L., Sorbara, M., Saland, E., Pagan, D., Hanoun, N., Torrisani, J., et al. (2024) · Communications Biology · doi:10.1038/s42003-024-06760-y · Cited by 8
Self-citationGicquel, T., Marchianò, F., Reyes‐Castellanos, G., Audebert, S., Camoin, L., Habermann, B. H., Giannesini, B., & Carrier, A. (2024) · eLife · doi:10.7554/elife.93312.2 · Cited by 24
Self-citationWang, L., Li, J., Zheng, Y., Li, Y., Zhu, Q., Cao, J., & Sun, L. (2025) · Chemical Engineering Journal · doi:10.1016/j.cej.2025.160180 · Cited by 8
Anania, S., Farnir, M., Peiffer, R., Boumahd, Y., Thiry, M., Agirman, F., Maloujahmoum, N., Bellahcène, A., & Peulen, O. (2024) · Cell Communication and Signaling · doi:10.1186/s12964-024-01514-z · Cited by 8
Blázquez‐Encinas, R., Alors‐Pérez, E., Moreno-Montilla, M. T., García‐Vioque, V., Sánchez‐Frías, M., Mafficini, A., Lopez-Canovas, J. L., Bousquet, C., Gahete, M. D., Lawlor, R. T., et al. (2024) · Cancer Gene Therapy · doi:10.1038/s41417-024-00814-3 · Cited by 8
Murugan, S., Srikanth Swamy Swaroop, B., Gopinath, P., Saravanan, R., Sundaram, S., Shanmugasundaram, G., Venkatraman, G., & Rayala, S. K. (2025) · Journal of Biological Chemistry · doi:10.1016/j.jbc.2025.108409 · Cited by 7
The role and therapeutic potential of glucose metabolism in multidrug resistance of cancer
Wang, Q., Li, K., Li, L., Qin, L., Qi, Y., Liu, K., Yuan, H., & Lin, P. (2025) · Frontiers in Cell and Developmental Biology · doi:10.3389/fcell.2025.1584630 · Cited by 8
Wang, R., Gao, C., Fan, Z., Qin, Q., & Zhan, H. (2025) · Cancer Letters · doi:10.1016/j.canlet.2025.217965 · Cited by 7
Jiang, B., Wu, S., Zeng, L., Tang, Y., Luo, L., Ouyang, L., Feng, W., Tan, Y., & Li, Y. (2024) · Cancer Cell International · doi:10.1186/s12935-024-03244-1 · Cited by 7
Oncometabolites in pancreatic cancer: Strategies and its implications
Maiti, A., Mondal, S., Choudhury, S., Bandopadhyay, A., Mukherjee, S., & Sikdar, N. (2024) · World Journal of Experimental Medicine · doi:10.5493/wjem.v14.i4.96005 · Cited by 7
Islam, R., Roche, M. E., Lin, Z., Whitaker‐Menezes, D., Diaz‐Barros, V., Serrano, E., Cantarin, M. P. M., Philp, N. J., Mallick, A. B., & Martinez‐Outschoorn, U. (2025) · Molecular Oncology · doi:10.1002/1878-0261.70002 · Cited by 6
Baumgartner, V., Schaer, D., Eberli, D., & Salemi, S. (2023) · Cancers · doi:10.3390/cancers15235612 · Cited by 6
Zhou, S., Ze, X., Feng, D., Liu, L., Shi, Y., Yu, M., Huang, L., Wang, Y., Men, H., Wu, J., et al. (2024) · Journal of Medicinal Chemistry · doi:10.1021/acs.jmedchem.4c01178 · Cited by 6
Progress in antitumor mechanisms and applications of phenformin (Review)
Zhong, Q., Li, D., & Yang, X. (2024) · Oncology Reports · doi:10.3892/or.2024.8810 · Cited by 6
Nuclear TOP1MT Confers Cisplatin Resistance via Pseudogene in HNSCC
Tong, T., Zhai, P., Qin, X., Zhang, Z., Li, C., Guo, H., & L., H. (2024) · Journal of Dental Research · doi:10.1177/00220345241272017 · Cited by 6
Alodhaibi, I., Ailawadhi, S., Búrbano, G., O’Brien, P., Buadi, F. K., Hayman, S. R., Kumar, S. K., & Gonsalves, W. I. (2024) · Clinical Lymphoma Myeloma & Leukemia · doi:10.1016/j.clml.2024.01.002 · Cited by 6
Occult polyclonality of preclinical pancreatic cancer models drives in vitro evolution
Monberg, M. E., Geiger, H. M., Lee, J. J., Sharma, R., Semaan, A., Bernard, V., Wong, J., Wang, F., Liang, S., Swartzlander, D. B., et al. (2022) · RePEc: Research Papers in Economics · Cited by 6
Sapio, L., Ragone, A., Spina, A., Salzillo, A., & Naviglio, S. (2022) · Cancer Drug Resistance · doi:10.20517/cdr.2022.34 · Cited by 6
Guerrero‐López, P., Drobac, G., Silva, E. A., Hagland, H. R., & García‐Aznar, J. M. (2025) · Cancer & Metabolism · doi:10.1186/s40170-025-00413-2 · Cited by 5
Hadi, N. A., Reyes‐Castellanos, G., Gicquel, T., Gallardo-Arriaga, S., Cosialls, E., Boët, E., Sarry, J., Masoud, R., Iovanna, J., & Carrier, A. (2025) · Oncogenesis · doi:10.1038/s41389-025-00591-0 · Cited by 5
Self-citationMechanisms of Anti-PD Therapy Resistance in Digestive System Neoplasms
Wu, Y., Jiang, X., Yu, Z., Xing, Z., Ma, Y., & Qing, H. (2024) · Recent Patents on Anti-Cancer Drug Discovery · doi:10.2174/0115748928269276231120103256 · Cited by 5
Metadata
- Authors
- Masoud, R., Reyes-Castellanos, G., Lac, S., Garcia, J., Dou, S., Shintu, L., Abdel Hadi, N., Gicquel, T., El Kaoutari, A., Diémé, B., Tranchida, F., Cormareche, L., Borge, L., Gayet, O., Pasquier, E., Dusetti, N., Iovanna, J., & Carrier, A.
- Affiliations
- Centre National de la Recherche Scientifique (FR)
- Corresponding author
- Masoud, Rawand
- Carrier, Alice
- ORCID
- Venue
- Cell Reports Medicine
- Publisher
- Elsevier BV
- Published
- 2020-11
- Volume
- 1
- Issue
- 8
- Pages
- 100143
- ISSN
- 2666-3791 (ISSN-L)
- PMC
- PMC7691450
- OpenAlex
- W3101012847
- Cited by
- 175
- References
- 47
- Citations by year
- 2026: 14 · 2025: 35 · 2024: 49 · 2023: 27 · 2022: 27 · 2021: 23
- FWCI
- 6.93
- Type
- journal article
- Language
- en
- Open access
- gold
- doi.org
- Licence
- Locations
- Cell Reports Medicine (publishedVersion, cc-by-nc-nd)
- PubMed Central (publishedVersion, cc-by-nc-nd)
- PubMed (publishedVersion)
- HAL AMU (submittedVersion, cc-by-nc-nd)
- Funders
- Institut National de la Santé et de la Recherche Médicale
- Centre National de la Recherche Scientifique
- Institut National Du Cancer
- Fondation ARC pour la Recherche sur le Cancer (PJA 20151203544)
- La Ligue Nationale contre le Cancer
- DGOS
- Fondation Amidex
- Fondation de France
- Canceropôle Provence-Alpes-Côte d’Azur
- Fédération GEFLUC
- Fondation pour la Recherche Médicale
- CONACYT (339091/471717)
- IMODI
- Association Azm et Saadé
- Agence Nationale de la Recherche
- Canceropôle PACA
- Topics
- Life Sciences › Biochemistry, Genetics and Molecular Biology › Cancer Research › Cancer, Hypoxia, and Metabolism
- Life Sciences › Biochemistry, Genetics and Molecular Biology › Molecular Biology › Metabolism, Diabetes, and Cancer
- Health Sciences › Medicine › Oncology › Pancreatic and Hepatic Oncology Research
- Keywords
- pancreatic ductal adenocarcinoma, mitochondrial complex I, oxidative phosphorylation, chemoresistance, phenformin, gemcitabine, combination chemotherapy, tumor metabolic heterogeneity, mitochondrial respiration, synergistic drug combination, patient stratification
- MeSH terms
- PC-3 Cells, Gemcitabine, Animals, Deoxycytidine, Female, Humans, Male, Mice, Inbred C57BL, Mice, Nude, Mitochondria, Oxidative Phosphorylation, Pancreatic Neoplasms, Phenformin, Drug Resistance, Neoplasm, Cell Respiration, Carcinoma, Pancreatic Ductal, Xenograft Model Antitumor Assays, Electron Transport Complex I, Cell Line, Tumor, Cell Proliferation, Mice
About these checks
Registry, retraction, Cites and statistics results are computed, not judged, with one exception: a printed reference that no index lists is read once by a model before it counts as a citation error. Claims are extracted by a model and kept only when their quote appears verbatim in the text; each cited source is then checked, with a model’s help, for whether it says what the claim relies on. Those verdicts can be wrong — read the claim’s quote and the cited source before relying on one.
Statistics and arithmetic are recomputed, not judged.
Confidence bands are shown only for fields calibrated on our annotated test set. None is calibrated yet, so no band is shown.
What counts as a claim ›How we measure confidence ›How we check this ›
Are you an author, or do you see a problem with this page? Request a review
