

The DOI matches its Crossref record; 67 of the 68 references it cites were found in a registry or an index.
Improved Efficacy in a Fabry Disease Model Using a Systemic mRNA Liver Depot System as Compared to Enzyme Replacement Therapy
Open accessAbstract
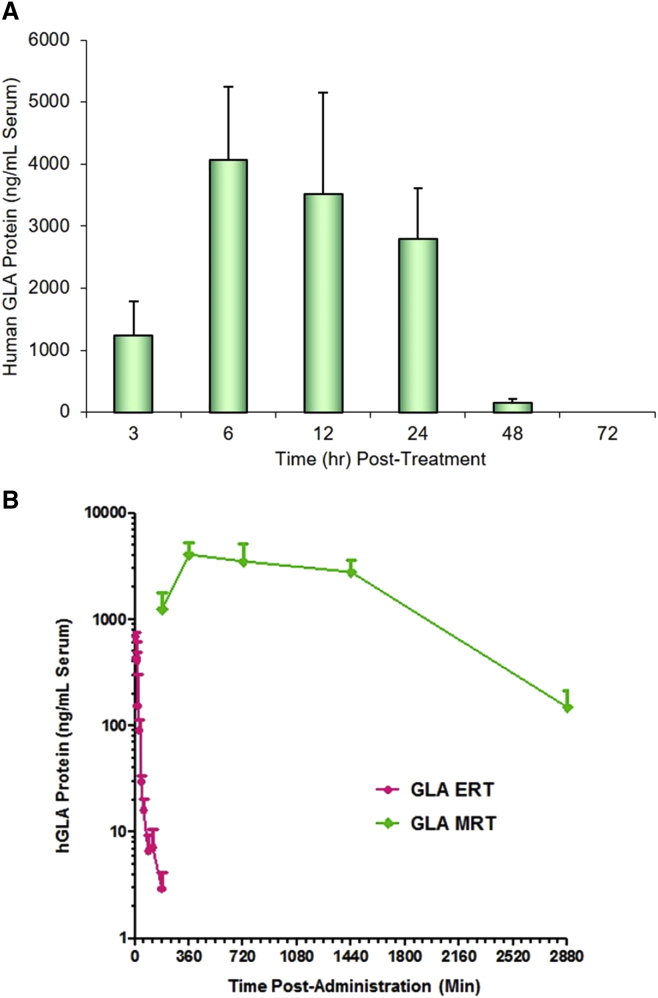
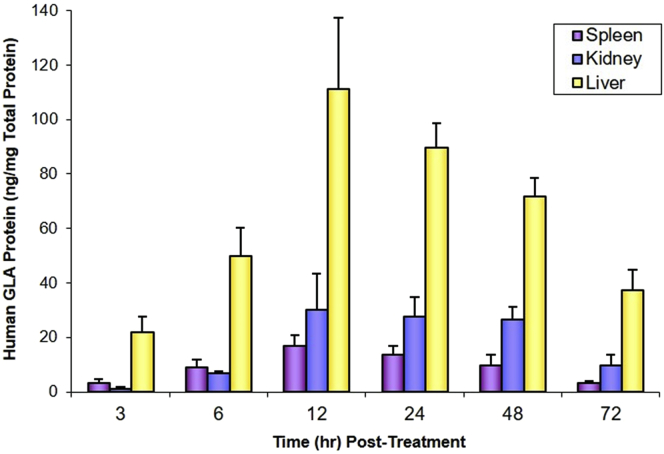
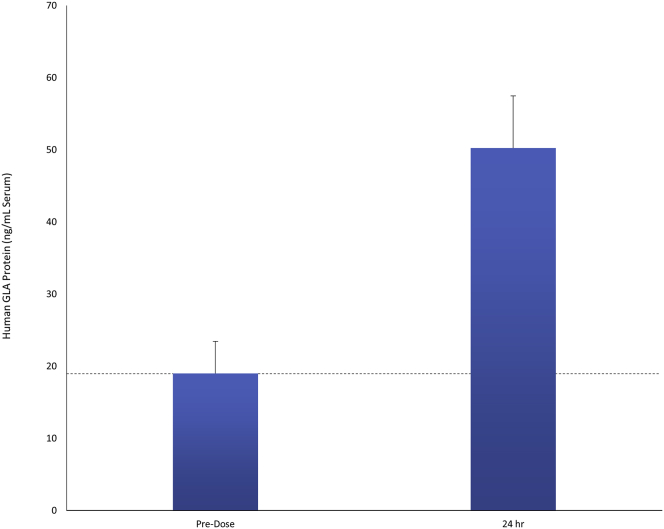
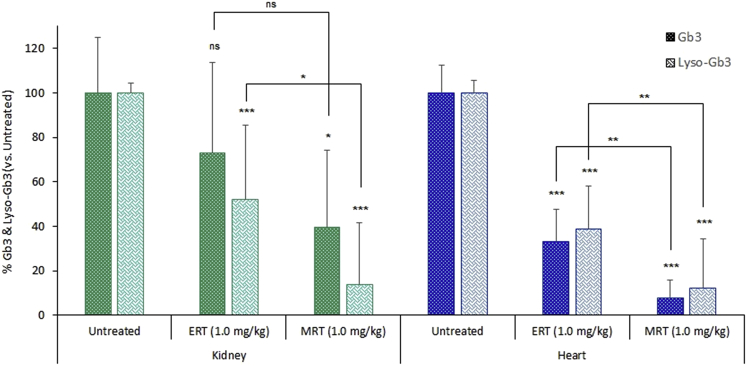
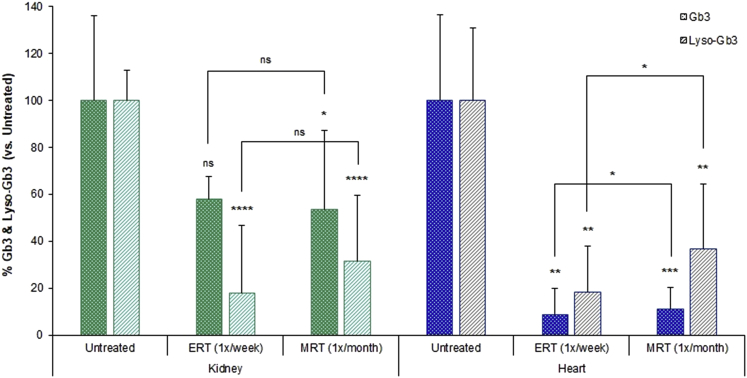
Fabry disease is a lysosomal storage disorder caused by the deficiency of α-galactosidase A. Enzyme deficiency results in a progressive decline in renal and cardiac function, leading to cardiomyopathy and end-stage renal disease. Current treatments available, including enzyme replacement therapies, have provided significant benefit to patients; however, unmet medical needs remain. mRNA therapy, with drug-like properties, has the unique ability to produce therapeutic proteins endogenously. Here we describe the sustained delivery of therapeutic human α-galactosidase protein in vivo via nanoparticle-formulated mRNA in mouse and non-human primate, with a demonstration of efficacy through clinically relevant biomarker reduction in a mouse Fabry disease model. Multi-component nanoparticles formulated with lipids and lipid-like materials were developed for the delivery of mRNA encoding human α-galactosidase protein. Upon delivery of human GLA mRNA to mice, serum GLA protein levels reached as high as ∼1,330-fold over normal physiological values.
Overview
The claims and statistics of this paper haven’t been checked yet.
Run the check — free, no account needed. It reads the open-access text and checks the sources it cites.
Integrity signals
Registry
Cites
Statistics
Figures
Verification
Claims the paper makes
The claims and statistics of this paper haven’t been checked yet.
Run the check — free, no account needed. It reads the open-access text and checks the sources it cites.
Claims other papers make about this one
Each is checked against this paper’s own text: does it say what the citing paper says it does?
In the citing paper
“The therapeutic potential of mRNA-based protein replacement therapies has also been tested in other metabolic disorders in preclinical studies, including hereditary tyrosinaemia type I (HTI)142, acute intermittent porphyria222,223, Fabry disease224,225, Crigler–Najjar syndrome type 1 (ref.226), α1 antitrypsin deficiency227, methylmalonic acidaemia/aciduria228, arginase deficiency229, citrin defic”
From Lipid nanoparticles for mRNA delivery (2021) · cites this paper as [225]
Self-check
Percentages, sums and reported differences re-computed from the paper’s own numbers.
The self-check needs the paper’s full text.
Citations
Cites
Targeted delivery of RNAi therapeutics with endogenous and exogenous ligand-based mechanisms
Akinc, A., Querbes, W., De, S., Qin, J., Frank-Kamenetsky, M., Jayaprakash, K. N., Jayaraman, M., Rajeev, K. G., Cantley, W. L., Dorkin, J. R., et al. (2010) · Molecular Therapy · doi:10.1038/mt.2010.85 · Cited by 1,261
The Many Pathways of RNA Degradation
Houseley, J. M., & Tollervey, D. W. (2009) · Cell · doi:10.1016/j.cell.2009.01.019 · Cited by 1,220
Pardi, N., Tuyishime, S., Muramatsu, H., Kariko, K., Mui, B. L., Tam, Y. K., Madden, T. D., Hope, M. J., & Weissman, D. (2015) · Journal of Controlled Release · doi:10.1016/j.jconrel.2015.08.007 · Cited by 1,014
Lipid-like materials for low-dose, in vivo gene silencing
Love, K. T., Mahon, K. P., Levins, C. G., Whitehead, K. A., Querbes, W., Dorkin, J. R., Qin, J., Cantley, W., Qin, L. L., Racie, T., et al. (2010) · Proceedings of the National Academy of Sciences · doi:10.1073/pnas.0910603106 · Cited by 969
Kauffman, K. J., Dorkin, J. R., Yang, J. H., Heartlein, M. W., DeRosa, F., Mir, F. F., Fenton, O. S., & Anderson, D. G. (2015) · Nano Letters · doi:10.1021/acs.nanolett.5b02497 · Cited by 796
Self-citationExpression of therapeutic proteins after delivery of chemically modified mRNA in mice
Kormann, M. S. D., Hasenpusch, G., Aneja, M. K., Nica, G., Flemmer, A. W., Herber-Jonat, S., Huppmann, M., Mays, L. E., Illenyi, M., Schams, A., et al. (2011) · Nature Biotechnology · doi:10.1038/nbt.1733 · Cited by 733
Zangi, L., Lui, K. O., von Gise, A., Ma, Q., Ebina, W., Ptaszek, L. M., Später, D., Xu, H., Tabebordbar, M., Gorbatov, R., et al. (2013) · Nature Biotechnology · doi:10.1038/nbt.2682 · Cited by 646
Stability of Endogenous and Added RNA in Blood Specimens, Serum, and Plasma
Tsui, N. B. Y., Ng, E. K. O., & Lo, Y. D. (2002) · Clinical Chemistry · doi:10.1093/clinchem/48.10.1647 · Cited by 628
Intracellular targeting delivery of liposomal drugs to solid tumors based on EPR effects
Maruyama, K. (2010) · Advanced Drug Delivery Reviews · doi:10.1016/j.addr.2010.09.003 · Cited by 609
Treatment of Fabry’s Disease with the Pharmacologic Chaperone Migalastat
Germain, D. P., Hughes, D. A., Nicholls, K., Bichet, D. G., Giugliani, R., Wilcox, W. R., Feliciani, C., Shankar, S. P., Ezgü, F. S., Amartino, H. M., et al. (2016) · New England Journal of Medicine · doi:10.1056/nejmoa1510198 · Cited by 576
Cited by
Sorted by citations
Lipid nanoparticles for mRNA delivery
Hou, X., Zaks, T., Langer, R., & Dong, Y. (2021) · Nature Reviews Materials · doi:10.1038/s41578-021-00358-0 · Cited by 4,076
mRNA-based therapeutics: powerful and versatile tools to combat diseases
Qin, S., Tang, X., Chen, Y., Chen, K., Fan, N., Xiao, W., Zheng, Q., Li, G., Teng, Y., Wu, M., et al. (2022) · Signal Transduction and Targeted Therapy · doi:10.1038/s41392-022-01007-w · Cited by 852
Lipids and Lipid Derivatives for RNA Delivery
Zhang, Y., Sun, C., Wang, C., Jankovic, K. E., & Dong, Y. (2021) · Chemical Reviews · doi:10.1021/acs.chemrev.1c00244 · Cited by 649
Lipid nanoparticles for nucleic acid delivery: Current perspectives
Samaridou, E., Heyes, J. A., & Lutwyche, P. (2020) · Advanced Drug Delivery Reviews · doi:10.1016/j.addr.2020.06.002 · Cited by 609
Nanomaterial Delivery Systems for mRNA Vaccines
Buschmann, M. D., Carrasco, M. J., Alishetty, S., Paige, M., Alameh, M. G., & Weissman, D. (2021) · Vaccines · doi:10.3390/vaccines9010065 · Cited by 582
Metadata
- Authors
- DeRosa, F., Smith, L., Shen, Y., Huang, Y., Pan, J., Xie, H., Yahalom, B., & Heartlein, M. W.
- Affiliations
- Translate Bio (United States) (US)
- Shire (United States) (US)
- Corresponding author
- Heartlein, Michael W.
- Venue
- Molecular Therapy
- Publisher
- Elsevier BV
- Published
- 2019-04
- Volume
- 27
- Issue
- 4
- Pages
- 878-889
- ISSN
- 1525-0016 (ISSN-L)
- PMC
- PMC6453518
- OpenAlex
- W2922121037
- Cited by
- 111
- References
- 68
- Citations by year
- 2026: 7 · 2025: 14 · 2024: 18 · 2023: 21 · 2022: 19 · 2021: 14 · 2020: 13 · 2019: 5
- FWCI
- 8.74
- Type
- journal article
- Language
- en
- Open access
- hybrid
- doi.org
- Licence
- Locations
- Molecular Therapy (publishedVersion, cc-by-nc-nd)
- PubMed Central (publishedVersion, cc-by-nc-nd)
- PubMed (publishedVersion)
- Funders
- Shire
- Topics
- Health Sciences › Medicine › Genetics (clinical) › Lysosomal Storage Disorders Research
- Life Sciences › Biochemistry, Genetics and Molecular Biology › Molecular Biology › RNA Interference and Gene Delivery
- Physical Sciences › Materials Science › Biomaterials › Nanoparticle-Based Drug Delivery
- Keywords
- Fabry disease, alpha-galactosidase A, mRNA therapeutics, sustained protein delivery, enzyme replacement therapy, lysosomal storage disease, nonhuman primate model
- MeSH terms
- alpha-Galactosidase, Fabry Disease, Animals, Callithrix, Disease Models, Animal, Drug Compounding, Female, Humans, Kidney, Lipids, Liver, Male, RNA, Messenger, Drug Delivery Systems, Treatment Outcome, Mice, Knockout, Mice, Nanoparticles, Gene Knockout Techniques, Enzyme Replacement Therapy
About these checks
Registry, retraction, Cites and statistics results are computed, not judged, with one exception: a printed reference that no index lists is read once by a model before it counts as a citation error. Claims are extracted by a model and kept only when their quote appears verbatim in the text; each cited source is then checked, with a model’s help, for whether it says what the claim relies on. Those verdicts can be wrong — read the claim’s quote and the cited source before relying on one.
Statistics and arithmetic are recomputed, not judged.
Confidence bands are shown only for fields calibrated on our annotated test set. None is calibrated yet, so no band is shown.
What counts as a claim ›How we measure confidence ›How we check this ›
Are you an author, or do you see a problem with this page? Request a review
