Cited by 247Extracellular vesicles in diseaseTraumatic Brain Injury and Neurovascular DisturbancesNeuroinflammation and Neurodegeneration Mechanisms

The DOI matches its Crossref record; 67 of the 67 references it cites were found in a registry or an index.

Increased Microglial Exosomal miR-124-3p Alleviates Neurodegeneration and Improves Cognitive Outcome after rmTBI

Open access

Abstract

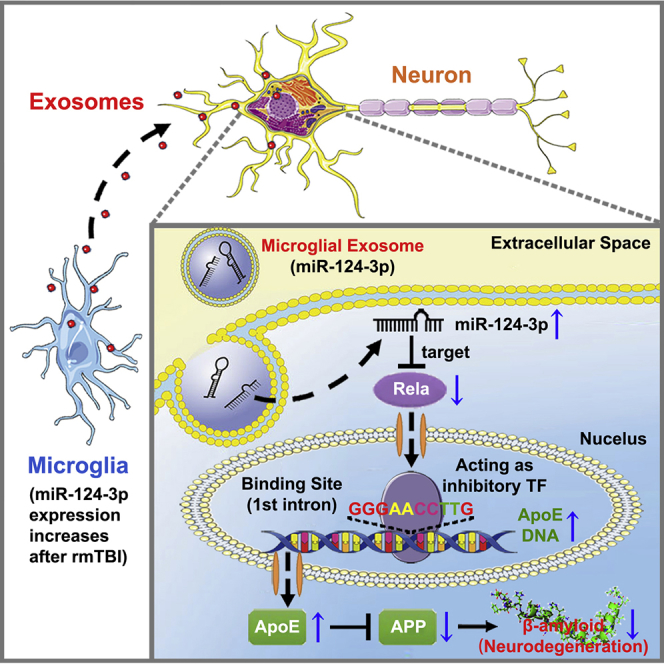
Repetitive mild traumatic brain injury (rmTBI) is considered to be an important risk factor for long-term neurodegenerative disorders such as Alzheimer's disease, which is characterized by β-amyloid abnormalities and impaired cognitive function. Microglial exosomes have been reported to be involved in the transportation, distribution, and clearance of β-amyloid in Alzheimer's disease. However, their impacts on the development of neurodegeneration after rmTBI are not yet known. The role of miRNAs in microglial exosomes on regulating post-traumatic neurodegeneration was investigated in the present study. We demonstrated that miR-124-3p level in microglial exosomes from injured brain was significantly altered in the acute, sub-acute, and chronic phases after rmTBI. In in vitro experiments, microglial exosomes with upregulated miR-124-3p (EXO-124) alleviated neurodegeneration in repetitive scratch-injured neurons. The effects were exerted by miR-124-3p targeting Rela, an inhibitory transcription factor of ApoE that promotes the β-amyloid proteolytic breakdown, thereby inhibiting β-amyloid abnormalities. In mice with rmTBI, the intravenously injected microglial exosomes were taken up by neurons in injured brain. Besides, miR-124-3p in the exosomes was transferred into hippocampal neurons and alleviated neurodegeneration by targeting the Rela/ApoE signaling pathway. Consequently, EXO-124 treatments improved the cognitive outcome after rmTBI, suggesting a promising therapeutic strategy for future clinical translation.

Overview

The claims and statistics of this paper haven’t been checked yet.

Run the check — free, no account needed. It reads the open-access text and checks the sources it cites.

A few free checks a day · papers already verified open instantly · results are public

Integrity signals

Registry

Crossref · 10.1016/j.ymthe.2019.11.017

Cites

67 of 67 references verified0 citation errors · 0 not checkable

Statistics

Figures

Graphical abstract
Graphical abstract CC BY · PubMed Central
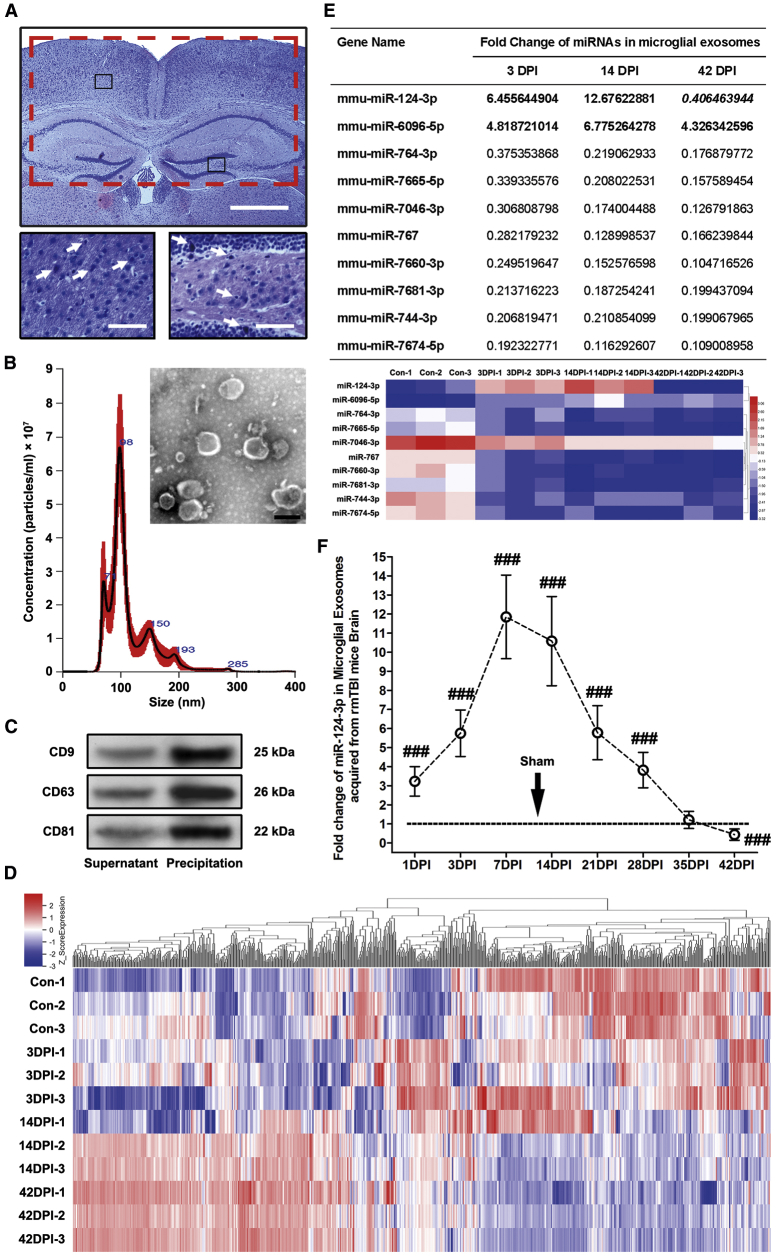
Figure 1 miRNA Microarray Analysis and qRT-PCR Validation for Microglial Exosomes Acquired from Mouse Brains of Different Time Points after rmTBI (A) Representative H&E staining of rmTBI mouse brains at 1 day post-injury (DPI). Note that the rmTBI model did not induce macroscopic brain damage and brain edema. However, the eosinophil neurons (marked by white arrows in the high-magnification images from the black boxes) that indicate neuronal inflammation could be observed in injured brain, suggesting that the mild brain injury was successfully established. The red box indicates the location of the acquired sample from injured brain, including bilateral cerebral cortex and hippocampus. Scale bars: 500 μm (low magnification) and 100 μm (high magnification). (B) Microglial exosome identification using transmission electron microscopy scanning and nanoparticle tracking analysis. Scale bar: 100 nm. (C) Immunoblotting of exosomal biomarkers, including CD9, CD63, and CD81. (D) Heatmap of the Agilent miRNA microarray that detected the miRNA levels in microglial exosomes after rmTBI. The miRNA microarray contains 1,902 probes for mature miRNA. n = 3 per group. (E) Fold change and heatmap of miRNAs with a level change of more than 2-fold (up- or downregulated) and a p value of less than 0.05 at 3 DPI (acute phase), 14 DPI (sub-acute phase), and 42 DPI (chronic phase) after rmTBI detected by miRNA microarray. miR-124-3p is the only miRNA that upregulated at 3 and 14 DPI and downregulated (reversely expressed) at 42 DPI. Its expression changes after rmTBI are also particularly evident among all miRNAs in microglial exosomes. n = 3 per group. (F) Time profiling of miR-124-3p levels in microglial exosomes after rmTBI determined by qRT-PCR. n = 6 per group. The data are presented as mean ± SD. ###p < 0.001 versus the sham group.
Figure 1 miRNA Microarray Analysis and qRT-PCR Validation for Microglial Exosomes Acquired from Mouse Brains of Different Time Points after rmTBI (A) Representative H&E staining of rmTBI mouse brains at 1 day post-injury (DPI). Note that the rmTBI model did not induce macroscopic brain damage and brain edema. However, the eosinophil neurons (marked by white arrows in the high-magnification images from the black boxes) that indicate neuronal inflammation could be observed in injured brain, suggesting that the mild brain injury was successfully established. The red box indicates the location of the acquired sample from injured brain, including bilateral cerebral cortex and hippocampus. Scale bars: 500 μm (low magnification) and 100 μm (high magnification). (B) Microglial exosome identification using transmission electron microscopy scanning and nanoparticle tracking analysis. Scale bar: 100 nm. (C) Immunoblotting of exosomal biomarkers, including CD9, CD63, and CD81. (D) Heatmap of the Agilent miRNA microarray that detected the miRNA levels in microglial exosomes after rmTBI. The miRNA microarray contains 1,902 probes for mature miRNA. n = 3 per group. (E) Fold change and heatmap of miRNAs with a level change of more than 2-fold (up- or downregulated) and a p value of less than 0.05 at 3 DPI (acute phase), 14 DPI (sub-acute phase), and 42 DPI (chronic phase) after rmTBI detected by miRNA microarray. miR-124-3p is the only miRNA that upregulated at 3 and 14 DPI and downregulated (reversely expressed) at 42 DPI. Its expression changes after rmTBI are also particularly evident among all miRNAs in microglial exosomes. n = 3 per group. (F) Time profiling of miR-124-3p levels in microglial exosomes after rmTBI determined by qRT-PCR. n = 6 per group. The data are presented as mean ± SD. ###p < 0.001 versus the sham group.CC BY · PubMed Central
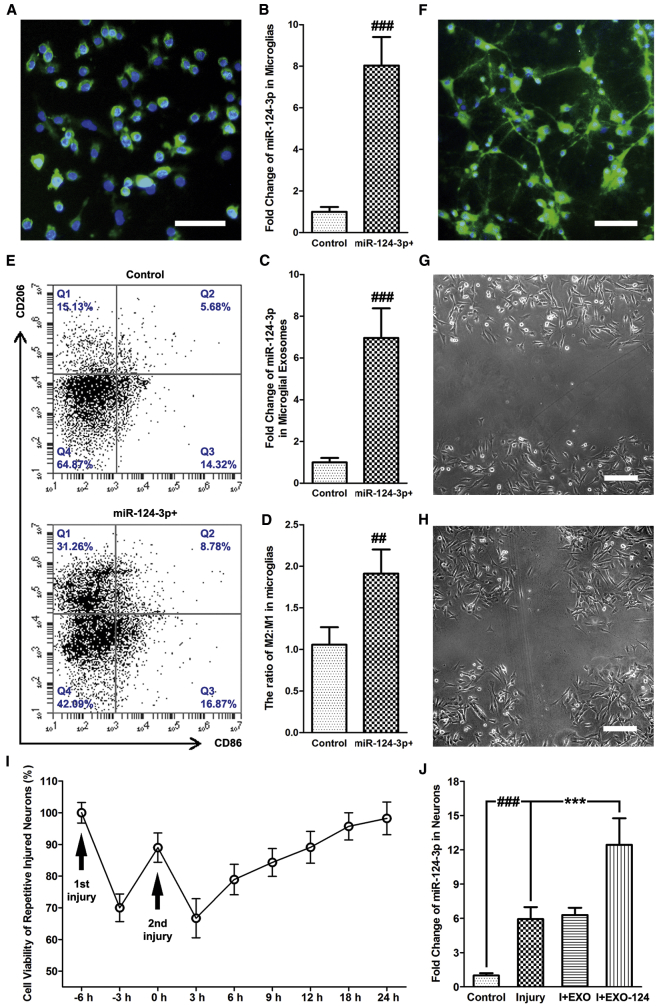
Figure 2 Upregulated miR-124-3p in Microglia Promotes M2 Polarization In Vitro, and EXO-124 Treatment Increases miR-124-3p Level in Neurons after Repetitive Scratch Injury (A) Immunofluorescence staining of Iba-1 for identifying cultured microglia. Scale bar: 100 μm. (B and C) The altered miR-124-3p level in (B) microglia and (C) their exosomes after miR-124-3p mimic transfection. (D) Quantitative data for microglia/macrophage subsets in cultured microglia after miR-124-3p mimic transfection. (E) Representative dot spot of flow cytometry for microglia/macrophage subsets in cultured microglia after miR-124-3p mimic transfection. CD206 and CD86 are the selected biomarkers of M2 and M1 microglia, respectively. (F) Immunofluorescence staining of MAP-2 for identifying cultured neurons. Scale bar: 100 μm. (G and H) Cultured neurons after (G) first scratch and (H) second scratch under transmission light microscope. Scale bars: 50 μm. (I) Cell viability of repetitive scratch-injured neurons. (J) The altered miR-124-3p level in neurons after injury and EXO-124 treatment. n = 6 per group. The data are presented as mean ± SD. ***p < 0.001 versus the I+EXO-124 group. ##p < 0.01 and ###p < 0.001 versus the control group.
Figure 2 Upregulated miR-124-3p in Microglia Promotes M2 Polarization In Vitro, and EXO-124 Treatment Increases miR-124-3p Level in Neurons after Repetitive Scratch Injury (A) Immunofluorescence staining of Iba-1 for identifying cultured microglia. Scale bar: 100 μm. (B and C) The altered miR-124-3p level in (B) microglia and (C) their exosomes after miR-124-3p mimic transfection. (D) Quantitative data for microglia/macrophage subsets in cultured microglia after miR-124-3p mimic transfection. (E) Representative dot spot of flow cytometry for microglia/macrophage subsets in cultured microglia after miR-124-3p mimic transfection. CD206 and CD86 are the selected biomarkers of M2 and M1 microglia, respectively. (F) Immunofluorescence staining of MAP-2 for identifying cultured neurons. Scale bar: 100 μm. (G and H) Cultured neurons after (G) first scratch and (H) second scratch under transmission light microscope. Scale bars: 50 μm. (I) Cell viability of repetitive scratch-injured neurons. (J) The altered miR-124-3p level in neurons after injury and EXO-124 treatment. n = 6 per group. The data are presented as mean ± SD. ***p < 0.001 versus the I+EXO-124 group. ##p < 0.01 and ###p < 0.001 versus the control group.CC BY · PubMed Central
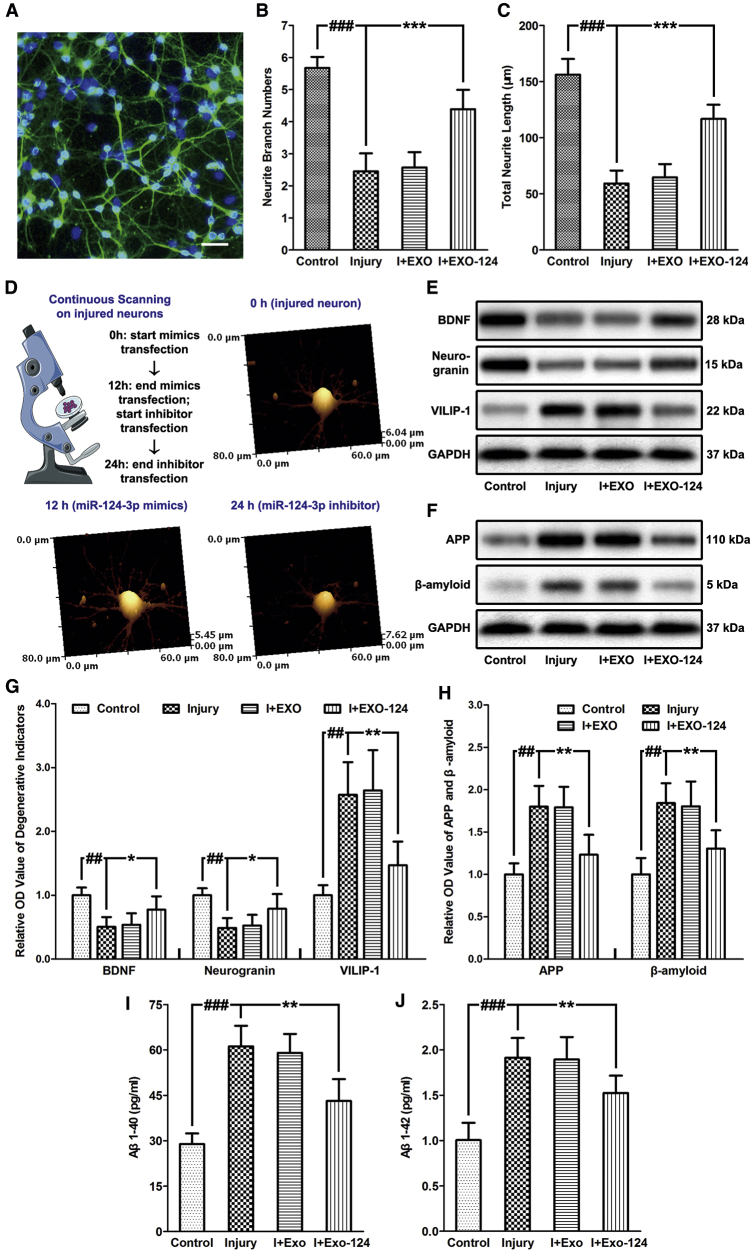
Figure 3 Microglial Exosomal miR-124-3p Alleviates Neurodegeneration in Repetitive Injured Neurons (A) Representative image of neurite branches detected by immunofluorescence staining of neuronal-specific beta III-tubulin. Scale bar: 100 μm. (B) The neurite branch numbers after repetitive cell injury and exosome treatment. (C) Total neurite length after repetitive cell injury and exosome treatment. (D) The schematic representation and the major findings of the HPICM topological continuous scanning in injured neurons. The neurite branch numbers and total neurite length of neurons could be restored by transfection with miR-124-3p mimics for 12 h but decreased after transfection with miR-124-3p inhibitor for another 12 h. (E) Immunoblotting of neuroprotective factors and neurodegenerative indicators, including BDNF, neurogranin, and VILIP-1 in neurons after injury and exosome treatment. (F) Immunoblotting of APP and Aβ in neurons after injury and exosome treatment. (G) Quantitative data of neuroprotective factors and neurodegenerative indicators, including BDNF, neurogranin, and VILIP-1 in neurons after injury and exosome treatment. (H) Quantitative data of APP and Aβ in neurons after injury and exosome treatment. (I and J) The expression levels of soluble (I) Aβ1–40 and (J) Aβ1–42 in neuronal culture medium. n = 6 per group. The data are presented as mean ± SD. **p < 0.01 and ***p < 0.001 versus the I+EXO-124 group. ##p < 0.01 and ###p < 0.001 versus the control group.
Figure 3 Microglial Exosomal miR-124-3p Alleviates Neurodegeneration in Repetitive Injured Neurons (A) Representative image of neurite branches detected by immunofluorescence staining of neuronal-specific beta III-tubulin. Scale bar: 100 μm. (B) The neurite branch numbers after repetitive cell injury and exosome treatment. (C) Total neurite length after repetitive cell injury and exosome treatment. (D) The schematic representation and the major findings of the HPICM topological continuous scanning in injured neurons. The neurite branch numbers and total neurite length of neurons could be restored by transfection with miR-124-3p mimics for 12 h but decreased after transfection with miR-124-3p inhibitor for another 12 h. (E) Immunoblotting of neuroprotective factors and neurodegenerative indicators, including BDNF, neurogranin, and VILIP-1 in neurons after injury and exosome treatment. (F) Immunoblotting of APP and Aβ in neurons after injury and exosome treatment. (G) Quantitative data of neuroprotective factors and neurodegenerative indicators, including BDNF, neurogranin, and VILIP-1 in neurons after injury and exosome treatment. (H) Quantitative data of APP and Aβ in neurons after injury and exosome treatment. (I and J) The expression levels of soluble (I) Aβ1–40 and (J) Aβ1–42 in neuronal culture medium. n = 6 per group. The data are presented as mean ± SD. **p < 0.01 and ***p < 0.001 versus the I+EXO-124 group. ##p < 0.01 and ###p < 0.001 versus the control group.CC BY · PubMed Central
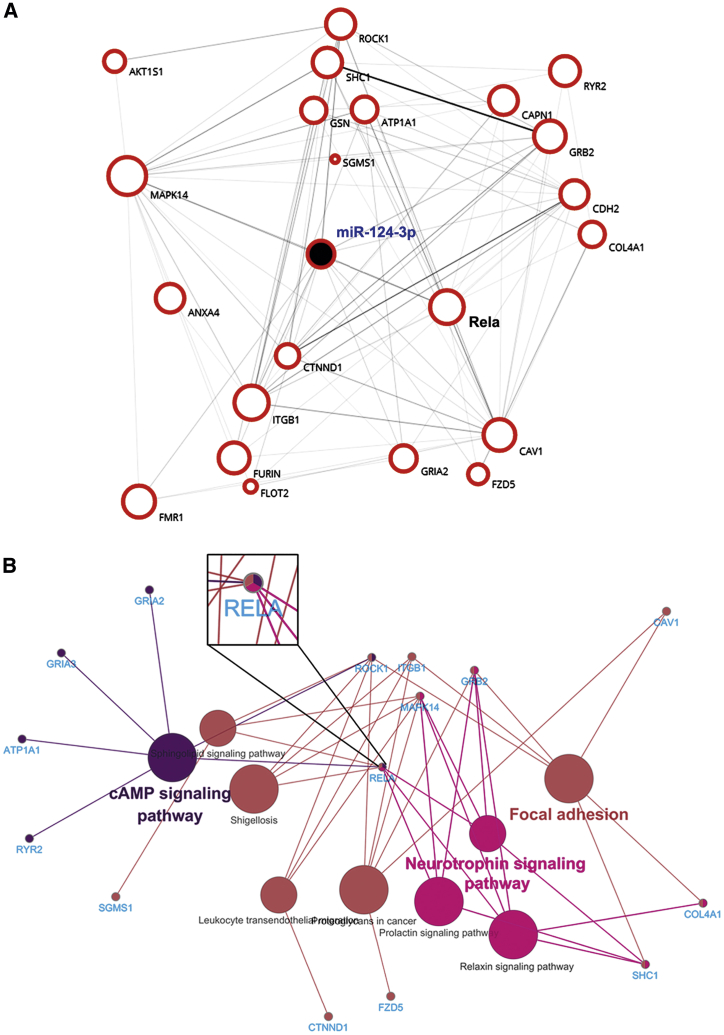
Figure 4 Bioinformatics Analysis of miR-124-3p and Its Downstream Targeted Genes (A) The genetic interaction network of miR-124-3p built by Biovista Vizit. There are 22 possible targeted genes of miR-124-3p associated with neurodegeneration and amyloid deposition. Rela is one of the core genes connected with other genes in the network. (B) KEGG analysis for the predicted miR-124-3p targeted genes using Cytoscape software. Note that Rela is the only gene that was involved in all the top three enriched signaling pathways (neurotrophin signaling pathway, focal adhesion, and cAMP signaling pathway) regulated by the 22 neurodegeneration-associated miR-124-3p targeted genes.
Figure 4 Bioinformatics Analysis of miR-124-3p and Its Downstream Targeted Genes (A) The genetic interaction network of miR-124-3p built by Biovista Vizit. There are 22 possible targeted genes of miR-124-3p associated with neurodegeneration and amyloid deposition. Rela is one of the core genes connected with other genes in the network. (B) KEGG analysis for the predicted miR-124-3p targeted genes using Cytoscape software. Note that Rela is the only gene that was involved in all the top three enriched signaling pathways (neurotrophin signaling pathway, focal adhesion, and cAMP signaling pathway) regulated by the 22 neurodegeneration-associated miR-124-3p targeted genes.CC BY · PubMed Central
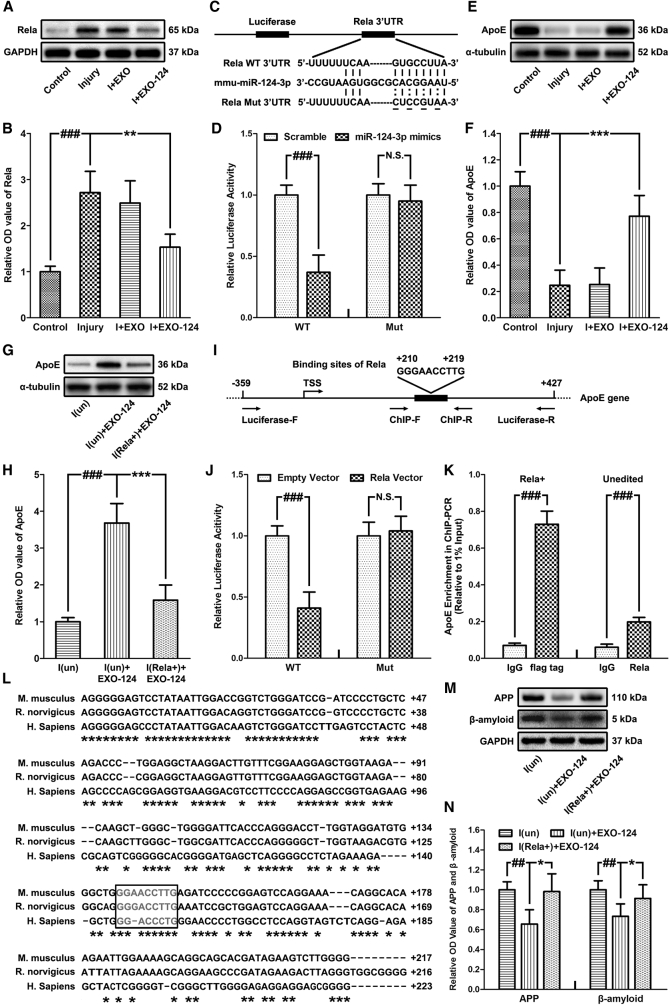
Figure 5 Microglial Exosomal miR-124-3p Inhibits Neurodegeneration by Targeting Rela, an Inhibitory Transcription Factor of ApoE, thus Promoting ApoE Expression and Inhibiting Aβ Abnormalities (A and B) Immunoblotting (A) and quantitative data (B) of Rela in neurons after injury and exosome treatment. (C) Schematic representation of the putative binding sites for miR-124-3p in the Rela 3′ UTR. The wild-type (Rela WT 3′ UTR) and mutant type (Rela Mut 3′ UTR) of luciferase reporter constructs have, respectively, intact and mutated seed sequences (underlined) in the miR-124-3p binding sites. (D) The relative luciferase activity of the Rela 3′ UTR reporter constructs, which were co-transfected with either miR-124-3p mimics or scrambled oligonucleotides into neurons. The data are presented as the ratio of luciferase activity from scrambled oligonucleotides versus miR-124-3p mimic-transfected neurons. (E and F) Immunoblotting (E) and quantitative data (F) of ApoE in neurons. (G and H) Immunoblotting (G) and quantitative data (H) of ApoE in unedited/Rela+ neurons after injury and exosome treatment. (I) Location of the binding sequences of Rela in mouse ApoE gene. (J) The relative luciferase activity of the ApoE promoter reporter constructs, which were co-transfected with either Rela expression vector or empty vector into neurons. The data are presented as the ratio of luciferase activity from the empty-vector- versus Rela-expression-vector-transfected neurons. (K) ChIP-PCR results of the unedited and Rela+ (FLAG-tagged) neurons. The data are expressed by the results of qRT-PCR (relative to 1% of input) for the pulled-down DNA fragments using the primers around the putative binding sites of Rela in the ApoE gene. (L) Alignment of promoter-flanking region of mouse ApoE gene with the human and rat counterparts. Asterisks indicate nucleotides conserved. Putative binding sites for Rela in ApoE gene are boxed. (M and N) Immunoblotting (M) and quantitative data (N) of APP and Aβ in unedited/Rela+ neurons after injury and exosome treatment. n = 6 per group. The data are presented as mean ± SD. *p < 0.05, **p < 0.01, and ***p < 0.001 versus the I+EXO-124 group; ##p < 0.01 and ###p < 0.001 versus the control group. Abbreviations: ChIP-F, forward primer for ChIP assay; ChIP-R, reverse primer for ChIP assay; DPI, days post-injury; I(un), unedited injured neurons; I(Rela+), Rela overexpressed injured neurons; Luciferase-F, forward primer for luciferase assay; Luciferase-R, reverse primer for luciferase assay; Mut, mutant type; WT, wild-type.
Figure 5 Microglial Exosomal miR-124-3p Inhibits Neurodegeneration by Targeting Rela, an Inhibitory Transcription Factor of ApoE, thus Promoting ApoE Expression and Inhibiting Aβ Abnormalities (A and B) Immunoblotting (A) and quantitative data (B) of Rela in neurons after injury and exosome treatment. (C) Schematic representation of the putative binding sites for miR-124-3p in the Rela 3′ UTR. The wild-type (Rela WT 3′ UTR) and mutant type (Rela Mut 3′ UTR) of luciferase reporter constructs have, respectively, intact and mutated seed sequences (underlined) in the miR-124-3p binding sites. (D) The relative luciferase activity of the Rela 3′ UTR reporter constructs, which were co-transfected with either miR-124-3p mimics or scrambled oligonucleotides into neurons. The data are presented as the ratio of luciferase activity from scrambled oligonucleotides versus miR-124-3p mimic-transfected neurons. (E and F) Immunoblotting (E) and quantitative data (F) of ApoE in neurons. (G and H) Immunoblotting (G) and quantitative data (H) of ApoE in unedited/Rela+ neurons after injury and exosome treatment. (I) Location of the binding sequences of Rela in mouse ApoE gene. (J) The relative luciferase activity of the ApoE promoter reporter constructs, which were co-transfected with either Rela expression vector or empty vector into neurons. The data are presented as the ratio of luciferase activity from the empty-vector- versus Rela-expression-vector-transfected neurons. (K) ChIP-PCR results of the unedited and Rela+ (FLAG-tagged) neurons. The data are expressed by the results of qRT-PCR (relative to 1% of input) for the pulled-down DNA fragments using the primers around the putative binding sites of Rela in the ApoE gene. (L) Alignment of promoter-flanking region of mouse ApoE gene with the human and rat counterparts. Asterisks indicate nucleotides conserved. Putative binding sites for Rela in ApoE gene are boxed. (M and N) Immunoblotting (M) and quantitative data (N) of APP and Aβ in unedited/Rela+ neurons after injury and exosome treatment. n = 6 per group. The data are presented as mean ± SD. *p < 0.05, **p < 0.01, and ***p < 0.001 versus the I+EXO-124 group; ##p < 0.01 and ###p < 0.001 versus the control group. Abbreviations: ChIP-F, forward primer for ChIP assay; ChIP-R, reverse primer for ChIP assay; DPI, days post-injury; I(un), unedited injured neurons; I(Rela+), Rela overexpressed injured neurons; Luciferase-F, forward primer for luciferase assay; Luciferase-R, reverse primer for luciferase assay; Mut, mutant type; WT, wild-type.CC BY · PubMed Central
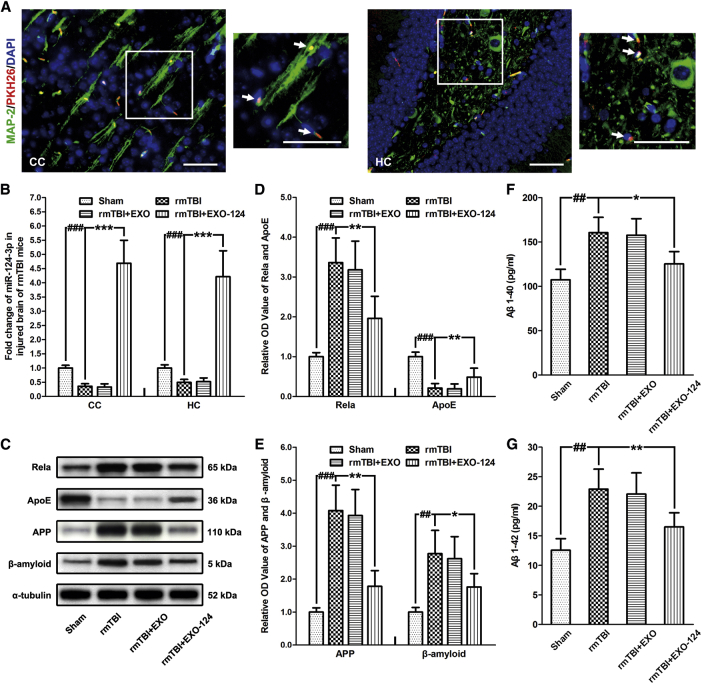
Figure 6 Microglial Exosomes with Upregulated miR-124-3p Contribute to Alleviating Neurodegeneration in rmTBI Mice (A) Immunofluorescence staining of neurons in the cerebral cortex (CC) and the hippocampus (HC) of rmTBI mice, taking up exogenous microglial exosomes. Note that the intravenously injected exosomes are taken up by neurons (marked by co-expression of MAP-2 and PKH26) at 42 days post-injury (DPI). The immunostained areas in the white box are shown with high magnification. The double immunostained cells are indicated by white arrows. Scale bars: 50 μm. (B) The altered miR-124-3p level in the CC and the HC of rmTBI mice after exosome treatment at 42 DPI. (C) Immunoblotting of Rela, ApoE, APP, and Aβ in the HC of rmTBI mice after exosome treatment at 42 DPI. (D) Quantitative data of Rela and ApoE in the HC of rmTBI mice after exosome treatment at 42 DPI. (E) Quantitative data of APP and Aβ in the HC of rmTBI mice after exosome treatment at 42 DPI. (F and G) The expression levels of soluble (F) Aβ1–40 and (G) Aβ1–42 in brain extracts from HC at 42 DPI. n = 6 per group. The data are presented as mean ± SD. *p < 0.05, **p < 0.01, and ***p < 0.001 versus the rmTBI+EXO-124 group; ##p < 0.01 and ###p < 0.001 versus the sham group.
Figure 6 Microglial Exosomes with Upregulated miR-124-3p Contribute to Alleviating Neurodegeneration in rmTBI Mice (A) Immunofluorescence staining of neurons in the cerebral cortex (CC) and the hippocampus (HC) of rmTBI mice, taking up exogenous microglial exosomes. Note that the intravenously injected exosomes are taken up by neurons (marked by co-expression of MAP-2 and PKH26) at 42 days post-injury (DPI). The immunostained areas in the white box are shown with high magnification. The double immunostained cells are indicated by white arrows. Scale bars: 50 μm. (B) The altered miR-124-3p level in the CC and the HC of rmTBI mice after exosome treatment at 42 DPI. (C) Immunoblotting of Rela, ApoE, APP, and Aβ in the HC of rmTBI mice after exosome treatment at 42 DPI. (D) Quantitative data of Rela and ApoE in the HC of rmTBI mice after exosome treatment at 42 DPI. (E) Quantitative data of APP and Aβ in the HC of rmTBI mice after exosome treatment at 42 DPI. (F and G) The expression levels of soluble (F) Aβ1–40 and (G) Aβ1–42 in brain extracts from HC at 42 DPI. n = 6 per group. The data are presented as mean ± SD. *p < 0.05, **p < 0.01, and ***p < 0.001 versus the rmTBI+EXO-124 group; ##p < 0.01 and ###p < 0.001 versus the sham group.CC BY · PubMed Central
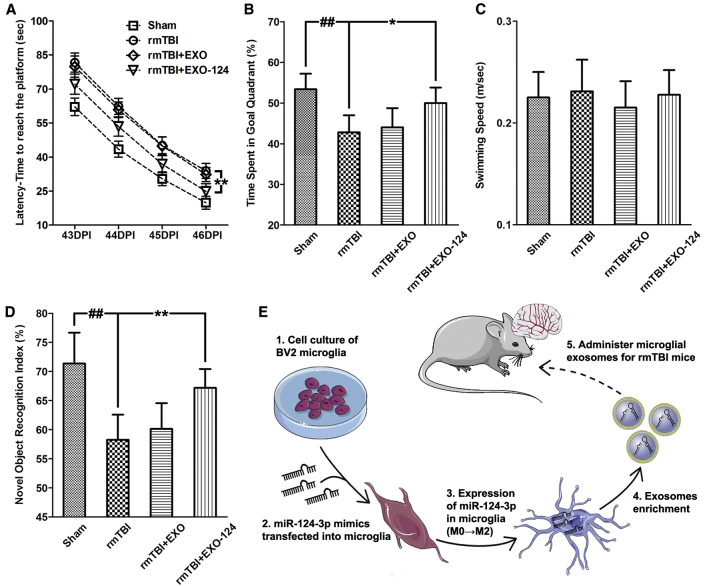
Figure 7 Microglial Exosomes with Upregulated miR-124-3p Improve the Cognitive Outcome of rmTBI Mice (A) The escape latency detected in the spatial acquisition trials (43–46 days post-injury [DPI]) of the Morris water maze (MWM) test. (B) The time spent in the goal quadrant detected in the probe trials (47 DPI) of the MWM test. (C) The swimming speed of rmTBI mice in the MWM test. (D) The novel object recognition index of rmTBI mice detected at 42 DPI. (E) The schematic illustration of the in vivo experiment. n = 10 per group. The data are presented as mean ± SEM in (A) and mean ± SD in (B)–(D). *p < 0.05 and **p < 0.01 versus the I+EXO-124 group; ##p < 0.01 versus the control group.
Figure 7 Microglial Exosomes with Upregulated miR-124-3p Improve the Cognitive Outcome of rmTBI Mice (A) The escape latency detected in the spatial acquisition trials (43–46 days post-injury [DPI]) of the Morris water maze (MWM) test. (B) The time spent in the goal quadrant detected in the probe trials (47 DPI) of the MWM test. (C) The swimming speed of rmTBI mice in the MWM test. (D) The novel object recognition index of rmTBI mice detected at 42 DPI. (E) The schematic illustration of the in vivo experiment. n = 10 per group. The data are presented as mean ± SEM in (A) and mean ± SD in (B)–(D). *p < 0.05 and **p < 0.01 versus the I+EXO-124 group; ##p < 0.01 versus the control group.CC BY · PubMed Central

Verification

Claims the paper makes

The claims and statistics of this paper haven’t been checked yet.

Run the check — free, no account needed. It reads the open-access text and checks the sources it cites.

A few free checks a day · papers already verified open instantly · results are public

Claims other papers make about this one

Each is checked against this paper’s own text: does it say what the citing paper says it does?

Self-check

Percentages, sums and reported differences re-computed from the paper’s own numbers.

The self-check needs the paper’s full text.

Citations

Cites

Show all 67 references

Cited by

Sorted by citations

See all 247

Metadata

Authors
Ge, X., Guo, M., Hu, T., Li, W., Huang, S., Yin, Z., Li, Y., Chen, F., Zhu, L., Kang, C., Jiang, R., Lei, P., & Zhang, J.
Affiliations
Tianjin Medical University General Hospital (CN)
Corresponding author
  • Jiang, Rongcai
  • Lei, Ping
  • Zhang, Jianning
Venue
Molecular Therapy
Publisher
Elsevier BV
Published
2020-02
Volume
28
Issue
2
Pages
503-522
ISSN
1525-0016 (ISSN-L)
OpenAlex
W2990551073
Cited by
242
References
67
Citations by year
2026: 26 · 2025: 50 · 2024: 40 · 2023: 42 · 2022: 37 · 2021: 34 · 2020: 13
FWCI
6.95
Type
journal article
Language
en
Open access
Locations
  • Molecular Therapy (publishedVersion, cc-by)
  • Europe PMC (PubMed Central) (publishedVersion, cc-by)
  • PubMed Central (publishedVersion, cc-by)
  • PubMed (publishedVersion)
Funders
  • National Natural Science Foundation of China (81501055, 81772060, 81720108015, 81671221)
  • Tianjin Municipal Science and Technology Commission Natural Fund Project (18JCQNJC81100)
Topics
  • Life Sciences › Biochemistry, Genetics and Molecular Biology › Molecular Biology › Extracellular vesicles in disease
  • Health Sciences › Medicine › Clinical Neurology › Traumatic Brain Injury and Neurovascular Disturbances
  • Life Sciences › Neuroscience › Neurology › Neuroinflammation and Neurodegeneration Mechanisms
Keywords
repetitive mild traumatic brain injury, miR-124-3p, neurodegeneration, cognitive impairment, amyloid-beta, Alzheimer's disease, exosome therapy, hippocampal neurons, microglia
MeSH terms
Animals, Apolipoproteins E, Brain Concussion, Cognition, Disease Models, Animal, Male, Models, Biological, Neurons, Severity of Illness Index, Signal Transduction, Microglia, Computational Biology, Neurodegenerative Diseases, Gene Expression Profiling, RNA Interference, MicroRNAs, Mice, Transcription Factor RelA, Exosomes

About these checks

Registry, retraction, Cites and statistics results are computed, not judged, with one exception: a printed reference that no index lists is read once by a model before it counts as a citation error. Claims are extracted by a model and kept only when their quote appears verbatim in the text; each cited source is then checked, with a model’s help, for whether it says what the claim relies on. Those verdicts can be wrong — read the claim’s quote and the cited source before relying on one.

Statistics and arithmetic are recomputed, not judged.

Confidence bands are shown only for fields calibrated on our annotated test set. None is calibrated yet, so no band is shown.

What counts as a claim ›How we measure confidence ›How we check this ›

Are you an author, or do you see a problem with this page? Request a review