

The DOI matches its Crossref record; 2 of the 2 references it cites were found in a registry or an index.
Bayesian system identification for structures considering spatial and temporal correlation
Abstract
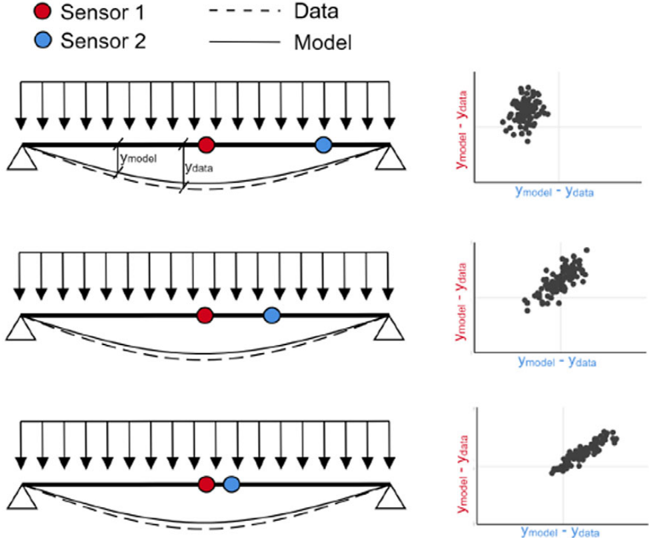
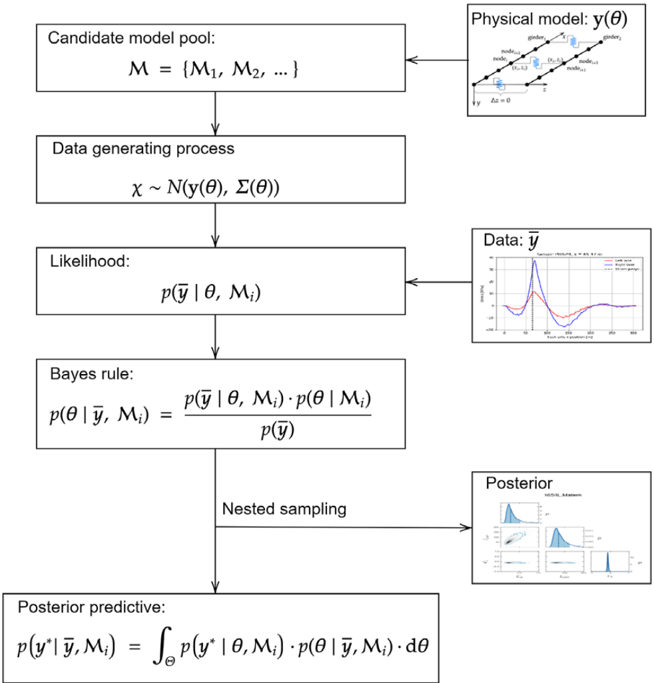
The decreasing cost and improved sensor and monitoring system technology (e.g., fiber optics and strain gauges) have led to more measurements in close proximity to each other. When using such spatially dense measurement data in Bayesian system identification strategies, the correlation in the model prediction error can become significant. The widely adopted assumption of uncorrelated Gaussian error may lead to inaccurate parameter estimation and overconfident predictions, which may lead to suboptimal decisions. This article addresses the challenges of performing Bayesian system identification for structures when large datasets are used, considering both spatial and temporal dependencies in the model uncertainty. We present an approach to efficiently evaluate the log-likelihood function, and we utilize nested sampling to compute the evidence for Bayesian model selection. The approach is first demonstrated on a synthetic case and then applied to a (measured) real-world steel bridge. The results show that the assumption of dependence in the model prediction uncertainties is decisively supported by the data. The proposed developments enable the use of large datasets and accounting for the dependency when performing Bayesian system identification, even when a relatively large number of uncertain parameters is inferred.
Overview
The claims and statistics of this paper haven’t been checked yet.
Run the check — free, no account needed. It reads the open-access text and checks the sources it cites.
Integrity signals
Registry
Cites
Statistics
Figures
Verification
Claims the paper makes
The claims and statistics of this paper haven’t been checked yet.
Run the check — free, no account needed. It reads the open-access text and checks the sources it cites.
Claims other papers make about this one
Each is checked against this paper’s own text: does it say what the citing paper says it does?
The cited source says what the claim attributes to it.
In the citing paper
“However, accounting for correlation can be challenging due to the difficulty of specifying an appropriate description in the likelihood function, and the additional computational effort required to infer the corresponding parameters [53,54].”
From On the Consistent Classification and Treatment of Uncertainties in Structural Health Monitoring Applications (2025) · cites this paper as [53]
In the citing paper
“It should be noted that in many applications, particularly when using data obtained from spatially dense sensor grids sampling at high frequencies, spatial and temporal correlation may be present in the discrepancies between measurements and model predictions which can have a significant influence on the estimated posterior distribution.”
From On the Consistent Classification and Treatment of Uncertainties in Structural Health Monitoring Applications (2025) · cites this paper as [53]
Self-check
Percentages, sums and reported differences re-computed from the paper’s own numbers.
The self-check needs the paper’s full text.
Citations
Cites
Structural Health Monitoring of Large Civil Engineering Structures
Chen, H., & Ni, Y. (2018) · doi:10.1002/9781119166641 · Cited by 223
Ebrahimian, H., Astroza, R., Conte, J. P., & Papadimitriou, C. (2018) · Structural Control and Health Monitoring · doi:10.1002/stc.2128 · Cited by 103
Research works printed but not linked: 45
- 10.1063/1.1699114 · DOI · Paper page
- 10.1061/(ASCE)0733-9399(1998)124:4(455) · DOI
- 10.1002/stc.424 · DOI
- 10.1002/stc.1684 · DOI
- Quarteroni, 2007, Numerical Mathematics
- 10.1002/stc.2140 · DOI
- 10.1093/mnras/staa278 · DOI
- Cheong, S (2016) Parameter Estimation for the Spatial Ornstein-Uhlenbeck Process with Missing Observations. PhD Thesis, University of Wisconsin Milwaukee UWM.
- Koune, I (2021) Bayesian System Identification for Structures Considering Spatial and Temporal Dependencies. MSc Thesis, Delft University of Technology.
- 10.1016/j.ymssp.2011.04.001 · DOI
- 10.1201/b16018 · DOI · Paper page
- MacKay, 2003, Information Theory, Inference and Learning Algorithms
- 10.1093/biomet/57.1.97 · DOI · Paper page
- Duvenaud, DK (2014) Automatic Model Construction with Gaussian Processes. PhD Thesis, University of Cambridge.
- 10.1111/1467-9868.00294 · DOI · Paper page
- 10.1080/1361593022000029467 · DOI
- 10.1016/j.ymssp.2017.01.040 · DOI · Paper page
- 10.1016/j.ymssp.2011.05.019 · DOI
- 10.1098/rsta.2006.1925 · DOI
- 10.1016/j.apenergy.2019.114394 · DOI
- 10.1214/06-BA127 · DOI
- 10.1016/j.cageo.2017.11.012 · DOI
- 10.1080/15732479.2022.2131847 · DOI
- 10.1177/1369433218811540 · DOI
- 10.1016/j.aei.2015.07.007 · DOI
- 10.1016/j.ymssp.2014.11.001 · DOI · Paper page
- Hoeting, 1999, Bayesian model averaging: A tutorial, Statistical Science, 14, 382
- 10.1002/9781118443118 · DOI
- 10.1080/01621459.2017.1415907 · DOI
- 10.3390/s16050748 · DOI
- 10.1111/j.1467-8667.2006.00432.x · DOI
- Jeffreys, 2003, Theory of Probability
- 10.1002/suco.201700169 · DOI
- Ye, 2014, Structural health monitoring of civil infrastructure using optical fiber sensing technology: A comprehensive review, The Scientific World Journal, 2014, 1
- 10.1016/j.jsv.2013.03.019 · DOI · Paper page
- 10.1016/j.jsv.2011.07.036 · DOI
- Stegle, 2011, Efficient inference in matrix-variate Gaussian models with iid observation noise, Advances in Neural Information Processing Systems, 24, 630
- Rogers, TJ (2018) Towards Bayesian System Identification: With Application to SHM of Offshore Structures. PhD Thesis, University of Sheffield.
- 10.1016/j.engstruct.2014.08.035 · DOI
- 10.1002/suco.201700287 · DOI
- 10.1016/j.ijfatigue.2014.08.003 · DOI
- 10.1002/env.854 · DOI
- 10.1016/j.ymssp.2021.107760 · DOI · Paper page
- 10.1061/(ASCE)0733-9399(2004)130:2(192) · DOI
- 10.1016/S0267-7261(98)00008-6 · DOI
Cited by
Kamariotis, A., Vlachas, K., Ntertimanis, V., Koune, I., Cicirello, A., & Chatzi, E. (2025) · ASCE-ASME Journal of Risk and Uncertainty in Engineering Systems, Part B: Mechanical Engineering · doi:10.1115/1.4067140 · Cited by 15
Self-citation
Metadata
- Authors
- Koune, I., Rózsás, Á., Slobbe, A., & Cicirello, A.
- Venue
- Data-Centric Engineering
- Publisher
- Cambridge University Press (CUP)
- Published
- 2023
- Volume
- 4
- ISSN
- 2632-6736
- Cited by
- 11
- References
- 2
- Language
- en
- Funders
- Nederlandse Organisatie voor Wetenschappelijk Onderzoek (NWA.1431.20.002)
About these checks
Registry, retraction, Cites and statistics results are computed, not judged, with one exception: a printed reference that no index lists is read once by a model before it counts as a citation error. Claims are extracted by a model and kept only when their quote appears verbatim in the text; each cited source is then checked, with a model’s help, for whether it says what the claim relies on. Those verdicts can be wrong — read the claim’s quote and the cited source before relying on one.
Statistics and arithmetic are recomputed, not judged.
Confidence bands are shown only for fields calibrated on our annotated test set. None is calibrated yet, so no band is shown.
What counts as a claim ›How we measure confidence ›How we check this ›
Are you an author, or do you see a problem with this page? Request a review
Data sources
Bibliographic data: Semantic Scholar, OpenAlex, Crossref.
Contains information from the Semantic Scholar Academic Graph Datasets, made available under the ODC Attribution License (ODC-BY 1.0).
Semantic Scholar’s data is described in: Kinney, R., et al. (2023). The Semantic Scholar Open Data Platform. arXiv:2301.10140.
