

The DOI matches its Crossref record; 56 of the 56 references it cites were found in a registry or an index; none of the 8 sources its claims cite is checked for support yet.
We Do Not Know the Population of Every Country in the World for the Past Two Thousand Years
Open accessAbstract
Economists have reported results based on populations for every country in the world for the past two thousand years. The source, McEvedy and Jones’ Atlas of World Population History, includes many estimates that are little more than guesses and that do not reflect research since 1978. McEvedy and Jones often infer population sizes from their view of a particular economy, making their estimates poor proxies for economic growth. Their rounding means their measurement error is not “classical.” Some economists augment that error by disaggregating regions in unfounded ways. Econometric results that rest on McEvedy and Jones are unreliable. “… we haven’t just pulled the figures out of the sky. Well, not often.” —McEvedy and Jones (1978, p. 11)
Overview
CoChat Summary
TL;DR
Guinnane argues that the widely used McEvedy and Jones (1978) population estimates for every country over the past two millennia are often guesses, outdated, circular, and affected by non-classical measurement error, so econometric results relying on them are unreliable. A replication of Nunn and Qian (2011) shows their potato–population result loses significance when African hard clones are dropped.
Key findings
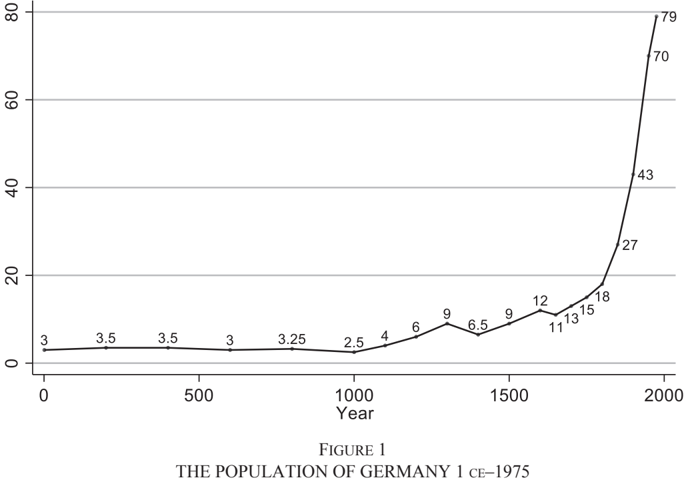
- MJ’s estimates often lack firm foundations: MJ say there are “almost no data” for Germany until the late Middle Ages, Poland before the 14th century is based on “general ideas,” and for the Maghreb “there is really nothing” before the 19th century, yet they report totals far back. Their rounding rules make measurement error non-classical: below 1 million to nearest .1 million, 1–10 million to nearest .25 million, 10–20 million to nearest .5 million, 20–100 million to nearest 1 million, etc. Monte Carlo simulations show the correlation between simulated true population and rounding error is significant in 72.2–94.3% of experiments depending on year and distribution (Table 2).
- MJ create “soft clones” by assigning similar population dynamics to countries they think are alike—e.g., Afghanistan assumed to have half of Iran’s population before 1900, Kenya and Uganda identical through 1800, and 35% of countries assigned the same growth rate from years 1 to 1000. Economists then create “hard clones” by disaggregating MJ regions into countries; in Nunn and Qian (2011), hard clones account for 76% of African observations, 36% in Europe, and 41% in Asia.
- Replicating Nunn and Qian (2011), the baseline potato × post-1750 coefficient is 0.0325 (SE 0.0116); dropping African clones gives 0.0296 (0.0172), no longer significantly different from zero; dropping all Africa gives 0.0207 (0.0184). Dropping all clones gives 0.0575 (0.0209).
- Maddison relied heavily on MJ before 1500; he updated 23% of MJ’s observations for year 1000 and 40% for 1500, while in 1850, 84% of 51 observations differ from MJ, with an average absolute difference of 3%. For England and Wales, MJ imply annual growth of .32% in 1600–1650 versus Wrigley and Schofield’s .5%; .26% versus −0.07% in 1650–1700; and .10% versus .26% in 1700–1750.
Methods
- Critical audit of McEvedy and Jones’s *Atlas of World Population History* and its use in economics, examining MJ’s stated methods, rounding rules, and patterns in the MJ database provided by James Fenske.
- Monte Carlo simulations of MJ’s rounding for years 1000, 1500, and 1800 under four distributional assumptions; checks using U.S. state populations 1900–1970 and world country populations 1960–2020; replication exercises for Nunn and Qian (2011) and Ashraf and Galor (2011) with clones dropped; and a survey of every paper citing MJ in the “Top 5” economics journals through 2020.
- No new historical population estimates are produced; the paper uses published replication files, census data, and MJ’s own figures.
Limitations
- The paper states that correct population data are unavailable, so it cannot re-estimate published models with corrected data; the replication exercise is “narrow and specific”; the U.S. state analogy “may not provide a strict analogy” to MJ’s regions; and the simulation addresses only rounding, not MJ’s other flaws.
- Evident from the text: the analysis focuses on economics literature and MJ/Maddison, does not supply alternative population series for most countries, and its hard-clone checks rely on U.S. states and selected replications rather than a full redefinition of all variables.
Model-written summary. Check it against the paper before relying on it.
Integrity signals
Registry
Cites
Statistics
Figures
Verification
Claims the paper makes
0 Valid · 12 Not valid · 12 Not checked · 75 Own results and interpretations
A result the paper reports from its own data — it cites no other source for it, so there is none to check. The quote shows it is in the paper.
In the paper
“Table 1 shows the overall patterns; in many cases, MJ apparently devised a population estimate after deciding on a round figure for percentage growth.”
hedgedstates a cause- Asserted: passes — The authors put it forward as true.
- Checkable: passes — It can be checked against evidence.
- Load-bearing: passes — The paper’s conclusions depend on it.
- Based: passes — The paper gives a reason why it holds.
A result the paper reports from its own data — it cites no other source for it, so there is none to check. The quote shows it is in the paper.
In the paper
“This figure illustrates the great range in values for a given place and time that result from cloning the MJ regions.”
plain- Asserted: passes — The authors put it forward as true.
- Checkable: passes — It can be checked against evidence.
- Load-bearing: passes — The paper’s conclusions depend on it.
- Based: passes — The paper gives a reason why it holds.
A result the paper states — it cites no source for it, so there is none to check. The quote shows it is in the paper.
In the paper
“Even the countries that are not clones in the Nunn-Qian or Ashraf-Galor datasets have rounding error plus the measurement error inherent in MJ's guesses.”
plain- Asserted: passes — The authors put it forward as true.
- Checkable: passes — It can be checked against evidence.
- Load-bearing: unclear — It is unclear whether the paper’s conclusions depend on it.
- Based: passes — The paper gives a reason why it holds.
A result the paper states — it cites no source for it, so there is none to check. The quote shows it is in the paper.
In the paper
“This approach fares poorly in the U.S. case because of the unequal population densities within some U.S. regions; the”
plainstates a causeSingle case- Asserted: passes — The authors put it forward as true.
- Checkable: passes — It can be checked against evidence.
- Load-bearing: passes — The paper’s conclusions depend on it.
- Based: passes — The paper gives a reason why it holds.
None of the sources cited for this claim have been checked yet.
In the paper
“Wrigley and Schofield's figures put that rate at .5 percent.”
plain- Asserted: passes — The authors put it forward as true.
- Checkable: passes — It can be checked against evidence.
- Load-bearing: passes — The paper’s conclusions depend on it.
- Based: passes — The paper gives a reason why it holds.
44 more claims
Create a free account to see all 99 claims and to verify the 1 reference still open.
- It may state two separate claims as one. 31
- Probably not a substantial claim. 29
- The quote only partly states this claim. 2
Self-check
Percentages, sums and reported differences re-computed from the paper’s own numbers.
Each contradiction between two passages listed here was confirmed by an independent check.
Rated minor: it would not touch a result — a value no result rests on, a p-value that stays on the same side of the significance level, or a conflict that is clerical, resolved elsewhere in the paper, or outside its own findings.
In the paper
§ Abstract
“The modal change for that period was 25 percent; MJ think 16 percent of countries had that modal growth rate.”
§ Abstract
“1500-1600 79 30 25 21 0 16 50 8”
Rated minor: it would not touch a result — a value no result rests on, a p-value that stays on the same side of the significance level, or a conflict that is clerical, resolved elsewhere in the paper, or outside its own findings.
In the paper
§ HARD CLONES
“I constructed a panel from the population of the 50 United States as reported in the decennial census.”
§ HARD CLONES
“Source: Computed from MJ database.”
Rated minor: it would not touch a result — a value no result rests on, a p-value that stays on the same side of the significance level, or a conflict that is clerical, resolved elsewhere in the paper, or outside its own findings.
In the paper
§ Econometric Implications of Hard Clones
“The next three specifications repeat (2)-(4) using Nunn and Qian's data but use the Ashraf-Galor definition of clones.”
§ Econometric Implications of Hard Clones
“Sample All -Afr clones No clones No Africa All -Afr clones No Africa”
Citations
Cites
The colonial origins of comparative development: An empirical investigation
Acemoglu, D., Johnson, S., & Robinson, J. A. (2001) · American Economic Review · doi:10.1257/aer.91.5.1369 · Cited by 8,517
The analysis of household surveys: A microeconometric approach to development policy
Deaton, A. (1997) · doi:10.1596/0-8018-5254-4 · Cited by 4,877
Acemoğlu, D., Johnson, S., & Robinson, J. A. (2002) · The Quarterly Journal of Economics · doi:10.1162/003355302320935025 · Cited by 3,410
Acemoglu, D., & Johnson, S. (2005) · Journal of Political Economy · doi:10.1086/432166 · Cited by 2,385
The Rise of Europe: Atlantic Trade, Institutional Change, and Economic Growth
Acemoğlu, D., Johnson, S., & Robinson, J. A. (2005) · American Economic Review · doi:10.1257/0002828054201305 · Cited by 1,904
Acemoğlu, D., Johnson, S., Robinson, J. A., & Yared, P. (2005) · American Economic Review · doi:10.1257/aer.98.3.808 · Cited by 1,602
The Colonial Origins of Comparative Development: An Empirical Investigation
Acemoğlu, D., Johnson, S., & Robinson, J. A. (2000) · National Bureau of Economic Research · doi:10.3386/w7771 · Cited by 1,552
The World Economy: A Millennial Perspective
Maddison, A. (2001) · Development Centre Studies · doi:10.1787/9789264189980-en · Cited by 1,537
Anthropogenic land use estimates for the Holocene – HYDE 3.2
Klein Goldewijk, K., Beusen, A., Doelman, J., & Stehfest, E. (2017) · Earth System Science Data · doi:10.5194/essd-9-927-2017 · Cited by 1,204
The Long-Term Effects of Africa's Slave Trades *
Nunn, N. (2008) · Quarterly Journal of Economics · doi:10.1162/qjec.2008.123.1.139 · Cited by 1,159
Research works printed but not linked: 4
- ---. "The 'Out of Africa' Hypothesis, Human Genetic Diversity, and Comparative Economic Development." American Economic Review 103, no. 1 (2013): 1-46.
- Clark, Gregory. "Review of Angus Maddison's Contours of the World Economy." Journal of Economic History 69, no. 4 (2009): 1156-61.
- Greene, William H. Econometric Analysis, 8th ed.. London: Pearson, 2018.
- Wooldridge, Jeffrey M. Econometric Analysis of Cross Section and Panel Data, 2nd ed. Cambridge, MA: MIT Press, 2010.
Cited by
Persistence studies: a new kind of economic history?
Cioni, M., Federico, G., & Vasta, M. (2022) · Review of Regional Research · doi:10.1007/s10037-022-00167-0 · Cited by 20
Mapping high-resolution global gridded population distribution from 1870 to 2100
Zhuang, H., Liu, X., Li, B., Wu, C., Yan, Y., Zeng, L., & Zheng, C. (2024) · The Science of The Total Environment · doi:10.1016/j.scitotenv.2024.176867 · Cited by 14
A time-varying index for agricultural suitability across Europe from 1500–2000
Lehner, A., & Philippe, D. (2025) · Scientific Data · doi:10.1038/s41597-024-04194-z · Cited by 6
Croplands in Canada over the past millennium: A geographically explicit reconstruction
Li, S., Gao, D., Zhao, Z., & Hua, L. (2025) · Science China Earth Sciences · doi:10.1007/s11430-024-1543-7 · Cited by 5
How Deep Are the Roots of Female Empowerment? Population Diversity and Gender Inequality*
Vu, T. V. (2024) · Oxford Bulletin of Economics and Statistics · doi:10.1111/obes.12651 · Cited by 5
Institutional Drift, Property Rights, and Economic Development: Evidence from Historical Treaties
Feir, D. L., Gillezeau, R., & Jones, M. (2023) · National Bureau of Economic Research · doi:10.3386/w31713 · Cited by 4
Solving the longitude puzzle: A story of clocks, ships and cities
Miotto, M., & Pascali, L. (2025) · Journal of International Economics · doi:10.1016/j.jinteco.2025.104067 · Cited by 3
Beyond open science: Data, code, and causality
Wolf, L. J. (2023) · Environment and Planning B Urban Analytics and City Science · doi:10.1177/23998083231210180 · Cited by 2
Trivellato, F. (2024) · Cromohs - Cyber Review of Modern Historiography · doi:10.36253/cromohs-15297 · Cited by 1
The Fractured-Land HypothesisPreprint
Fernández‐Villaverde, J., Koyama, M., Lin, Y., & Sng, T. (2020) · SSRN Electronic Journal · doi:10.2139/ssrn.3682342 · Cited by 1
Colonization Through Treaties: Evidence from CanadaPreprint
Feir, D. L., Jones, M., & Gillezeau, R. (2023) · SSRN Electronic Journal · doi:10.2139/ssrn.4579329 · Cited by 1
The Historical Origins of Economic Growth and Inequality and the Implications for Policy Today
Hoffman, P. T. (2024) · Journal of Historical Political Economy · doi:10.1561/115.00000080
李, 士., 高, 等., 赵, 志., & 华, 磊. (2025) · SCIENTIA SINICA Terrae · doi:10.1360/n072024-0232
Running a rebellion : essays on armed group behavior
Weiner, J. D. F. (2024) · cIRcle (University of British Columbia) · doi:10.14288/1.0439963
Colonial Cities and Urbanization
Chaudhary, L., & Fenske, J. E. (2026) · Cambridge University Press eBooks · doi:10.1017/9781108966788.022
Gridded population distribution data for the Yellow River Basin, 1000–2000 AD
Wang, Y., Li, M., He, F., Yang, F., Wang, S., Li, Y., & Guo, R. (2026) · Scientific Data · doi:10.1038/s41597-026-08178-z
Population Registers: The Travelling of Data in Qing China
ZHANG, X. (2026) · Springer eBooks · doi:10.1007/978-3-032-10114-3_4
Metadata
- Authors
- Guinnane, T. W.
- Affiliations
- Yale University (US)
- Corresponding author
- Guinnane, Timothy W.
- ORCID
- Guinnane, Timothy W.
- Venue
- The Journal of Economic History
- Publisher
- Cambridge University Press (CUP)
- Published
- 2023-08-31
- Volume
- 83
- Issue
- 3
- Pages
- 912-938
- ISSN
- 0022-0507 (ISSN-L)
- 1471-6372
- OpenAlex
- W3195475345
- Semantic Scholar
- 948b79e0c013fe51ba1184bc77bcb93ef66626d7
- Cited by
- 17
- References
- 56
- Citations by year
- 2026: 3 · 2025: 4 · 2024: 5 · 2023: 3
- FWCI
- 2.61
- Type
- journal article
- Language
- en
- Open access
- hybrid
- doi.org
- Locations
- The Journal of Economic History (publishedVersion, cc-by)
- SSRN Electronic Journal (submittedVersion)
- RePEc: Research Papers in Economics (submittedVersion)
- Apollo (University of Cambridge) (submittedVersion)
- Econstor (Econstor) (submittedVersion)
- Apollo
- Topics
- Social Sciences › Economics, Econometrics and Finance › Economics and Econometrics › Historical Economic and Social Studies
- Social Sciences › Economics, Econometrics and Finance › Economics and Econometrics › Economic Growth and Productivity
- Social Sciences › Demography › Insurance, Mortality, Demography, Risk Management
- Keywords
- historical population estimates, measurement error, regional disaggregation, historical demography
About these checks
Registry, retraction, Cites and statistics results are computed, not judged, with one exception: a printed reference that no index lists is read once by a model before it counts as a citation error. Claims are extracted by a model and kept only when their quote appears verbatim in the text; each cited source is then checked, with a model’s help, for whether it says what the claim relies on. Those verdicts can be wrong — read the claim’s quote and the cited source before relying on one.
A language model drew the claims from the paper on 2026-11-12, under version 3 of the claim definition (model deepseek-v4.1-flash, prompt extract-v3).
A second model labelled each claim on 2026-11-12 (model jev-1.13-20260917, definition revision gold-guideline-v0.2).
Statistics and arithmetic are recomputed, not judged.
Confidence bands are shown only for fields calibrated on our annotated test set. None is calibrated yet, so no band is shown.
What counts as a claim ›How we measure confidence ›How we check this ›
Are you an author, or do you see a problem with this page? Request a review
Data sources
Bibliographic data: Semantic Scholar, OpenAlex, Crossref.
Contains information from the Semantic Scholar Academic Graph Datasets, made available under the ODC Attribution License (ODC-BY 1.0).
Semantic Scholar’s data is described in: Kinney, R., et al. (2023). The Semantic Scholar Open Data Platform. arXiv:2301.10140.
