

The DOI matches its Crossref record; 38 of the 38 references it cites were found in a registry or an index.
Rapid Interpretation of Protein Backbone Rotation Dynamics Directly from Spin Relaxation Data
Open accessPublished version of a preprint
Abstract
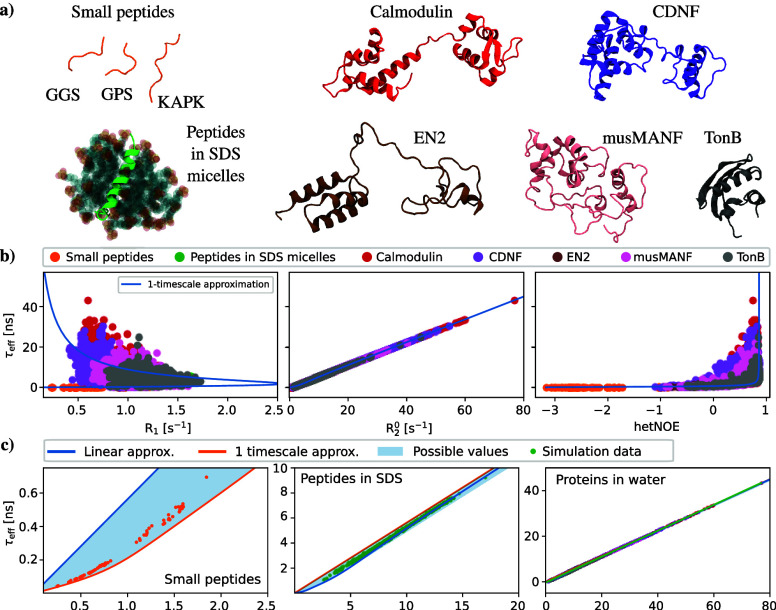
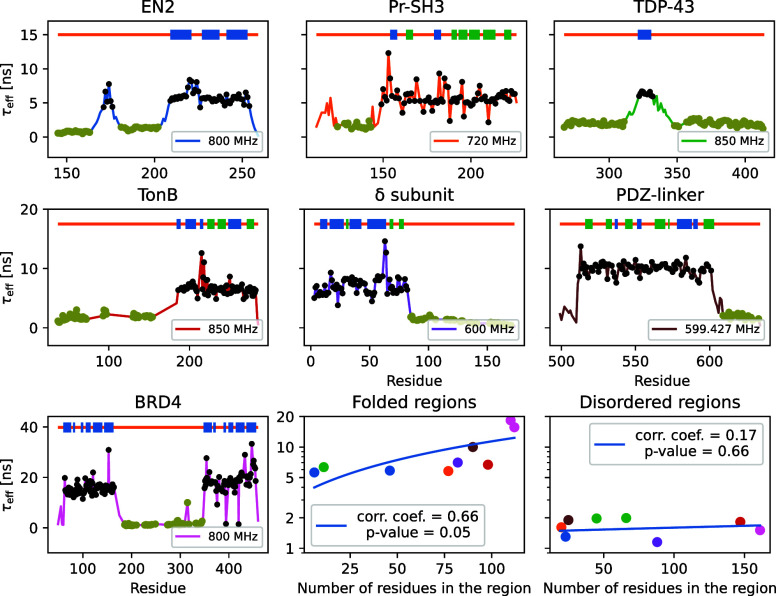
Besides structure, protein dynamics is pivotal for their functions, particularly for intrinsically disordered proteins (IDPs) that do not fold to a fixed 3D structure. Rapid rotations of chemical bonds in proteins can be detected measuring NMR spin relaxation rates, but interpretation of protein dynamics from the experimental data is arduous for IDPs or molecular assemblies with complex dynamic landscape. Here we demonstrate numerically that the total effective correlation times of protein backbone N-H bond rotations, τeff , can be calculated from experimentally measured transverse 15N spin relaxation rates, R2, using linear relation. Using molecular dynamics (MD) simulations, we show this for wide range of proteins, from short peptides to partially dis- ordered proteins and peptides in micelles. Significant practical advance of the result is demonstrated by interpreting dynamics of partially disordered proteins that are beyond the scope of current approaches to interpret spin relaxation rate experiments.
Overview
The claims and statistics of this paper haven’t been checked yet.
Run the check — free, no account needed. It reads the open-access text and checks the sources it cites.
Integrity signals
Registry
Cites
Statistics
Figures
Verification
Claims the paper makes
The claims and statistics of this paper haven’t been checked yet.
Run the check — free, no account needed. It reads the open-access text and checks the sources it cites.
Self-check
Percentages, sums and reported differences re-computed from the paper’s own numbers.
The self-check needs the paper’s full text.
Citations
Cites
Highly accurate protein structure prediction with AlphaFold
Jumper, J., Evans, R., Pritzel, A., Green, T., Figurnov, M., Ronneberger, O., Tunyasuvunakool, K., Bates, R., Žídek, A., Potapenko, A., et al. (2021) · Nature · doi:10.1038/s41586-021-03819-2 · Cited by 43,764
The Principles of Nuclear Magnetism
Abragam, A., & Hebel, L. C. (1961) · American Journal of Physics · doi:10.1119/1.1937646 · Cited by 15,792
Lipari, G., & Szabo, A. (1982) · Journal of the American Chemical Society · doi:10.1021/ja00381a009 · Cited by 3,777
Announcing the worldwide Protein Data Bank
Berman, H., Henrick, K., & Nakamura, H. (2003) · Nature Structural & Molecular Biology · doi:10.1038/nsb1203-980 · Cited by 3,093
Kay, L. E., Torchia, D. A., & Bax, A. (1989) · Biochemistry · doi:10.1021/bi00449a003 · Cited by 1,768
Conicella, A. E., Zerze, G. H., Mittal, J., & Fawzi, N. L. (2016) · Structure · doi:10.1016/j.str.2016.07.007 · Cited by 885
Xue, B., Dunker, A. K., & Uversky, V. N. (2012) · Journal of Biomolecular Structure and Dynamics · doi:10.1080/07391102.2012.675145 · Cited by 561
Jarymowycz, V. A., & Stone, M. J. (2006) · Chemical Reviews · doi:10.1021/cr040421p · Cited by 420
Mapping of spectral density functions using heteronuclear NMR relaxation measurements
Peng, J. W., & Wagner, G. (1992) · Journal of Magnetic Resonance (1969) · doi:10.1016/0022-2364(92)90135-t · Cited by 379
The Third IgG-Binding Domain from Streptococcal Protein G
Derrick, J. P., & Wigley, D. B. (1994) · Journal of Molecular Biology · doi:10.1006/jmbi.1994.1691 · Cited by 353
Research works printed but not linked: 1
- 10.26434/chemrxiv-2024-h3pmt · DOI
Metadata
- Authors
- Nencini, R., Mantzari, E., Sandelin, A. E., & Ollila, O. H. S.
- Affiliations
- University of Helsinki (FI)
- Corresponding author
- Ollila, O. H. Samuli
- Venue
- The Journal of Physical Chemistry Letters
- Publisher
- American Chemical Society (ACS)
- Published
- 2024-10-01
- Volume
- 15
- Issue
- 40
- Pages
- 10204-10209
- ISSN
- 1948-7185 (ISSN-L)
- PMC
- PMC11480883
- OpenAlex
- W4403018599
- Cited by
- 3
- References
- 38
- Citations by year
- 2026: 1 · 2025: 2
- FWCI
- 0.37
- Type
- journal article
- Language
- en
- Open access
- hybrid
- doi.org
- Licence
- Locations
- The Journal of Physical Chemistry Letters (publishedVersion, cc-by)
- ChemRxiv (acceptedVersion, cc-by)
- PubMed Central (publishedVersion, cc-by)
- PubMed (publishedVersion)
- Työväentutkimus Vuosikirja (submittedVersion)
- Funders
- Research Council of Finland (315596, 319902, 345631, 356568)
- Topics
- Physical Sciences › Chemistry › Spectroscopy › Advanced NMR Techniques and Applications
- Life Sciences › Biochemistry, Genetics and Molecular Biology › Molecular Biology › Protein Structure and Dynamics
- Physical Sciences › Chemistry › Spectroscopy › Electron Spin Resonance Studies
- Keywords
- backbone dynamics, intrinsically disordered proteins, 15N spin relaxation, transverse relaxation rate, peptide micelles
- MeSH terms
- Micelles, Peptides, Protein Conformation, Proteins, Rotation, Nuclear Magnetic Resonance, Biomolecular, Intrinsically Disordered Proteins
About these checks
Registry, retraction, Cites and statistics results are computed, not judged, with one exception: a printed reference that no index lists is read once by a model before it counts as a citation error. Claims are extracted by a model and kept only when their quote appears verbatim in the text; each cited source is then checked, with a model’s help, for whether it says what the claim relies on. Those verdicts can be wrong — read the claim’s quote and the cited source before relying on one.
Statistics and arithmetic are recomputed, not judged.
Confidence bands are shown only for fields calibrated on our annotated test set. None is calibrated yet, so no band is shown.
What counts as a claim ›How we measure confidence ›How we check this ›
Are you an author, or do you see a problem with this page? Request a review
How to cite
Cite CoChat for the checks on this page, and the paper for its own findings.
- This page
- CoChat. (2026). Citation check: Rapid Interpretation of Protein Backbone Rotation Dynamics Directly from Spin Relaxation Data. https://app.cochat.ai/papers/10.1021/acs.jpclett.4c01800
- The paper
- Nencini, R., Mantzari, E., Sandelin, A. E., & Ollila, O. H. S. (2024). Rapid Interpretation of Protein Backbone Rotation Dynamics Directly from Spin Relaxation Data. The Journal of Physical Chemistry Letters. https://doi.org/10.1021/acs.jpclett.4c01800
Data sources
Bibliographic data: Semantic Scholar, OpenAlex, Crossref.
Contains information from the Semantic Scholar Academic Graph Datasets, made available under the ODC Attribution License (ODC-BY 1.0).
Semantic Scholar’s data is described in: Kinney, R., et al. (2023). The Semantic Scholar Open Data Platform. arXiv:2301.10140.
