Cited by 7Protein Structure and DynamicsAmino Acid Enzymes and MetabolismPhysical Organic Chemistry and Reaction Kinetics

The DOI matches its Crossref record; 2 of the 2 references it cites were found in a registry or an index.

Unveiling the Catalytic Mechanism and Conformational Dynamics of Guinea Pig l -Asparaginase Type 1 for Leukemia Drug Design

Open access
Andjelkovic, Milorad, Zinovjev, Kirill, Ruiz-Pernía, Jose Javier, Tuñón, Iñaki·2025·ACS Catalysis

Published version of a preprint

Abstract

In this study, we present a computational analysis of the catalytic properties of guinea pig asparaginase type 1 (or gpASNase1), an enzyme of mammalian origin that offers a potential alternative for the treatment of acute lymphoblastic leukemia. This enzyme transforms asparagine into aspartate, depriving leukemia cells of this essential amino acid. A combination of molecular dynamics simulations, free energy calculations, and mechanistic insights based on quantum mechanics/molecular mechanics hybrid approaches was used to identify those residues contributing to the catalytic cycle of the enzyme. We dissected the contribution of enzymatic residues to substrate binding and selectivity, showing why this ASNase can degrade asparagine but not glutamine. We also studied the conformational dynamics of the enzymatic loop closing the active site, demonstrating that the substrate binding favors the closed state. The catalytic reaction mechanisms, composed of two stages, acylation and hydrolysis, were explored as well. The rate-limiting step presents a free energy barrier close to the experimental estimation and corresponds to the nucleophilic attack of enzymatic Thr19 on the carbonyl carbon atom of the substrate. Analysis of the electric field created by the protein sheds light on the role of certain residues and structural motifs in stabilizing the reaction transition state. The conclusions of this analysis are useful for rationalizing the properties of chimeras derived from gpASNase1 and predicting additional residue positions, where mutations could enhance substrate binding and loop dynamics. The results of this study enhance the understanding of gpASNase1, offering valuable insights into rational mutations and enzyme engineering for the treatment of leukemia.

Overview

The claims and statistics of this paper haven’t been checked yet.

Run the check — free, no account needed. It reads the open-access text and checks the sources it cites.

A few free checks a day · papers already verified open instantly · results are public

Integrity signals

Registry

Crossref · 10.1021/acscatal.4c07791

Cites

2 of 2 references verified0 citation errors · 0 not checkable

Statistics

Figures

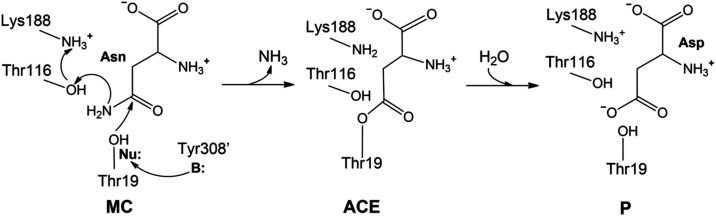
1 Proposed hydrolysis mechanism for gpASNase1. A nearby base (B:), Tyr308′, activates the nucleophilic residue Thr19 (Nu:) that attacks the substrate. The Lys188/Thr116 dyad protonates the leaving group substrate, forming an ammonia molecule. This leads to the covalent acyl-enzyme complex. In the second step, the product is formed (P) after the hydrolysis of this complex.
1 Proposed hydrolysis mechanism for gpASNase1. A nearby base (B:), Tyr308′, activates the nucleophilic residue Thr19 (Nu:) that attacks the substrate. The Lys188/Thr116 dyad protonates the leaving group substrate, forming an ammonia molecule. This leads to the covalent acyl-enzyme complex. In the second step, the product is formed (P) after the hydrolysis of this complex.CC BY · PubMed Central
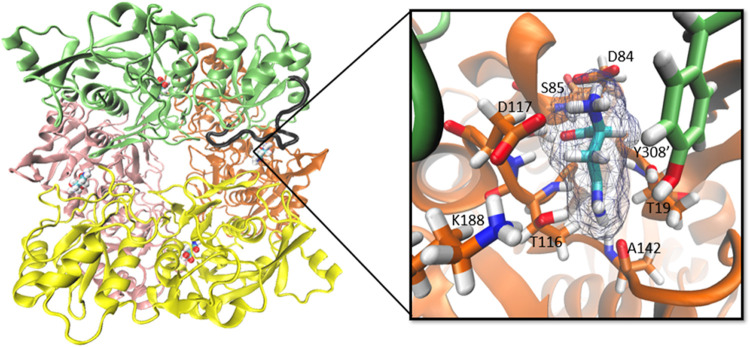
2 Homotetrameric structure of gpASNase1. Pink, green, orange, and yellow colors represent the four different monomers, forming a donut-like-shaped structure. Substrates in the four active sites are shown using a ball representation. One of the Tyr308′-flexible loops is represented in black color. On the right, a zoom in of one of the active sites is provided, representing the substrate and depicting some of the most important active site residues that are stabilizing the substrate in the active site. In this representation, we reverted the Thr19Ala mutation present in the X-ray structure (PDB code: 5DNC).
2 Homotetrameric structure of gpASNase1. Pink, green, orange, and yellow colors represent the four different monomers, forming a donut-like-shaped structure. Substrates in the four active sites are shown using a ball representation. One of the Tyr308′-flexible loops is represented in black color. On the right, a zoom in of one of the active sites is provided, representing the substrate and depicting some of the most important active site residues that are stabilizing the substrate in the active site. In this representation, we reverted the Thr19Ala mutation present in the X-ray structure (PDB code: 5DNC).CC BY · PubMed Central
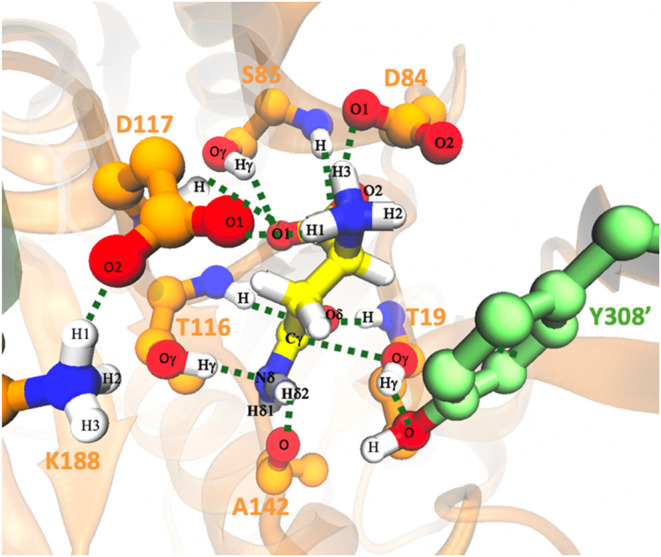
3 Active site of the Michaelis complex of gpASNase1 with the Asn substrate (yellow ball and sticks model) obtained from MD simulations with some important distances between the active site residues. Probability distributions of the distances shown here are given in Figure S5.
3 Active site of the Michaelis complex of gpASNase1 with the Asn substrate (yellow ball and sticks model) obtained from MD simulations with some important distances between the active site residues. Probability distributions of the distances shown here are given in Figure S5.CC BY · PubMed Central
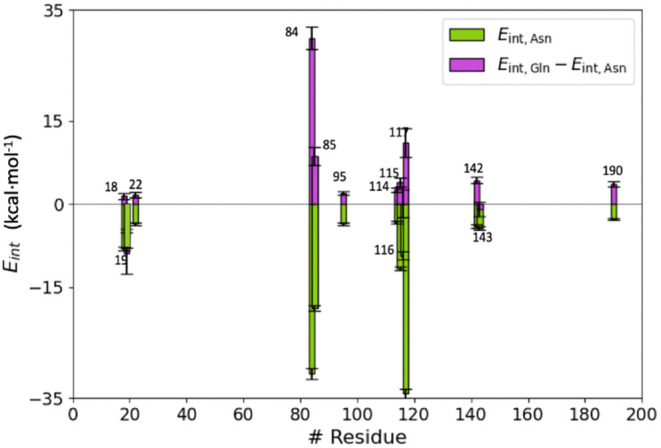
4 Individual average residue contributions to the interaction energy of Asn (E int,Asn shown with green histogram bars) and differential contribution to the binding of glutamine and asparagine (E int, Gln – E int, Asn displayed in purple). For simplicity, only residues with |E int, Asn| values larger than 2 kcal·mol–1 are shown. Free energy values are expressed in kcal·mol–1. Error bars are calculated as the standard deviation of the mean values.
4 Individual average residue contributions to the interaction energy of Asn (E int,Asn shown with green histogram bars) and differential contribution to the binding of glutamine and asparagine (E int, Gln – E int, Asn displayed in purple). For simplicity, only residues with |E int, Asn| values larger than 2 kcal·mol–1 are shown. Free energy values are expressed in kcal·mol–1. Error bars are calculated as the standard deviation of the mean values.CC BY · PubMed Central
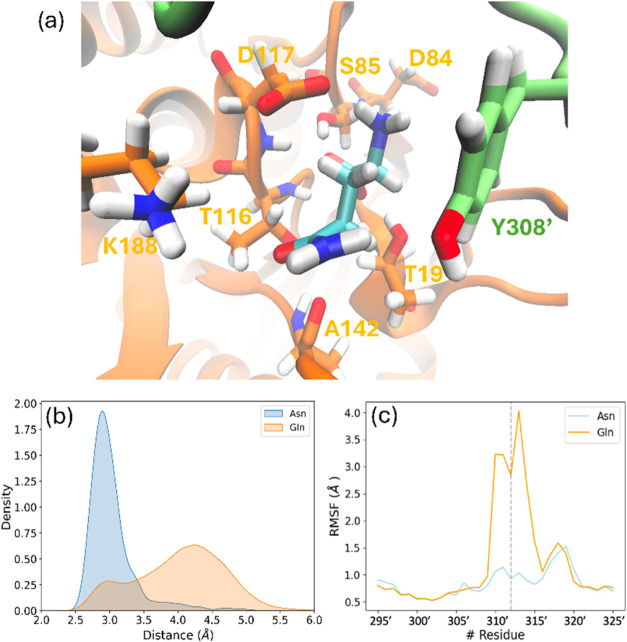
5 (a) Representation of the binding pose of Gln in the active site of gpASNase1 and some important residues whose contribution to the interaction energy has been found to change considerably with respect to Asn; (b) probability distribution of the Thr19–Tyr308′ distances during the 1 μs simulation in the case of Asn (blue) and Gln (orange) occupying the active site of gpASNase1; and (c) root-mean-square fluctuations of Cα atoms of the Tyr-loop residues in the case of Asn (blue) and Gln (orange) in the active site.
5 (a) Representation of the binding pose of Gln in the active site of gpASNase1 and some important residues whose contribution to the interaction energy has been found to change considerably with respect to Asn; (b) probability distribution of the Thr19–Tyr308′ distances during the 1 μs simulation in the case of Asn (blue) and Gln (orange) occupying the active site of gpASNase1; and (c) root-mean-square fluctuations of Cα atoms of the Tyr-loop residues in the case of Asn (blue) and Gln (orange) in the active site.CC BY · PubMed Central
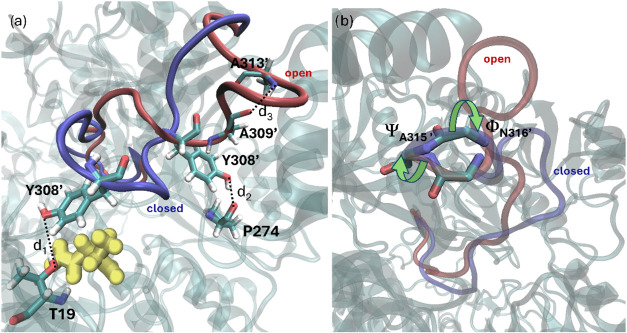
6 Open (red) and closed (blue) states of the Tyr-loop. (a) Residues Thr19, Pro274, Tyr308′, Ala309′, and Ala313′ are used to define the distances d1, d2, and d3 that differentiate the position of the loop in both states (d1 is the distance between Tyr308′Oγ and Thr19Oγ, d2 the distance between Tyr308′Oγ and Pro274Oγ and d3 the distance between Ala309′O and Ala313′N, describing the formation of a small a-helix-like turn motif in the open state). The substrate is represented with ball and stick models in yellow color. (b) Backbone torsions around the Ala315′–Asn316′ peptide bond that define the conformational state of the loop backbone in the closed and open states.
6 Open (red) and closed (blue) states of the Tyr-loop. (a) Residues Thr19, Pro274, Tyr308′, Ala309′, and Ala313′ are used to define the distances d1, d2, and d3 that differentiate the position of the loop in both states (d1 is the distance between Tyr308′Oγ and Thr19Oγ, d2 the distance between Tyr308′Oγ and Pro274Oγ and d3 the distance between Ala309′O and Ala313′N, describing the formation of a small a-helix-like turn motif in the open state). The substrate is represented with ball and stick models in yellow color. (b) Backbone torsions around the Ala315′–Asn316′ peptide bond that define the conformational state of the loop backbone in the closed and open states.CC BY · PubMed Central
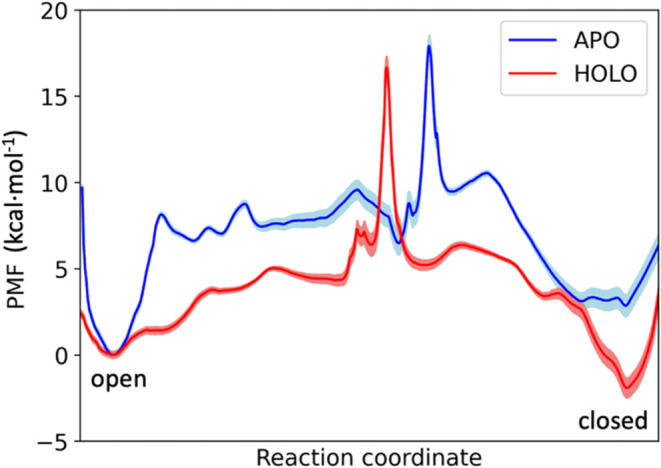
7 Free energy profiles of the Tyr-loop opening in the apo (blue line) and holo (red line) gpASNase1. The shaded region corresponds to the statistical uncertainty derived by bootstrapping.
7 Free energy profiles of the Tyr-loop opening in the apo (blue line) and holo (red line) gpASNase1. The shaded region corresponds to the statistical uncertainty derived by bootstrapping.CC BY · PubMed Central
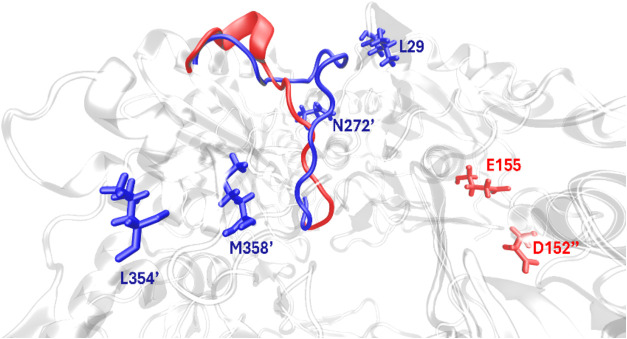
8 Residues contributing to the stabilization of the open (red color) and closed form (blue color) of the flexible Tyr-loop. Residues with contributions to the absolute interaction energies larger than 15 kcal·mol–1 stabilizing the open form of the Tyr-loop are represented in red, while those stabilizing the closed state are given in blue color.
8 Residues contributing to the stabilization of the open (red color) and closed form (blue color) of the flexible Tyr-loop. Residues with contributions to the absolute interaction energies larger than 15 kcal·mol–1 stabilizing the open form of the Tyr-loop are represented in red, while those stabilizing the closed state are given in blue color.CC BY · PubMed Central
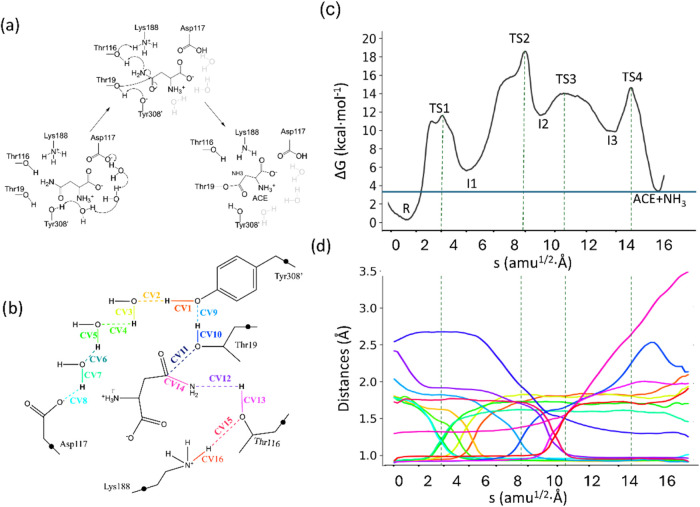
9 (a) Acylation mechanism in gpASNase1. (b) Representation of the QM region and CVs used to obtain the MFEP. Black dots represent link atoms; (c) Free energy profile along the path-CV (s) obtained at the B3LYPD3/6-31G­(d)/MM level of theory; (d) Evolution of the distances selected as collective variables along the MFEP. The color code corresponds to those used in panel (b). Dashed light-gray lines indicate the position of the transition states.
9 (a) Acylation mechanism in gpASNase1. (b) Representation of the QM region and CVs used to obtain the MFEP. Black dots represent link atoms; (c) Free energy profile along the path-CV (s) obtained at the B3LYPD3/6-31G­(d)/MM level of theory; (d) Evolution of the distances selected as collective variables along the MFEP. The color code corresponds to those used in panel (b). Dashed light-gray lines indicate the position of the transition states.CC BY · PubMed Central
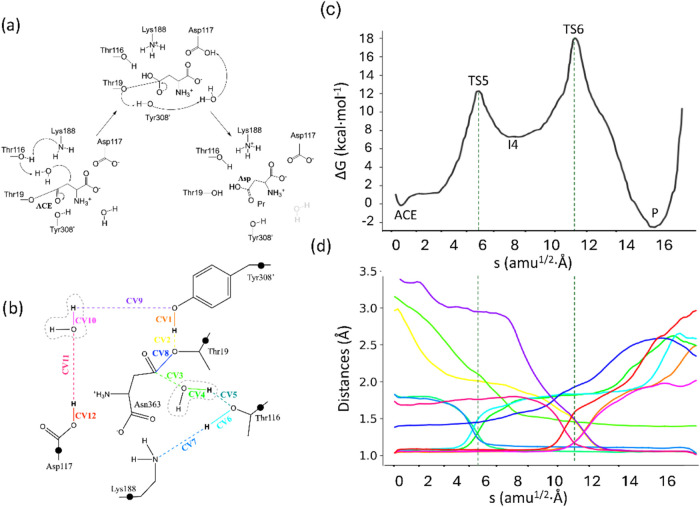
10 (a) Acyl-enzyme hydrolysis reaction mechanism in gpASNase1; (b) representation of the QM region and CVs used to obtain the MFEP. The black dots represent the link atoms; (c) free energy profile along the path-CV (s) obtained at the B3LYPD3/6-31G­(d)/MM level of theory; and (d) evolution of the distances selected as collective variables along the MFEP. The color code corresponds to that represented in panel (b). Dotted light-gray lines indicate the position of the transition states.
10 (a) Acyl-enzyme hydrolysis reaction mechanism in gpASNase1; (b) representation of the QM region and CVs used to obtain the MFEP. The black dots represent the link atoms; (c) free energy profile along the path-CV (s) obtained at the B3LYPD3/6-31G­(d)/MM level of theory; and (d) evolution of the distances selected as collective variables along the MFEP. The color code corresponds to that represented in panel (b). Dotted light-gray lines indicate the position of the transition states.CC BY · PubMed Central
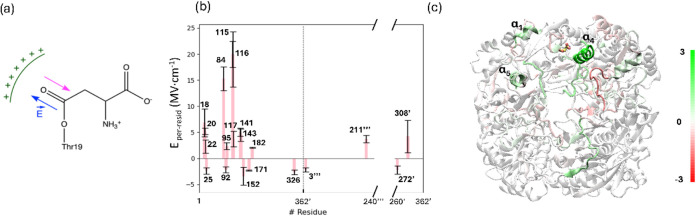
11 Decomposition of the electric field along the CO bond of the substrate in the acyl-enzyme state. (a) Schematic representation of the electric field that promotes the transfer of the negative charge from the carbonyl group of the substrate toward the oxygen atom. (b) The values of the projected electric field per residue. Only residues with a contribution larger in absolute value than 2 MV·cm–1 are shown. Residues of the adjacent protomer (chain D) are labeled with prime, whereas residues of chain B and chain C are labeled with two and three primes, respectively. Standard errors were calculated as the standard deviation of the mean; (c) Per-motif contribution to the projected electric field for the entire tetrameric gpASNase1 (Color scale units in MV·cm–1).
11 Decomposition of the electric field along the CO bond of the substrate in the acyl-enzyme state. (a) Schematic representation of the electric field that promotes the transfer of the negative charge from the carbonyl group of the substrate toward the oxygen atom. (b) The values of the projected electric field per residue. Only residues with a contribution larger in absolute value than 2 MV·cm–1 are shown. Residues of the adjacent protomer (chain D) are labeled with prime, whereas residues of chain B and chain C are labeled with two and three primes, respectively. Standard errors were calculated as the standard deviation of the mean; (c) Per-motif contribution to the projected electric field for the entire tetrameric gpASNase1 (Color scale units in MV·cm–1).CC BY · PubMed Central
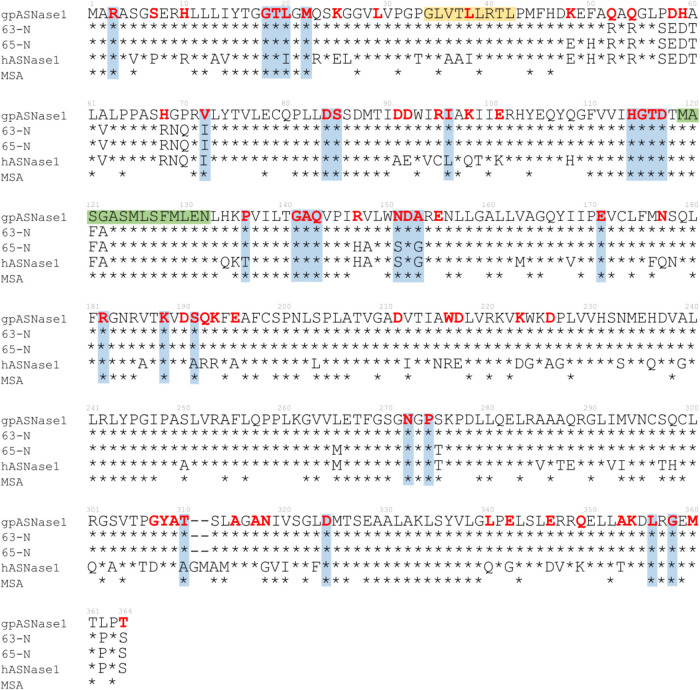
12 Sequence alignment of the N-terminal domain of gpASNase1, two chimeras (63-N and 65-N), and hASNase1. The result of the MSA presented in this figure includes only the top 45–55% of highly conserved residues preserved in gpASNase1, each marked with an asterisk. gpASNase1 residues identified to have important contributions to binding, loop closing, or electrostatic catalysis are highlighted in red bold letters. Those residues that coincide with the results of MSAs are shaded light blue, while yellow and green bars correspond to the α1 and α4 structural motifs.
12 Sequence alignment of the N-terminal domain of gpASNase1, two chimeras (63-N and 65-N), and hASNase1. The result of the MSA presented in this figure includes only the top 45–55% of highly conserved residues preserved in gpASNase1, each marked with an asterisk. gpASNase1 residues identified to have important contributions to binding, loop closing, or electrostatic catalysis are highlighted in red bold letters. Those residues that coincide with the results of MSAs are shaded light blue, while yellow and green bars correspond to the α1 and α4 structural motifs.CC BY · PubMed Central

Verification

Claims the paper makes

The claims and statistics of this paper haven’t been checked yet.

Run the check — free, no account needed. It reads the open-access text and checks the sources it cites.

A few free checks a day · papers already verified open instantly · results are public

Self-check

Percentages, sums and reported differences re-computed from the paper’s own numbers.

The self-check needs the paper’s full text.

Citations

Cites

Show all 2 references

Research works printed but not linked: 49

  1. 10.1084/jem.118.1.99 · DOI
  2. 10.1146/annurev.biochem.75.103004.142520 · DOI
  3. 10.1007/s11274-019-2731-9 · DOI
  4. 10.1182/blood.V99.8.2734 · DOI
  5. 10.1007/s00280-017-3492-5 · DOI
  6. 10.1021/ja310165u · DOI
  7. 10.1021/acs.jcim.2c01122 · DOI
  8. 10.3390/pharmaceutics14030599 · DOI
  9. 10.1021/bi0029595 · DOI
  10. 10.1016/S0021-9258(18)62984-9 · DOI
  11. 10.1200/JCO.2001.19.9.2390 · DOI
  12. 10.1200/JCO.2012.43.2070 · DOI
  13. 10.1021/bi401692v · DOI
  14. 10.1021/bi300870g · DOI
  15. 10.1021/acs.jcim.3c00900 · DOI
  16. 10.1016/j.chembiol.2013.03.006 · DOI
  17. 10.1074/jbc.M113.545038 · DOI
  18. 10.1038/s41598-017-10758-4 · DOI
  19. 10.1074/jbc.M114.609552 · DOI
  20. 10.1074/jbc.M115.699884 · DOI
  21. 10.1021/acs.biochem.0c00116 · DOI
  22. 10.1182/blood-2013-10-535112 · DOI
  23. 10.1021/acs.biochem.5b01351 · DOI
  24. 10.1016/j.mehy.2018.01.004 · DOI
  25. 10.1021/ct100578z · DOI
  26. 10.1007/s00894-014-2478-z · DOI
  27. 10.1021/acs.jctc.5b00255 · DOI
  28. 10.1021/j100142a004 · DOI
  29. 10.1063/1.445869 · DOI
  30. 10.1002/jcc.540130805 · DOI
  31. 10.1063/1.464397 · DOI
  32. 10.1002/jcc.26873 · DOI
  33. 10.1021/acsomega.9b04233 · DOI
  34. 10.1021/acs.jpca.7b10842 · DOI
  35. 10.1038/s41467-024-46723-9 · DOI
  36. 10.1021/ct300418h · DOI
  37. 10.1016/S0022-2836(03)00610-7 · DOI
  38. 10.1021/bi400215w · DOI
  39. 10.1063/1.464913 · DOI · Paper page
  40. 10.1103/PhysRevB.37.785 · DOI · Paper page
  41. 10.1063/1.3382344 · DOI · Paper page
  42. 10.1021/acs.jctc.8b01176 · DOI
  43. 10.1021/ct100684s · DOI
  44. 10.1021/acs.jcim.1c00794 · DOI
  45. 10.1021/jz501780a · DOI
  46. Hanson K. R., 1972, The Enzymes, 7, 75
  47. 10.1021/acscatal.3c05302 · DOI
  48. 10.1101/2025.01.18.633707v1 · DOI
  49. 10.1182/blood-2014-03-563742 · DOI

Metadata

Authors
Andjelkovic, M., Zinovjev, K., Ruiz-Pernía, J. J., & Tuñón, I.
Affiliations
  • Universitat Jaume I (ES)
  • Universitat de València (ES)
  • Departamento de Química Física
Corresponding author
Tuñón, Iñaki
Venue
ACS Catalysis
Published
2025-04-29
Volume
15
Issue
10
Pages
7919-7933
ISSN
2155-5435 (ISSN-L)
OpenAlex
W4409921793
Cited by
7
References
2
Citations by year
2026: 5 · 2025: 2
FWCI
2.10
Type
journal article
Language
en
Open access
Locations
  • ACS Catalysis (publishedVersion, cc-by)
  • ChemRxiv (acceptedVersion, cc-by-nc)
  • PubMed Central (publishedVersion, cc-by)
  • PubMed (publishedVersion)
  • Repository of Digital Objects for Teaching Research and Culture (University of Valencia) (submittedVersion, cc-by-nc)
Funders
  • Ministerio de Ciencia, Innovaci?n y Universidades
  • Agencia Estatal de Investigaci?n (PID2021-123332OB-C22)
  • European Regional Development Fund
  • 'la Caixa' Foundation (100010434, LCF/BQ/DR21/11880026)
  • Conselleria de Cultura, Educaci?n y Ciencia, Generalitat Valenciana (CIPROM/2021/079)
Topics
  • Life Sciences › Biochemistry, Genetics and Molecular Biology › Molecular Biology › Protein Structure and Dynamics
  • Life Sciences › Biochemistry, Genetics and Molecular Biology › Biochemistry › Amino Acid Enzymes and Metabolism
  • Physical Sciences › Chemistry › Organic Chemistry › Physical Organic Chemistry and Reaction Kinetics
Keywords
catalytic mechanism, conformational dynamics, acute lymphoblastic leukemia, substrate binding, substrate specificity, acylation, hydrolysis, transition state stabilization, active site loop, enzyme engineering, chimeric enzymes, quantum mechanics/molecular mechanics

About these checks

Registry, retraction, Cites and statistics results are computed, not judged, with one exception: a printed reference that no index lists is read once by a model before it counts as a citation error. Claims are extracted by a model and kept only when their quote appears verbatim in the text; each cited source is then checked, with a model’s help, for whether it says what the claim relies on. Those verdicts can be wrong — read the claim’s quote and the cited source before relying on one.

Statistics and arithmetic are recomputed, not judged.

Confidence bands are shown only for fields calibrated on our annotated test set. None is calibrated yet, so no band is shown.

What counts as a claim ›How we measure confidence ›How we check this ›

Are you an author, or do you see a problem with this page? Request a review

How to cite

Cite CoChat for the checks on this page, and the paper for its own findings.

This page
CoChat. (2026). Citation check: Unveiling the Catalytic Mechanism and Conformational Dynamics of Guinea Pig l -Asparaginase Type 1 for Leukemia Drug Design. https://app.cochat.ai/papers/10.1021/acscatal.4c07791
The paper
Andjelkovic, M., Zinovjev, K., Ruiz-Pernía, J. J., & Tuñón, I. (2025). Unveiling the Catalytic Mechanism and Conformational Dynamics of Guinea Pig l -Asparaginase Type 1 for Leukemia Drug Design. ACS Catalysis. https://doi.org/10.1021/acscatal.4c07791