Cited by 126

The DOI matches its Crossref record; 3 of the 3 references it cites were found in a registry or an index.

A Self-Cascade Penetrating Brain Tumor Immunotherapy Mediated by Near-Infrared II Cell Membrane-Disrupting Nanoflakes via Detained Dendritic Cells

Yalamandala, Bhanu Nirosha, Chen, Yu-Jen, Lin, Ya-Hui, Huynh, Thi My Hue, Chiang, Wen-Hsuan, Chou, Tsu-Chin, Liu, Heng-Wei, Huang, Chieh-Cheng, Lu, Yu-Jen, Chiang, Chi-Shiun, Chu, Li-An, Hu, Shang-Hsiu·2024·ACS Nano

Overview

The claims and statistics of this paper haven’t been checked yet.

Run the check — free, no account needed. It reads the open-access text and checks the sources it cites.

A few free checks a day · papers already verified open instantly · results are public

Integrity signals

Registry

Crossref · 10.1021/acsnano.4c06183

Cites

3 of 3 references verified0 citation errors · 0 not checkable

Statistics

Figures

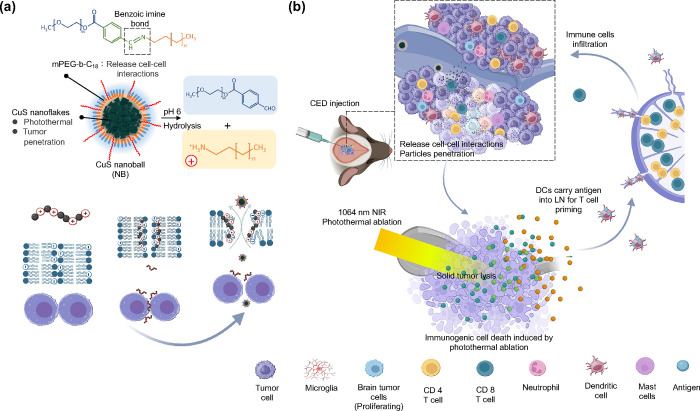
Figure 1 Schematic illustration of preparation and features of the CuS nanoball (NB) composed of membrane-disrupted polymer-wrapped CuS nanoflakes for brain immunotherapy. (a) The disruption of the benzoic-imine bond in mPEG-b-C18 on CuS NB enhances tumor permeability, reaching deep brain tumors by releasing cell–cell interactions under weak acidic conditions. (b) CuS NB is efficiently accumulated in brain tumors through continuous positive pressure infusion of CED. Membrane disruption-mediated tumor penetration and low-power NIR II irradiation (0.8 W/cm2) resulted in CuS nanoflakes generating intense NIR II-generated heat deep within the tumor, promoting antigen release. This process preserves autologous tumor-associated antigens and presents them to dendritic cells, amplifying CD4+ and CD8+ T cell-mediated immune responses.
Figure 1 Schematic illustration of preparation and features of the CuS nanoball (NB) composed of membrane-disrupted polymer-wrapped CuS nanoflakes for brain immunotherapy. (a) The disruption of the benzoic-imine bond in mPEG-b-C18 on CuS NB enhances tumor permeability, reaching deep brain tumors by releasing cell–cell interactions under weak acidic conditions. (b) CuS NB is efficiently accumulated in brain tumors through continuous positive pressure infusion of CED. Membrane disruption-mediated tumor penetration and low-power NIR II irradiation (0.8 W/cm2) resulted in CuS nanoflakes generating intense NIR II-generated heat deep within the tumor, promoting antigen release. This process preserves autologous tumor-associated antigens and presents them to dendritic cells, amplifying CD4+ and CD8+ T cell-mediated immune responses.CC BY · PubMed Central
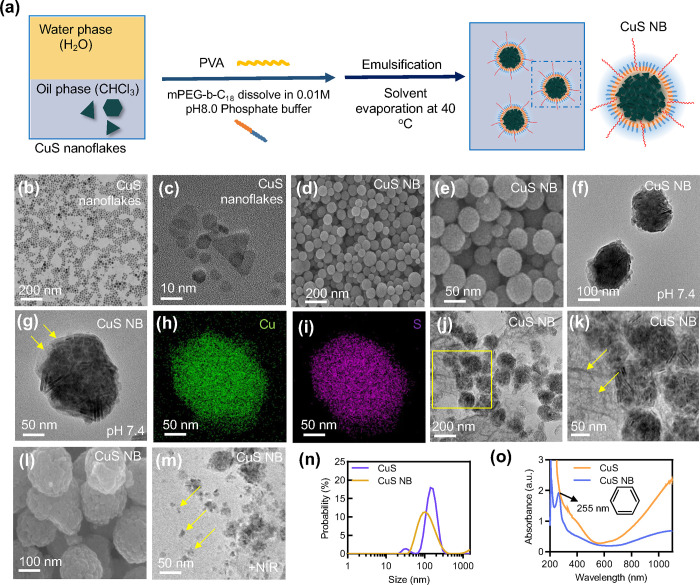
Figure 2 Synthesis and characterizations of CuS NB (mPEG-b-C18@CuS). (a) Schematic representation showing the synthesis of CuS nanoballs composed of a hydrophilic methoxy poly(ethylene glycol) (mPEG) moiety and a hydrophobic octadecane chain (C18) with a pH-sensitive benzoic-imine linker. (b,c) TEM images of CuS nanoflakes. (d,e) SEM and (f,g) TEM images of CuS NBs. (h,i) Elemental mapping analysis of CuS NB. (j–l) SEM and TEM images of CuS NB at pH 6. (m) TEM images of CuS NB after NIR irradiation. (n) UV–visible spectrum of CuS nanoflakes and CuS NB. (o) Size distribution of CuS nanoflakes and CuS NB.
Figure 2 Synthesis and characterizations of CuS NB (mPEG-b-C18@CuS). (a) Schematic representation showing the synthesis of CuS nanoballs composed of a hydrophilic methoxy poly(ethylene glycol) (mPEG) moiety and a hydrophobic octadecane chain (C18) with a pH-sensitive benzoic-imine linker. (b,c) TEM images of CuS nanoflakes. (d,e) SEM and (f,g) TEM images of CuS NBs. (h,i) Elemental mapping analysis of CuS NB. (j–l) SEM and TEM images of CuS NB at pH 6. (m) TEM images of CuS NB after NIR irradiation. (n) UV–visible spectrum of CuS nanoflakes and CuS NB. (o) Size distribution of CuS nanoflakes and CuS NB.CC BY · PubMed Central
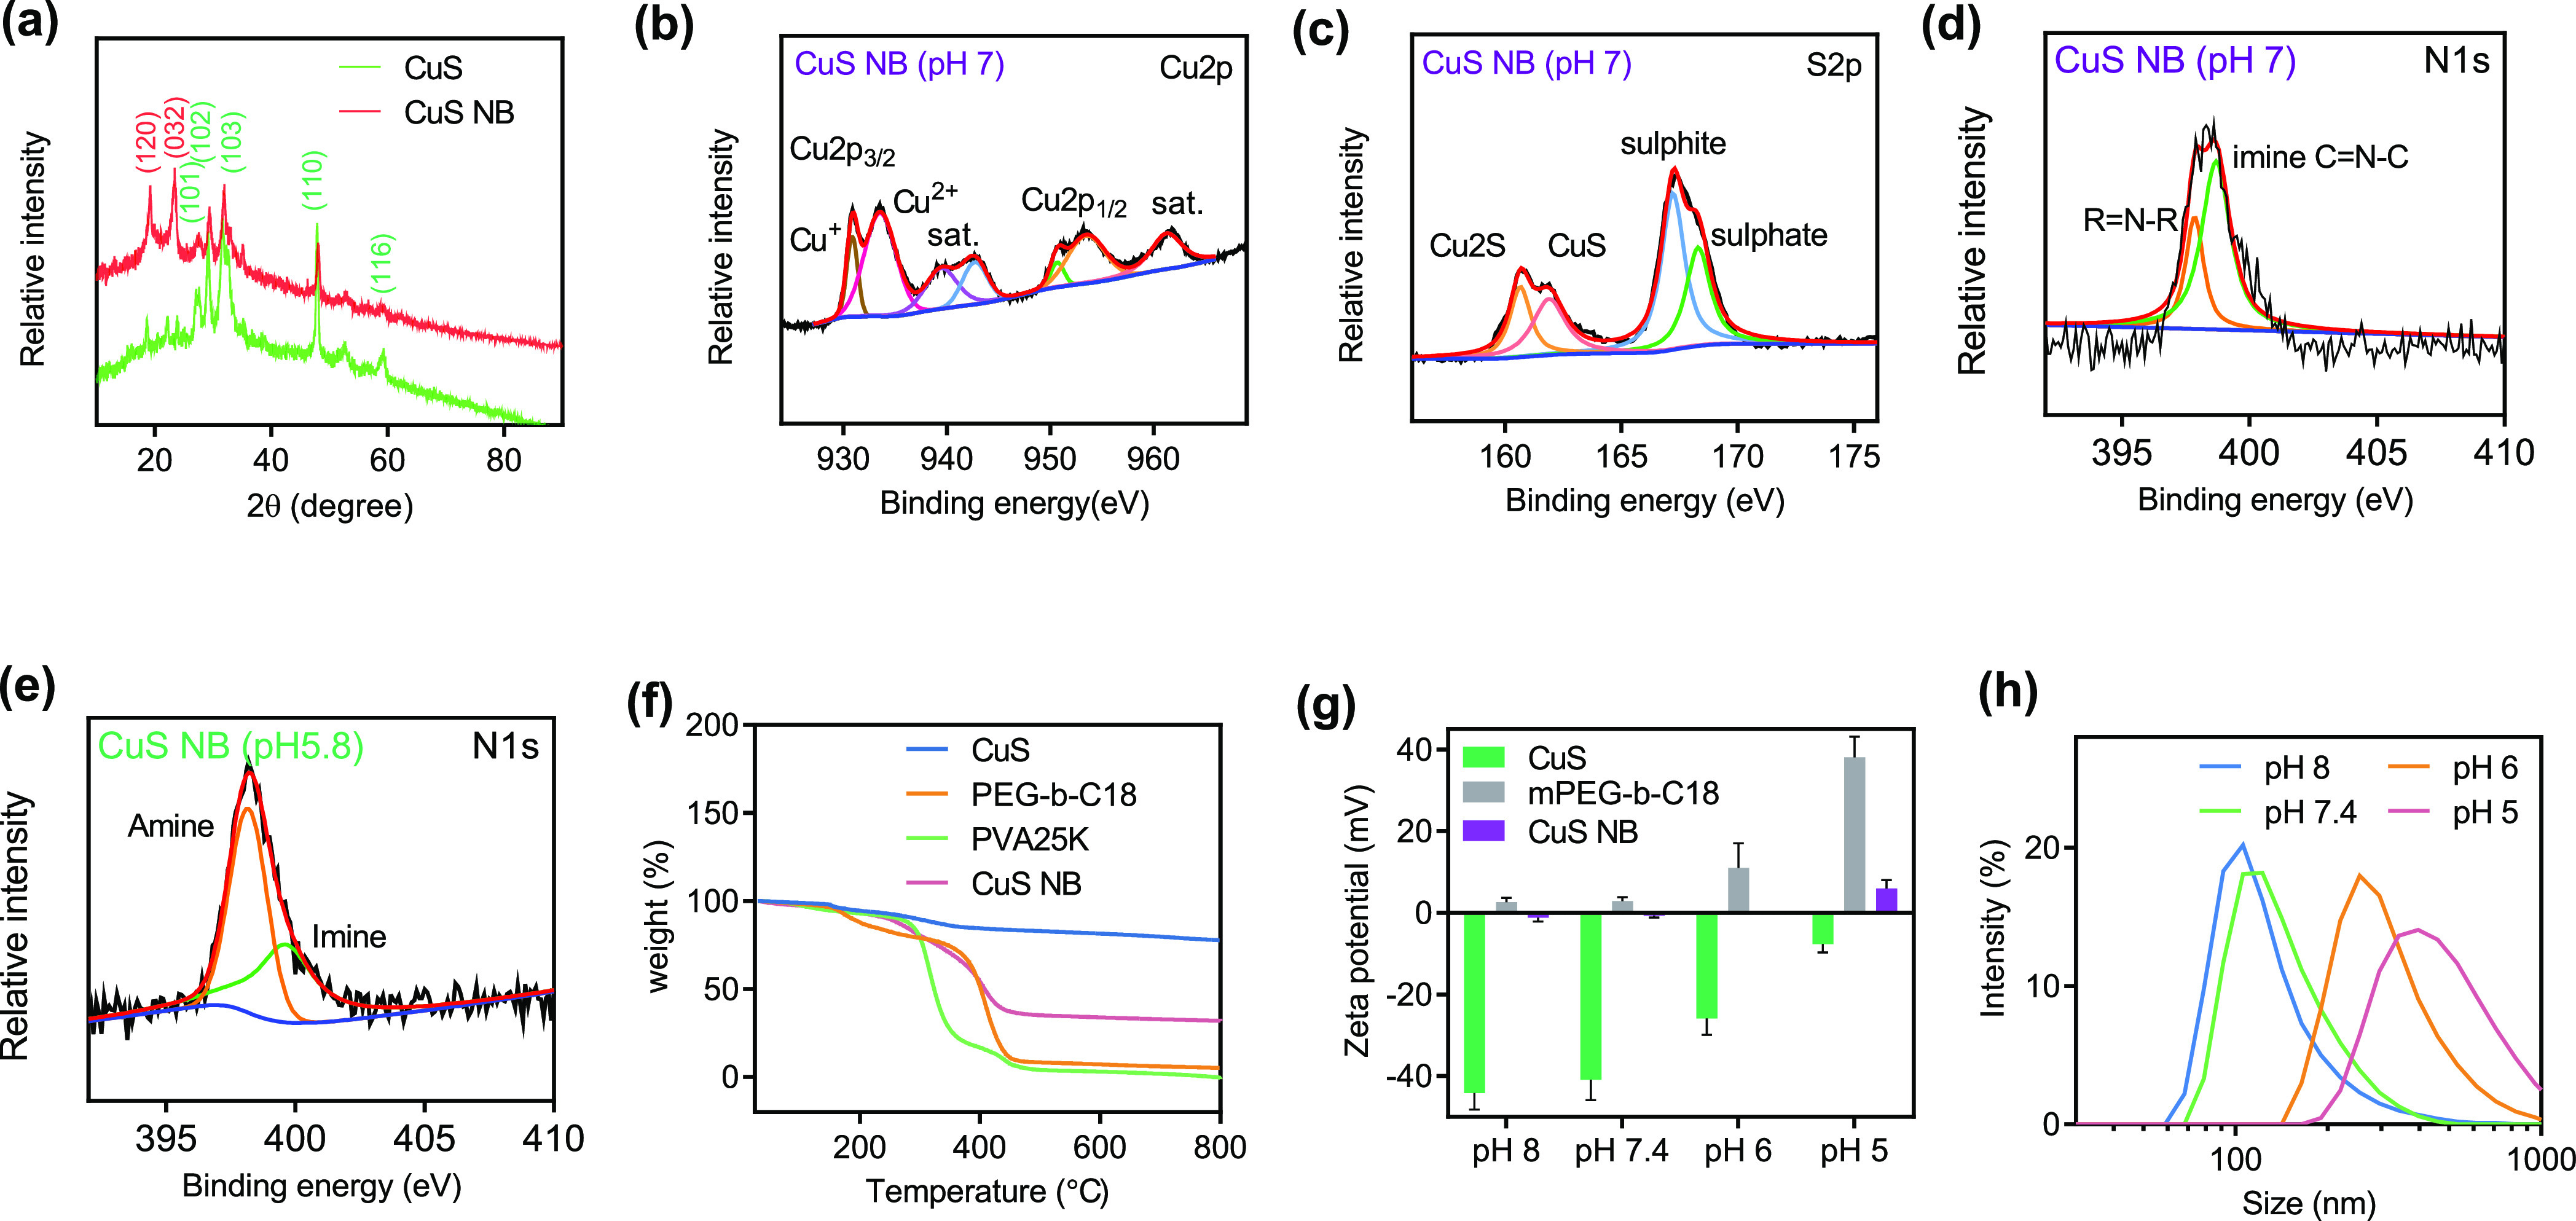
Figure 3 Physicochemical characterization of CuS NB. (a) XRD spectra of CuS nanoflakes and CuS NB. (b–d) XPS spectra of all the elements, Cu 2p, S 2p, and N 1s spectra of CuS nanoballs. (e) XPS N 1s spectra of CuS nanoballs at pH 5.8. (f) TGA analysis of CuS nanoflakes, CuS nanoballs, PVA25K, and mPEG-b-C18. (g) Zeta potential and (h) size distribution of CuS nanoballs under various conditions.
Figure 3 Physicochemical characterization of CuS NB. (a) XRD spectra of CuS nanoflakes and CuS NB. (b–d) XPS spectra of all the elements, Cu 2p, S 2p, and N 1s spectra of CuS nanoballs. (e) XPS N 1s spectra of CuS nanoballs at pH 5.8. (f) TGA analysis of CuS nanoflakes, CuS nanoballs, PVA25K, and mPEG-b-C18. (g) Zeta potential and (h) size distribution of CuS nanoballs under various conditions.CC BY · PubMed Central
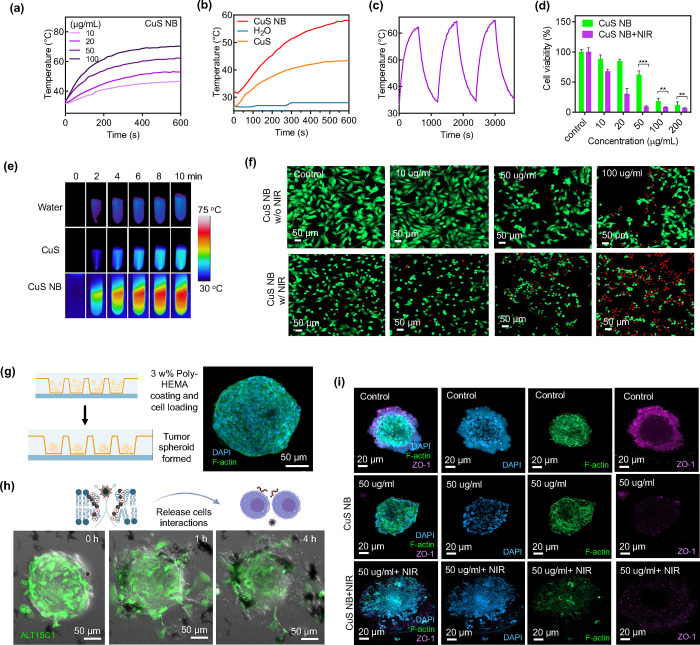
Figure 4 Photothermal conversion and in vitro study. (a) Thermal heating profiles of CuS NB at various concentrations. (b) Thermal heating profiles of CuS nanoflakes and CuS NB. (c) Photothermal conversion test. (d) Cell viability of ALTS1C1 treated with CuS NB and CuS NB+NIR. (e) Infrared thermal imaging of water, CuS, and CuS nanoballs (n = 4; mean ± s.d.; **p < 0.01; ***p < 0.05; one-way ANOVA with Tukey’s multiple-comparison tests). (f) CLSM images of live/dead staining of ALTS1C1 cells with or without NIR irradiation at different concentrations of CuS NB. (g) Schematic representation of 3D tumor spheroid formation. (h) CLSM images of the ALTS1C1-GFP tumor spheroid cocultured with 100 μg mL–1 CuS nanoballs over time. (i) CLSM images depicting ALTS1C1 tumor spheroids subjected to various treatments. Cell nuclei, cytoskeleton, and ZO-1 were visualized through staining with DAPI (blue), F-actin (green), and a primary antibody (violet).
Figure 4 Photothermal conversion and in vitro study. (a) Thermal heating profiles of CuS NB at various concentrations. (b) Thermal heating profiles of CuS nanoflakes and CuS NB. (c) Photothermal conversion test. (d) Cell viability of ALTS1C1 treated with CuS NB and CuS NB+NIR. (e) Infrared thermal imaging of water, CuS, and CuS nanoballs (n = 4; mean ± s.d.; **p < 0.01; ***p < 0.05; one-way ANOVA with Tukey’s multiple-comparison tests). (f) CLSM images of live/dead staining of ALTS1C1 cells with or without NIR irradiation at different concentrations of CuS NB. (g) Schematic representation of 3D tumor spheroid formation. (h) CLSM images of the ALTS1C1-GFP tumor spheroid cocultured with 100 μg mL–1 CuS nanoballs over time. (i) CLSM images depicting ALTS1C1 tumor spheroids subjected to various treatments. Cell nuclei, cytoskeleton, and ZO-1 were visualized through staining with DAPI (blue), F-actin (green), and a primary antibody (violet).CC BY · PubMed Central
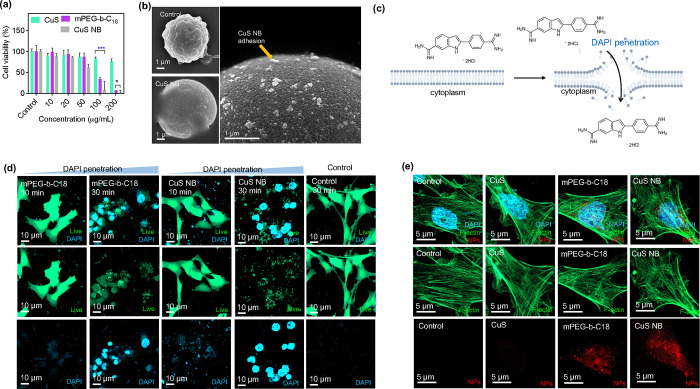
Figure 5 Cellular membrane leakage and cell uptake. (a) Cell viability of ALTS1C1 treated with CuS nanoflakes, mPEG-b-C18, and CuS nanoballs at various concentrations (n = 4; mean ± s. d.; *p < 0.05; ***p < 0.05; one-way ANOVA with Tukey’s multiple-comparison test). (b) SEM images of ALTS1C1 cells treated by CuS NB. (c) Graphical representation of cell membrane impermeability. (d) Examination of membrane disruption in CuS nanoballs at varying concentrations using DAPI staining visualization and a LIVE cytotoxicity kit for assessing membrane disruption indicators and cell morphology, respectively. (e) Concentration-dependent cellular uptake of CuS nanoflakes, mPEG-b-C18 micelles, and CuS NB. The cell nucleus, cytoskeleton, and CuS nanoballs were stained with DAPI (blue), F-actin (green), and cy5.5 (red), respectively.
Figure 5 Cellular membrane leakage and cell uptake. (a) Cell viability of ALTS1C1 treated with CuS nanoflakes, mPEG-b-C18, and CuS nanoballs at various concentrations (n = 4; mean ± s. d.; *p < 0.05; ***p < 0.05; one-way ANOVA with Tukey’s multiple-comparison test). (b) SEM images of ALTS1C1 cells treated by CuS NB. (c) Graphical representation of cell membrane impermeability. (d) Examination of membrane disruption in CuS nanoballs at varying concentrations using DAPI staining visualization and a LIVE cytotoxicity kit for assessing membrane disruption indicators and cell morphology, respectively. (e) Concentration-dependent cellular uptake of CuS nanoflakes, mPEG-b-C18 micelles, and CuS NB. The cell nucleus, cytoskeleton, and CuS nanoballs were stained with DAPI (blue), F-actin (green), and cy5.5 (red), respectively.CC BY · PubMed Central
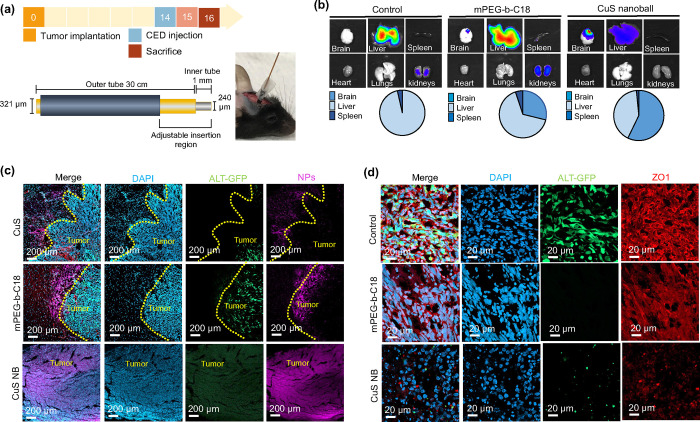
Figure 6 CED and in vivo study. (a) CED device design and in vivo treatment schedule. (b) In vivo IVIS organ biodistribution images of control, mPEG-b-C18 micelle-, and CuS NB-treated mice at 48 h post-treatment. (c) CLSM images of brain tumor slices treated by CuS nanoflakes, mPEG-b-C18 micelles, and CuS NB. (d) CLSM images of brain slices showing the expression of ZO-1 after various treatments.
Figure 6 CED and in vivo study. (a) CED device design and in vivo treatment schedule. (b) In vivo IVIS organ biodistribution images of control, mPEG-b-C18 micelle-, and CuS NB-treated mice at 48 h post-treatment. (c) CLSM images of brain tumor slices treated by CuS nanoflakes, mPEG-b-C18 micelles, and CuS NB. (d) CLSM images of brain slices showing the expression of ZO-1 after various treatments.CC BY · PubMed Central
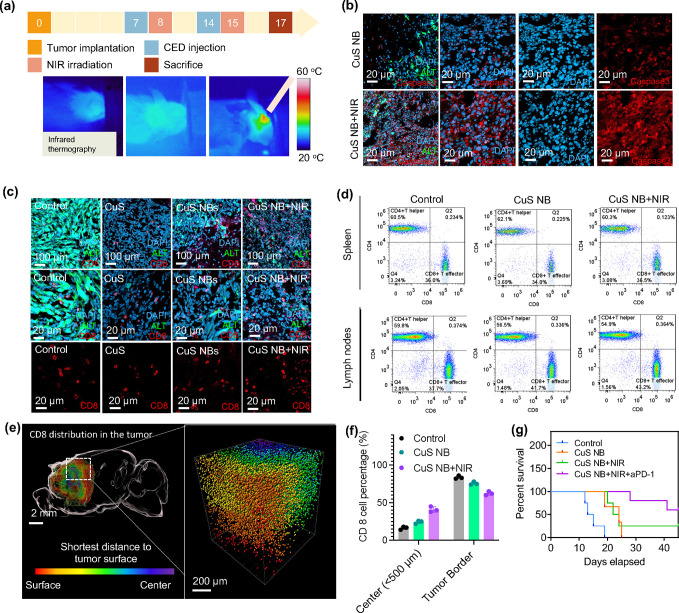
Figure 7 In vivo study and immune responses. (a) Treatment schedules and infrared thermal imaging of mice treated with CuS nanoballs via CED and subsequent NIR irradiation on the following day. (b) CLSM images depicting caspase 3 expression in brain tumors following treatment with CuS nanoballs, with and without NIR irradiation. (c) CLSM images of brain slices showing the expression of CD4+ and CD8+ after various treatments. (d) In vivo flow cytometry analysis of the spleen and LN tissue dissected 24 h post-treatment by CuS NB and CuS NB+NIR. (e) Reconstructed 3D images of the entire brains of mice bearing GFP-expressing ALTS1C1 tumors treated with CuS nanoballs and NIR. GFP-expressing ALTS1C1 cells are represented in purple, while CD8-expressing T cells are depicted in white. (f) Quantification of CD8+ cells at brain tumors. (g) Survival curves of mice after treatment with control, CuS NB, CuS NB+NIR, and CuS NB+NIR+aPD-1 (n = 6).
Figure 7 In vivo study and immune responses. (a) Treatment schedules and infrared thermal imaging of mice treated with CuS nanoballs via CED and subsequent NIR irradiation on the following day. (b) CLSM images depicting caspase 3 expression in brain tumors following treatment with CuS nanoballs, with and without NIR irradiation. (c) CLSM images of brain slices showing the expression of CD4+ and CD8+ after various treatments. (d) In vivo flow cytometry analysis of the spleen and LN tissue dissected 24 h post-treatment by CuS NB and CuS NB+NIR. (e) Reconstructed 3D images of the entire brains of mice bearing GFP-expressing ALTS1C1 tumors treated with CuS nanoballs and NIR. GFP-expressing ALTS1C1 cells are represented in purple, while CD8-expressing T cells are depicted in white. (f) Quantification of CD8+ cells at brain tumors. (g) Survival curves of mice after treatment with control, CuS NB, CuS NB+NIR, and CuS NB+NIR+aPD-1 (n = 6).CC BY · PubMed Central
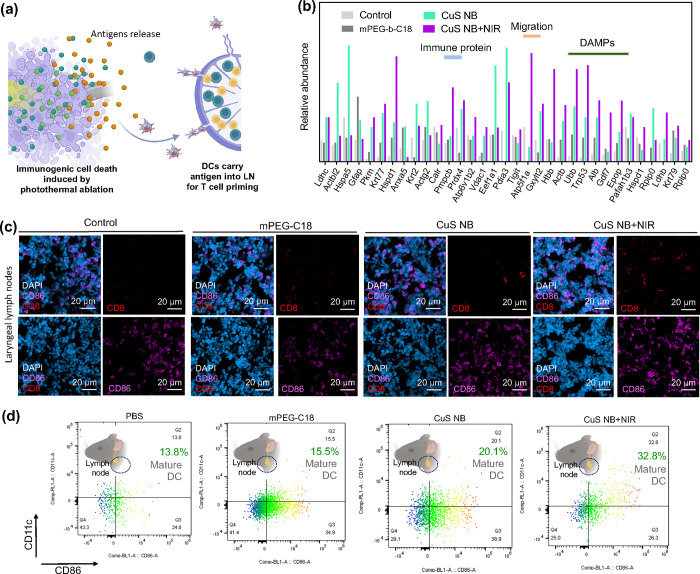
Figure 8 Antigen release and immune responses in laryngeal lymph nodes. (a) Illustration of antigen release and stimulation for immunotherapy. (b) Relative abundance of antigen release after treatment by mPEG-b-C18, CuS NB, and CuS NB+NIR. (c) In vivo study of mice bearing ALTS1C1 brain tumors treated with mPEG-b-C18, CuS NB, and CuS NB+NIR. CLSM images of the LN tissue 24 h postinjection. Blue, purple, and red fluorescence represents nucleus staining with DAPI, DCs with CD86, and T cells with CD8. (d) In vivo flow cytometry analysis of the LN tissue dissected 24 h post-treatment by mPEG-b-C18, CuS NB, and CuS NB+NIR.
Figure 8 Antigen release and immune responses in laryngeal lymph nodes. (a) Illustration of antigen release and stimulation for immunotherapy. (b) Relative abundance of antigen release after treatment by mPEG-b-C18, CuS NB, and CuS NB+NIR. (c) In vivo study of mice bearing ALTS1C1 brain tumors treated with mPEG-b-C18, CuS NB, and CuS NB+NIR. CLSM images of the LN tissue 24 h postinjection. Blue, purple, and red fluorescence represents nucleus staining with DAPI, DCs with CD86, and T cells with CD8. (d) In vivo flow cytometry analysis of the LN tissue dissected 24 h post-treatment by mPEG-b-C18, CuS NB, and CuS NB+NIR.CC BY · PubMed Central

Verification

Claims the paper makes

The claims and statistics of this paper haven’t been checked yet.

Run the check — free, no account needed. It reads the open-access text and checks the sources it cites.

A few free checks a day · papers already verified open instantly · results are public

Claims other papers make about this one

Each is checked against this paper’s own text: does it say what the citing paper says it does?

Self-check

Percentages, sums and reported differences re-computed from the paper’s own numbers.

The self-check needs the paper’s full text.

Citations

Cites

Show all 3 references

Research works printed but not linked: 60

  1. 10.1056/NEJMoa043330 · DOI · Paper page
  2. 10.1038/s41586-023-06678-1 · DOI
  3. 10.1021/acsnano.3c09273 · DOI
  4. 10.1038/s41467-023-39933-0 · DOI
  5. 10.1038/s41467-020-16682-y · DOI
  6. 10.1021/nn406197c · DOI
  7. 10.1038/s41551-023-01105-2 · DOI
  8. 10.1016/j.jocn.2020.01.009 · DOI
  9. 10.1016/j.ccell.2022.05.009 · DOI
  10. 10.1002/adma.202002054 · DOI · Paper page
  11. 10.1021/acsnano.8b00204 · DOI
  12. 10.1021/acsnano.1c09601 · DOI
  13. 10.1038/s41551-023-01050-0 · DOI
  14. 10.1021/acsnano.9b09884 · DOI
  15. 10.3390/ijms21218305 · DOI
  16. 10.1038/s41551-021-00768-z · DOI
  17. 10.3390/cells10020265 · DOI
  18. 10.1021/acs.nanolett.0c04122 · DOI
  19. 10.3390/cancers15164188 · DOI
  20. 10.1002/adfm.202401806 · DOI
  21. 10.1016/j.biomaterials.2023.122443 · DOI
  22. 10.1186/s12943-023-01865-0 · DOI
  23. 10.1021/acsnano.1c02103 · DOI
  24. 10.1038/s41467-023-35957-8 · DOI
  25. 10.1002/advs.202303566 · DOI
  26. 10.1016/j.jconrel.2023.06.033 · DOI
  27. 10.1038/s41565-022-01245-7 · DOI
  28. 10.1038/s41467-023-40015-4 · DOI
  29. 10.1039/D1NR03155D · DOI
  30. 10.1021/acsnano.7b01744 · DOI
  31. 10.1038/s41565-018-0356-z · DOI
  32. 10.1038/s41467-022-32532-5 · DOI
  33. 10.1021/nn305466z · DOI
  34. 10.1038/s41467-024-44814-1 · DOI
  35. 10.1021/acs.chemrev.7b00678 · DOI
  36. 10.1039/C8MH01286E · DOI
  37. 10.1038/s41467-023-42691-8 · DOI
  38. 10.1016/j.mtadv.2022.100339 · DOI
  39. 10.1038/s41563-023-01515-2 · DOI
  40. 10.1016/j.nantod.2023.101935 · DOI
  41. 10.1038/s41551-023-01086-2 · DOI
  42. 10.1186/s12951-021-01197-5 · DOI
  43. 10.1021/acsnano.9b00282 · DOI
  44. 10.1021/nn403035s · DOI
  45. 10.1016/j.matchemphys.2005.09.024 · DOI
  46. 10.1016/j.colsurfb.2021.112048 · DOI
  47. 10.1016/j.ijbiomac.2024.131359 · DOI
  48. 10.1038/s41598-018-36608-5 · DOI
  49. 10.1007/s13311-017-0520-4 · DOI
  50. 10.3171/jns.2004.100.3.0472 · DOI
  51. 10.1002/cpns.25 · DOI
  52. 10.3390/pharmaceutics14030527 · DOI
  53. 10.1021/acsnano.2c12532 · DOI
  54. 10.1002/adfm.202210644 · DOI
  55. 10.1038/s41419-023-05958-y · DOI
  56. 10.1016/j.jconrel.2023.05.028 · DOI
  57. 10.1227/NEU.0000000000001260 · DOI
  58. 10.1016/j.wneu.2020.03.213 · DOI
  59. 10.1016/j.wneu.2018.01.123 · DOI
  60. 10.1002/lsm.21138 · DOI

Cited by

Sorted by citations

See all 126

Metadata

Authors
Yalamandala, B. N., Chen, Y.-J., Lin, Y.-H., Huynh, T. M. H., Chiang, W.-H., Chou, T.-C., Liu, H.-W., Huang, C.-C., Lu, Y.-J., Chiang, C.-S., Chu, L.-A., & Hu, S.-H.
Venue
ACS Nano
Published
2024-07-02
Volume
18
Issue
28
Pages
18712-18728
ISSN
  • 1936-0851
  • 1936-086X
Cited by
126
References
3
Language
en
Funders
  • National Health Research Institutes (NHRI-EX112-11111EI)
  • National Tsing Hua University (111F7MELE1, 111Q2715E1)
  • Chang Gung Memorial Hospital (CORPG3L0061)
  • National Science and Technology Council (MOST 111-2636-B-007-007, MOST 111-2636-E-007-021, MOST-110-2634-F-007-025, NSTC 111-2321-B-A49-009, NSTC 112-2314-B-007-005-MY3, NSTC 112-2321-B-007-003, NSTC 112-2321-B-A49-007, NSTC 112-2326-B-007-006)

About these checks

Registry, retraction, Cites and statistics results are computed, not judged, with one exception: a printed reference that no index lists is read once by a model before it counts as a citation error. Claims are extracted by a model and kept only when their quote appears verbatim in the text; each cited source is then checked, with a model’s help, for whether it says what the claim relies on. Those verdicts can be wrong — read the claim’s quote and the cited source before relying on one.

Statistics and arithmetic are recomputed, not judged.

Confidence bands are shown only for fields calibrated on our annotated test set. None is calibrated yet, so no band is shown.

What counts as a claim ›How we measure confidence ›How we check this ›

Are you an author, or do you see a problem with this page? Request a review

How to cite

Cite CoChat for the checks on this page, and the paper for its own findings.

This page
CoChat. (2026). Citation check: A Self-Cascade Penetrating Brain Tumor Immunotherapy Mediated by Near-Infrared II Cell Membrane-Disrupting Nanoflakes via Detained Dendritic Cells. https://app.cochat.ai/papers/10.1021/acsnano.4c06183
The paper
Yalamandala, B. N., Chen, Y.-J., Lin, Y.-H., Huynh, T. M. H., Chiang, W.-H., Chou, T.-C., Liu, H.-W., Huang, C.-C., Lu, Y.-J., Chiang, C.-S., Chu, L.-A., & Hu, S.-H. (2024). A Self-Cascade Penetrating Brain Tumor Immunotherapy Mediated by Near-Infrared II Cell Membrane-Disrupting Nanoflakes via Detained Dendritic Cells. ACS Nano. https://doi.org/10.1021/acsnano.4c06183